Jump to a detailed profile or search site with Google Custom Search

JAARS, North Carolina (NC) Poverty Rate Data
Information about poor and low-income residents


Settings
X
Data:
Settings
Click to activate map...
Based on 2000-2022 data
Loading data...

123
Hide US histogram

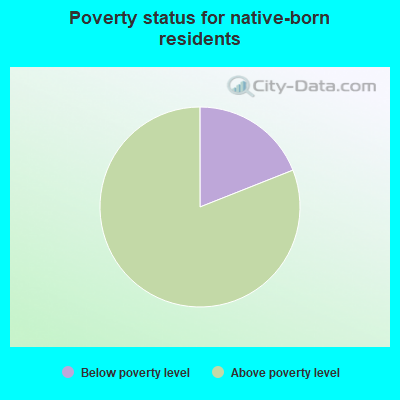
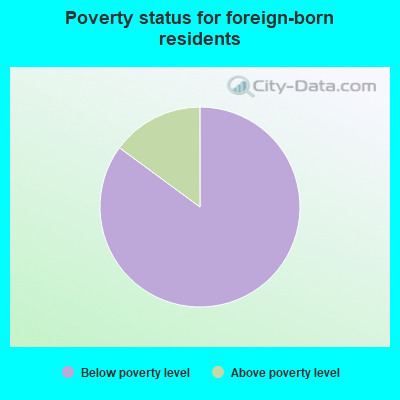
28.4% of JAARS, NC residents had an income below the poverty level in 2022, which was 55.1% greater than the poverty level of 12.8% across the entire state of North Carolina. The poverty rate was 54.1% among disabled residents.

Poverty rates in JAARS, NC

Residents with income below the poverty level in 2022:
JAARS:

28.4%
Whole state:

12.8%
Residents with income below 50% of the poverty level in 2022:
JAARS:

22.4%
Whole state:

6.0%

Poverty rate among disabled residents:
JAARS:

54.1%
North Carolina:

20.4%
Disability rate in this place among poor residents (it is 15.3% among residents who are not classified as poor):
JAARS:

45.5%
North Carolina:

22.0%

Poverty by age in JAARS, NC

Breakdown by age of poor male residents in JAARS
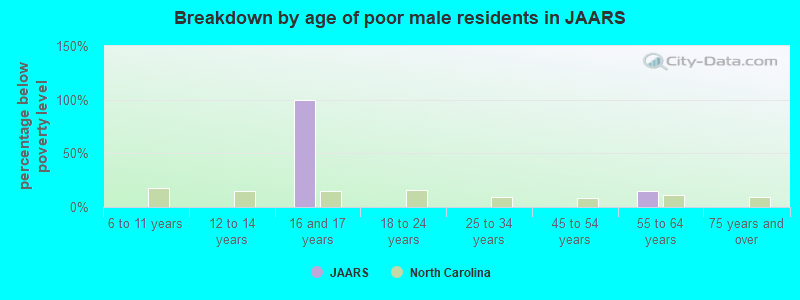
  • Breakdown by age of poor male residents in JAARS,NC (percentage below poverty level)
  • 0.0%6 to 11 years
  • 0.0%12 to 14 years
  • 100.0%16 and 17 years
  • 0.0%18 to 24 years
  • 0.0%25 to 34 years
  • 0.0%45 to 54 years
  • 15.0%55 to 64 years
  • 0.0%75 years and over
Breakdown by age of poor female residents in JAARS
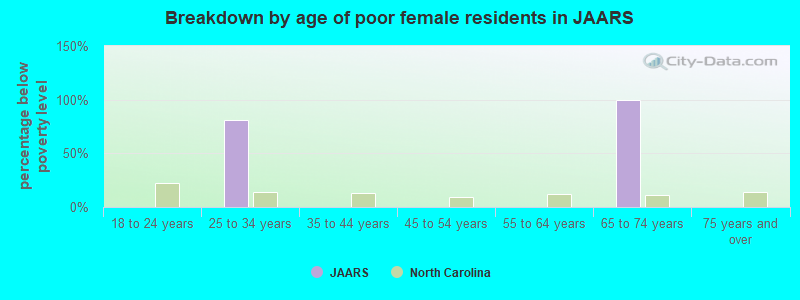
  • Breakdown by age of poor female residents in JAARS,NC (percentage below poverty level)
  • 0.0%18 to 24 years
  • 81.0%25 to 34 years
  • 0.0%35 to 44 years
  • 0.0%45 to 54 years
  • 0.0%55 to 64 years
  • 100.0%65 to 74 years
  • 0.0%75 years and over
Breakdown by age of very poor residents in JAARS, NC
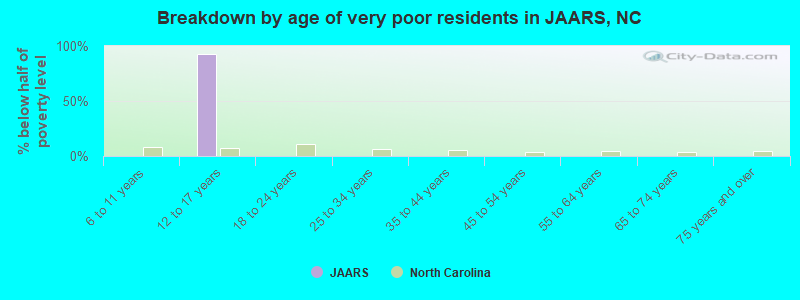
  • Breakdown by age of very poor residents in JAARS,NC (% below half of poverty level)
  • 0.0%6 to 11 years
  • 92.9%12 to 17 years
  • 0.0%18 to 24 years
  • 0.0%25 to 34 years
  • 0.0%35 to 44 years
  • 0.0%45 to 54 years
  • 0.0%55 to 64 years
  • 0.0%65 to 74 years
  • 0.0%75 years and over

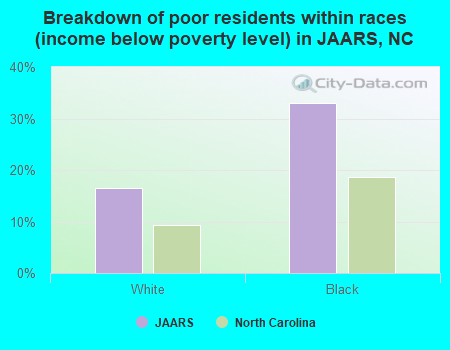
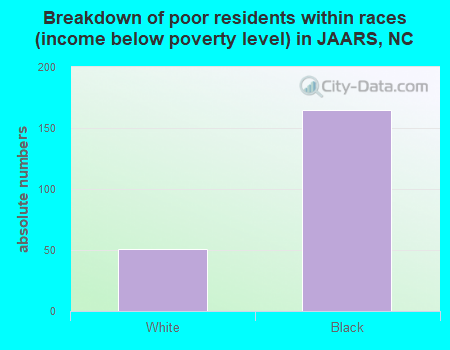
Poverty by race and place of birth in JAARS, NC

Breakdown of poor residents within races (income below poverty level) in JAARS, NC
  • Breakdown of poor residents within races in JAARS, NC (%)
  • 16.6%White
  • 33.0%Black
Breakdown of poor residents within races (income below poverty level) in JAARS, NC
  • Breakdown of poor residents within races in JAARS, NC (absolute numbers)
  • 51White
  • 165Black
Poverty status for native-born residents
  • 19.0%Below poverty level
  • 81.0%Above poverty level
Poverty status for foreign-born residents
  • 85.1%Below poverty level
  • 14.9%Above poverty level

Poverty in families in JAARS, NC

Poverty rate among high school graduates:
JAARS:

11.5%
North Carolina:

8.9%
Breakdown of poor residents in JAARS not in families by work experience
  • 0.0%Worked full-time, year-round
  • 5.7%Worked part-time
  • 94.3%Did not work
Breakdown of poor married-couple families by work experience
  • 0.0%Both worked full-time
  • 0.0%One full-time, other part-time
  • 100.0%One full-time, other didn't work
  • 0.0%Both worked part-time
  • 0.0%One part-time, other didn't work
  • 0.0%Both didn't work

Other data

Year house/condo built for residents below and above poverty levels
  • Owners below poverty level
  • 0.0%1999 to 2000
  • 0.0%1995 to 1998
  • 0.0%1990 to 1994
  • 52.6%1980 to 1989
  • 47.4%1970 to 1979
  • 0.0%1960 to 1969
  • 0.0%1950 to 1959
  • 0.0%1940 to 1949
  • 0.0%1939 or earlier
  • Owners above poverty level
  • 0.0%1999 to 2000
  • 34.7%1995 to 1998
  • 14.7%1990 to 1994
  • 25.3%1980 to 1989
  • 12.0%1970 to 1979
  • 13.3%1960 to 1969
  • 0.0%1950 to 1959
  • 0.0%1940 to 1949
  • 0.0%1939 or earlier
Discuss JAARS, North Carolina (NC) on our hugely popular North Carolina forum.


City-data.com does not guarantee the accuracy or timeliness of any information on this site.  Use at your own risk.
Some parts © 2024 Advameg, Inc.

Table of Contents