Oceanside, Oregon (OR) Poverty Rate Data
Data:
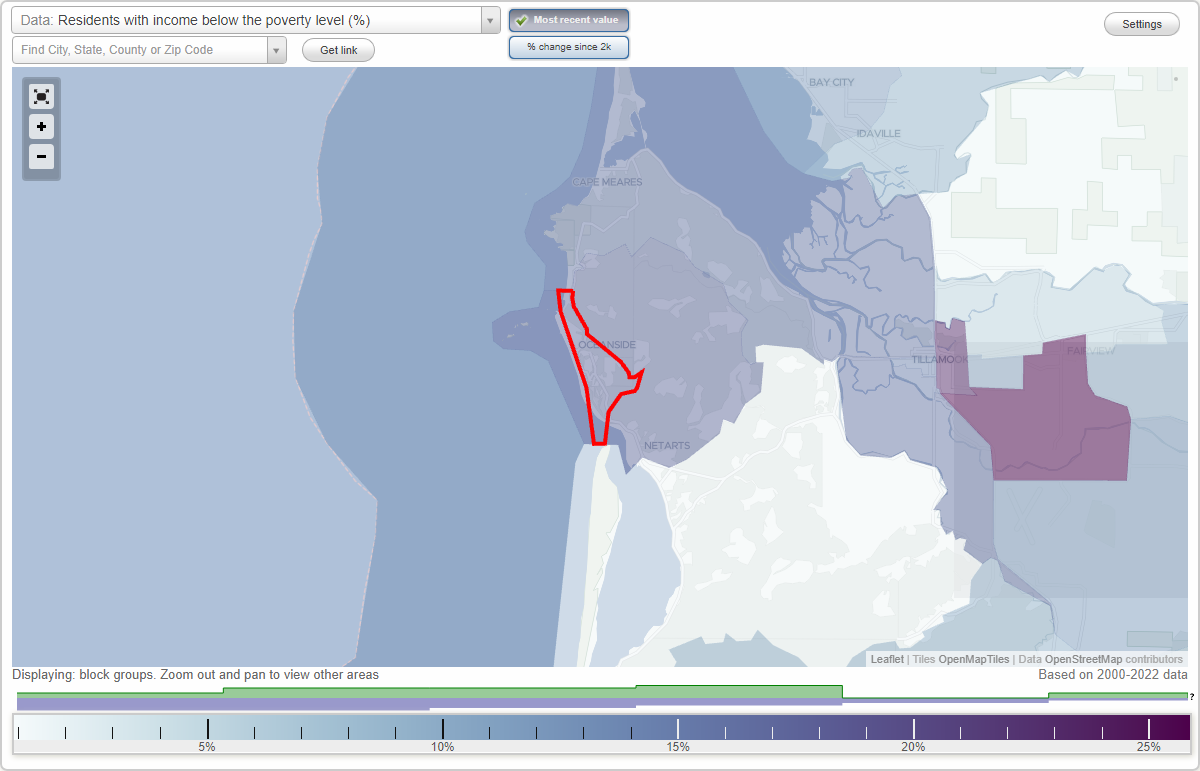
Residents with income below the poverty level (%)
Residents with income below the poverty level (% change since 2000)
Residents with income below the poverty level (%) - White
Residents with income below the poverty level (% change since 2000) - White
Residents with income below the poverty level (%) - Black or African American
Residents with income below the poverty level (% change since 2000) - Black or African American
Residents with income below the poverty level (%) - Asian
Residents with income below the poverty level (% change since 2000) - Asian
Residents with income below the poverty level (%) - Hispanic or Latino
Residents with income below the poverty level (% change since 2000) - Hispanic or Latino
Residents with income below the poverty level (%) - American Indian and Alaska Native
Residents with income below the poverty level (% change since 2000) - American Indian and Alaska Native
Residents with income below the poverty level (%) - Multirace
Residents with income below the poverty level (% change since 2000) - Multirace
Residents with income below the poverty level (%) - Other
Residents with income below the poverty level (% change since 2000) - Other
Residents with income below 50% of the poverty level (%)
Poor families by family type - Married-couple family (%)
Poor families by family type - Married-couple family (% change since 2000)
Poor families by family type - Male, no wife present (%)
Poor families by family type - Male, no wife present (% change since 2000)
Poor families by family type - Female, no husband present (%)
Poor families by family type - Female, no husband present (% change since 2000)
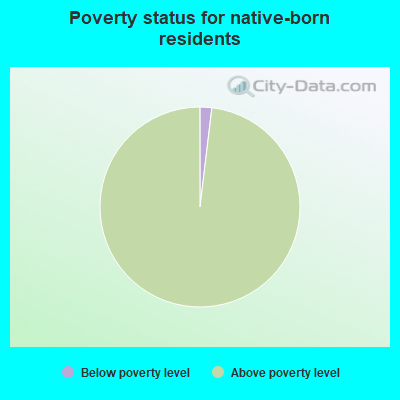
Poverty status for native-born residents (%)
Poverty status for native-born residents (% change since 2000)
Poverty status for foreign-born residents (%)
Poverty status for foreign-born residents (% change since 2000)
Children below poverty level (%)
Poverty among high school graduates not in families (%)
Poverty among people who did not graduate high school not in families (%)
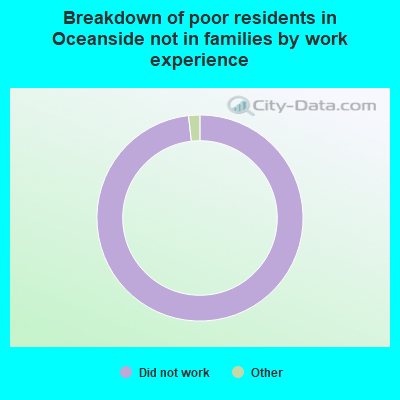
Breakdown of poor residents not in families by work experience - Worked full-time, year-round (%)
Breakdown of poor residents not in families by work experience - Worked part-time (%)
Breakdown of poor residents not in families by work experience - Did not work (%)
Breakdown of poor married-couple families by work experience - Both worked full-time (%)
Breakdown of poor married-couple families by work experience - One full-time, other part-time (%)
Breakdown of poor married-couple families by work experience - One full-time, other didn't work (%)
Breakdown of poor married-couple families by work experience - Both worked part-time (%)
Breakdown of poor married-couple families by work experience - One part-time, other didn't work (%)
Breakdown of poor married-couple families by work experience - Both didn't work (%)
Renting rate among poor residents (%)
Renting rate among not poor residents (%)
1.9% of Oceanside, OR residents had an income below the poverty level in 2022, which was 535.1% less than the poverty level of 12.1% across the entire state of Oregon.
Poverty rates in Oceanside, OR Residents with income below the poverty level in 2022:
Oceanside:
1.9%Whole state:
12.1%
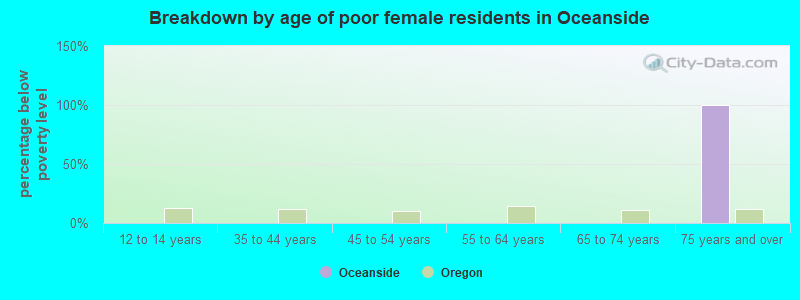
Poverty by age in Oceanside, OR
Breakdown by age of poor female residents in Oceanside,OR (percentage below poverty level) 0.0% 12 to 14 years0.0% 35 to 44 years0.0% 45 to 54 years0.0% 55 to 64 years0.0% 65 to 74 years100.0% 75 years and over
Poverty by race and place of birth in Oceanside, OR
1.9% Below poverty level98.1% Above poverty level
Poverty in families in Oceanside, OR Poverty rate among high school graduates: Oceanside:
2.1%Oregon:
9.5%
0.0% Worked full-time, year-round0.0% Worked part-time100.0% Did not work