Races in Ashland, California (CA) Detailed Stats
Data:
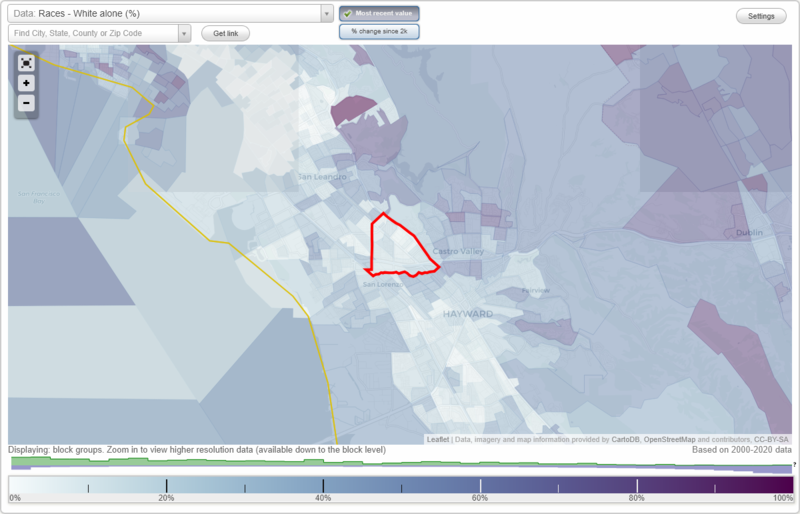
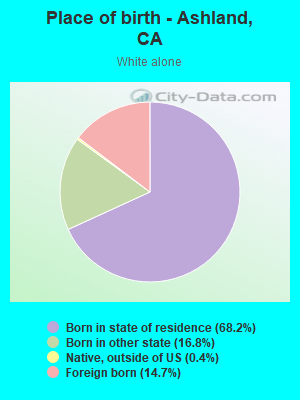
Races - White alone (%)
Races - White alone (% change since 2000)
Races - Black alone (%)
Races - Black alone (% change since 2000)
Races - American Indian alone (%)
Races - American Indian alone (% change since 2000)
Races - Asian alone (%)
Races - Asian alone (% change since 2000)
Races - Hispanic (%)
Races - Hispanic (% change since 2000)
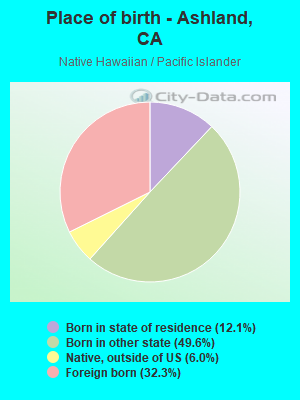
Races - Native Hawaiian and Other Pacific Islander alone (%)
Races - Native Hawaiian and Other Pacific Islander alone (% change since 2000)
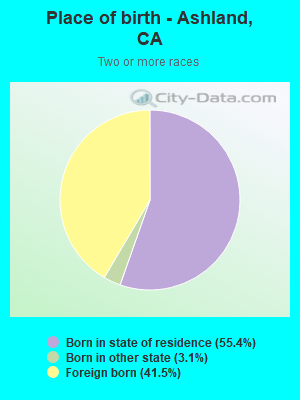
Races - Two or more races(%)
Races - Two or more races(% change since 2000)
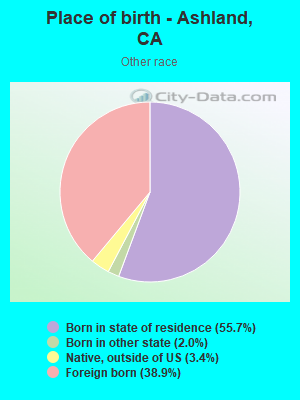
Races - Other race alone (%)
Races - Other race alone (% change since 2000)
Racial diversity
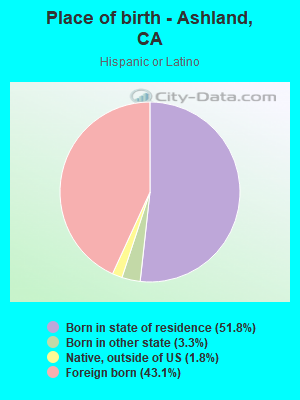
Place of birth - Born in state of residence (%)
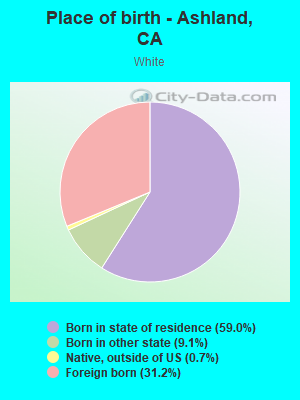
Place of birth - Born in state of residence (%) - White
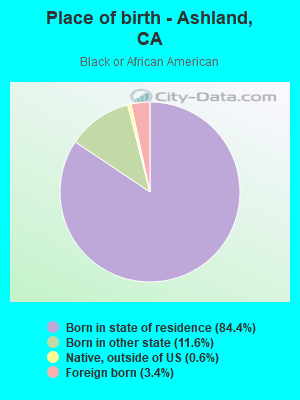
Place of birth - Born in state of residence (%) - Black or African American
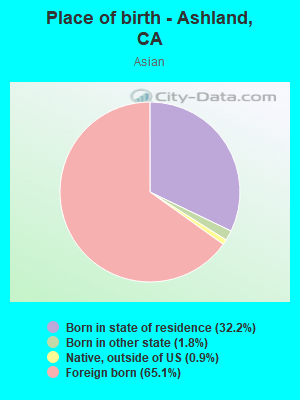
Place of birth - Born in state of residence (%) - Asian
Place of birth - Born in state of residence (%) - Hispanic or Latino
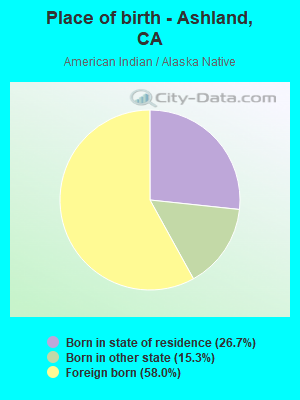
Place of birth - Born in state of residence (%) - American Indian and Alaska Native
Place of birth - Born in state of residence (%) - Multirace
Place of birth - Born in state of residence (%) - Other Race
Place of birth - Born in other state (%)
Place of birth - Born in other state (%) - White
Place of birth - Born in other state (%) - Black or African American
Place of birth - Born in other state (%) - Asian
Place of birth - Born in other state (%) - Hispanic or Latino
Place of birth - Born in other state (%) - American Indian and Alaska Native
Place of birth - Born in other state (%) - Multirace
Place of birth - Born in other state (%) - Other Race
Place of birth - Native, outside of US (%)
Place of birth - Native, outside of US (%) - White
Place of birth - Native, outside of US (%) - Black or African American
Place of birth - Native, outside of US (%) - Asian
Place of birth - Native, outside of US (%) - Hispanic or Latino
Place of birth - Native, outside of US (%) - American Indian and Alaska Native
Place of birth - Native, outside of US (%) - Multirace
Place of birth - Native, outside of US (%) - Other Race
Place of birth - Foreign born (%)
Place of birth - Foreign born (%) - White
Place of birth - Foreign born (%) - Black or African American
Place of birth - Foreign born (%) - Asian
Place of birth - Foreign born (%) - Hispanic or Latino
Place of birth - Foreign born (%) - American Indian and Alaska Native
Place of birth - Foreign born (%) - Multirace
Place of birth - Foreign born (%) - Other Race
Residents speaking English at home (%)
Residents speaking English at home - Born in the United States (%)
Residents speaking English at home - Native, born elsewhere (%)
Residents speaking English at home - Foreign born (%)
Residents speaking Spanish at home (%)
Residents speaking Spanish at home - Born in the United States (%)
Residents speaking Spanish at home - Native, born elsewhere (%)
Residents speaking Spanish at home - Foreign born (%)
Residents speaking other language at home (%)
Residents speaking other language at home - Born in the United States (%)
Residents speaking other language at home - Native, born elsewhere (%)
Residents speaking other language at home - Foreign born (%)
Marital status - Never married (%)
Marital status - Now married (%)
Marital status - Separated (%)
Marital status - Widowed (%)
Marital status - Divorced (%)
Ancestries Reported - Arab (%)
Ancestries Reported - Czech (%)
Ancestries Reported - Danish (%)
Ancestries Reported - Dutch (%)
Ancestries Reported - English (%)
Ancestries Reported - French (%)
Ancestries Reported - French Canadian (%)
Ancestries Reported - German (%)
Ancestries Reported - Greek (%)
Ancestries Reported - Hungarian (%)
Ancestries Reported - Irish (%)
Ancestries Reported - Italian (%)
Ancestries Reported - Lithuanian (%)
Ancestries Reported - Norwegian (%)
Ancestries Reported - Polish (%)
Ancestries Reported - Portuguese (%)
Ancestries Reported - Russian (%)
Ancestries Reported - Scotch-Irish (%)
Ancestries Reported - Scottish (%)
Ancestries Reported - Slovak (%)
Ancestries Reported - Subsaharan African (%)
Ancestries Reported - Swedish (%)
Ancestries Reported - Swiss (%)
Ancestries Reported - Ukrainian (%)
Ancestries Reported - United States (%)
Ancestries Reported - Welsh (%)
Ancestries Reported - West Indian (%)
Ancestries Reported - Other (%)
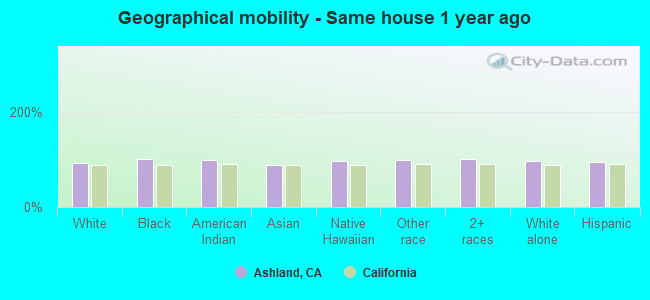
Geographical mobility - Same house 1 year ago (%)
Geographical mobility - Same house 1 year ago (%) - White
Geographical mobility - Same house 1 year ago (%) - Black or African American
Geographical mobility - Same house 1 year ago (%) - Asian
Geographical mobility - Same house 1 year ago (%) - Hispanic or Latino
Geographical mobility - Same house 1 year ago (%) - American Indian and Alaska Native
Geographical mobility - Same house 1 year ago (%) - Multirace
Geographical mobility - Same house 1 year ago (%) - Other Race
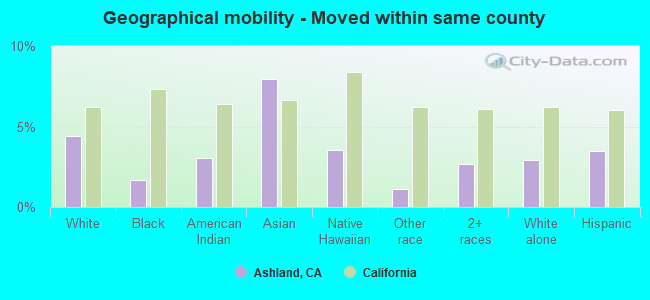
Geographical mobility - Moved within same county (%)
Geographical mobility - Moved within same county (%) - White
Geographical mobility - Moved within same county (%) - Black or African American
Geographical mobility - Moved within same county (%) - Asian
Geographical mobility - Moved within same county (%) - Hispanic or Latino
Geographical mobility - Moved within same county (%) - American Indian and Alaska Native
Geographical mobility - Moved within same county (%) - Multirace
Geographical mobility - Moved within same county (%) - Other Race
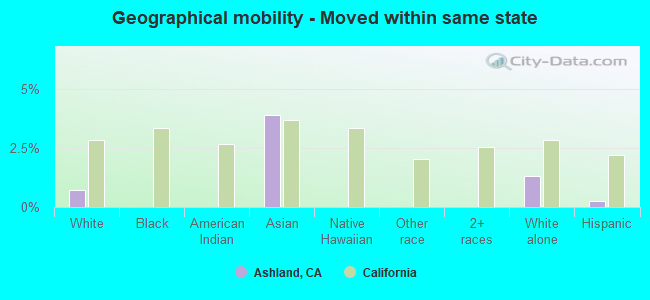
Geographical mobility - Moved from different county within same state (%)
Geographical mobility - Moved from different county within same state (%) - White
Geographical mobility - Moved from different county within same state (%) - Black or African American
Geographical mobility - Moved from different county within same state (%) - Asian
Geographical mobility - Moved from different county within same state (%) - Hispanic or Latino
Geographical mobility - Moved from different county within same state (%) - American Indian and Alaska Native
Geographical mobility - Moved from different county within same state (%) - Multirace
Geographical mobility - Moved from different county within same state (%) - Other Race
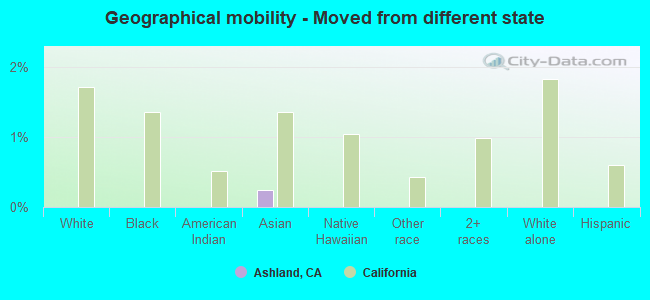
Geographical mobility - Moved from different state (%)
Geographical mobility - Moved from different state (%) - White
Geographical mobility - Moved from different state (%) - Black or African American
Geographical mobility - Moved from different state (%) - Asian
Geographical mobility - Moved from different state (%) - Hispanic or Latino
Geographical mobility - Moved from different state (%) - American Indian and Alaska Native
Geographical mobility - Moved from different state (%) - Multirace
Geographical mobility - Moved from different state (%) - Other Race
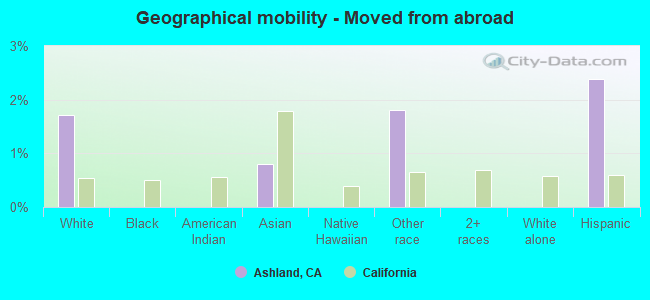
Geographical mobility - Moved from abroad (%)
Geographical mobility - Moved from abroad (%) - White
Geographical mobility - Moved from abroad (%) - Black or African American
Geographical mobility - Moved from abroad (%) - Asian
Geographical mobility - Moved from abroad (%) - Hispanic or Latino
Geographical mobility - Moved from abroad (%) - American Indian and Alaska Native
Geographical mobility - Moved from abroad (%) - Multirace
Geographical mobility - Moved from abroad (%) - Other Race
Place of birth for the foreign-born population - Ireland (%)
Place of birth for the foreign-born population - Denmark (%)
Place of birth for the foreign-born population - Norway (%)
Place of birth for the foreign-born population - Sweden (%)
Place of birth for the foreign-born population - United Kingdom (%)
Place of birth for the foreign-born population - England (%)
Place of birth for the foreign-born population - Scotland (%)
Place of birth for the foreign-born population - Other Northern Europe (%)
Place of birth for the foreign-born population - Austria (%)
Place of birth for the foreign-born population - Belgium (%)
Place of birth for the foreign-born population - France (%)
Place of birth for the foreign-born population - Germany (%)
Place of birth for the foreign-born population - Netherlands (%)
Place of birth for the foreign-born population - Switzerland (%)
Place of birth for the foreign-born population - Other Western Europe (%)
Place of birth for the foreign-born population - Greece (%)
Place of birth for the foreign-born population - Italy (%)
Place of birth for the foreign-born population - Portugal (%)
Place of birth for the foreign-born population - Spain (%)
Place of birth for the foreign-born population - Other Southern Europe (%)
Place of birth for the foreign-born population - Albania (%)
Place of birth for the foreign-born population - Belarus (%)
Place of birth for the foreign-born population - Bosnia and Herzegovina (%)
Place of birth for the foreign-born population - Bulgaria (%)
Place of birth for the foreign-born population - Croatia (%)
Place of birth for the foreign-born population - Czechoslovakia (%)
Place of birth for the foreign-born population - Hungary (%)
Place of birth for the foreign-born population - Latvia (%)
Place of birth for the foreign-born population - Lithuania (%)
Place of birth for the foreign-born population - North Macedonia (Macedonia) (%)
Place of birth for the foreign-born population - Moldova (%)
Place of birth for the foreign-born population - Poland (%)
Place of birth for the foreign-born population - Romania (%)
Place of birth for the foreign-born population - Russia (%)
Place of birth for the foreign-born population - Serbia (%)
Place of birth for the foreign-born population - Ukraine (%)
Place of birth for the foreign-born population - Other Eastern Europe (%)
Place of birth for the foreign-born population - China (%)
Place of birth for the foreign-born population - Hong Kong (%)
Place of birth for the foreign-born population - Taiwan (%)
Place of birth for the foreign-born population - Japan (%)
Place of birth for the foreign-born population - Korea (%)
Place of birth for the foreign-born population - Other Eastern Asia (%)
Place of birth for the foreign-born population - Afghanistan (%)
Place of birth for the foreign-born population - Bangladesh (%)
Place of birth for the foreign-born population - India (%)
Place of birth for the foreign-born population - Iran (%)
Place of birth for the foreign-born population - Kazakhstan (%)
Place of birth for the foreign-born population - Nepal (%)
Place of birth for the foreign-born population - Pakistan (%)
Place of birth for the foreign-born population - Sri Lanka (%)
Place of birth for the foreign-born population - Uzbekistan (%)
Place of birth for the foreign-born population - Other South Central Asia (%)
Place of birth for the foreign-born population - Burma (%)
Place of birth for the foreign-born population - Cambodia (%)
Place of birth for the foreign-born population - Indonesia (%)
Place of birth for the foreign-born population - Laos (%)
Place of birth for the foreign-born population - Malaysia (%)
Place of birth for the foreign-born population - Philippines (%)
Place of birth for the foreign-born population - Singapore (%)
Place of birth for the foreign-born population - Thailand (%)
Place of birth for the foreign-born population - Vietnam (%)
Place of birth for the foreign-born population - Other South Eastern Asia (%)
Place of birth for the foreign-born population - Armenia (%)
Place of birth for the foreign-born population - Iraq (%)
Place of birth for the foreign-born population - Israel (%)
Place of birth for the foreign-born population - Jordan (%)
Place of birth for the foreign-born population - Kuwait (%)
Place of birth for the foreign-born population - Lebanon (%)
Place of birth for the foreign-born population - Saudi Arabia (%)
Place of birth for the foreign-born population - Syria (%)
Place of birth for the foreign-born population - Turkey (%)
Place of birth for the foreign-born population - Yemen (%)
Place of birth for the foreign-born population - Other Western Asia (%)
Place of birth for the foreign-born population - Eritrea (%)
Place of birth for the foreign-born population - Ethiopia (%)
Place of birth for the foreign-born population - Kenya (%)
Place of birth for the foreign-born population - Somalia (%)
Place of birth for the foreign-born population - Uganda (%)
Place of birth for the foreign-born population - Zimbabwe (%)
Place of birth for the foreign-born population - Other Eastern Africa (%)
Place of birth for the foreign-born population - Cameroon (%)
Place of birth for the foreign-born population - Congo (%)
Place of birth for the foreign-born population - Democratic Republic of Congo (Zaire) (%)
Place of birth for the foreign-born population - Other Middle Africa (%)
Place of birth for the foreign-born population - Egypt (%)
Place of birth for the foreign-born population - Morocco (%)
Place of birth for the foreign-born population - Sudan (%)
Place of birth for the foreign-born population - Other Northern Africa (%)
Place of birth for the foreign-born population - South Africa (%)
Place of birth for the foreign-born population - Other Southern Africa (%)
Place of birth for the foreign-born population - Cabo Verde (%)
Place of birth for the foreign-born population - Ghana (%)
Place of birth for the foreign-born population - Liberia (%)
Place of birth for the foreign-born population - Nigeria (%)
Place of birth for the foreign-born population - Senegal (%)
Place of birth for the foreign-born population - Sierra Leone (%)
Place of birth for the foreign-born population - Other Western Africa (%)
Place of birth for the foreign-born population - Australia (%)
Place of birth for the foreign-born population - New Zealand (%)
Place of birth for the foreign-born population - Fiji (%)
Place of birth for the foreign-born population - Micronesia (%)
Place of birth for the foreign-born population - Bahamas (%)
Place of birth for the foreign-born population - Barbados (%)
Place of birth for the foreign-born population - Cuba (%)
Place of birth for the foreign-born population - Dominica (%)
Place of birth for the foreign-born population - Dominican Republic (%)
Place of birth for the foreign-born population - Grenada (%)
Place of birth for the foreign-born population - Haiti (%)
Place of birth for the foreign-born population - Jamaica (%)
Place of birth for the foreign-born population - St. Vincent and the Grenadines (%)
Place of birth for the foreign-born population - Trinidad and Tobago (%)
Place of birth for the foreign-born population - West Indies (%)
Place of birth for the foreign-born population - Other Caribbean (%)
Place of birth for the foreign-born population - Belize (%)
Place of birth for the foreign-born population - Costa Rica (%)
Place of birth for the foreign-born population - El Salvador (%)
Place of birth for the foreign-born population - Guatemala (%)
Place of birth for the foreign-born population - Honduras (%)
Place of birth for the foreign-born population - Mexico (%)
Place of birth for the foreign-born population - Nicaragua (%)
Place of birth for the foreign-born population - Panama (%)
Place of birth for the foreign-born population - Other Central America (%)
Place of birth for the foreign-born population - Argentina (%)
Place of birth for the foreign-born population - Bolivia (%)
Place of birth for the foreign-born population - Brazil (%)
Place of birth for the foreign-born population - Chile (%)
Place of birth for the foreign-born population - Colombia (%)
Place of birth for the foreign-born population - Ecuador (%)
Place of birth for the foreign-born population - Guyana (%)
Place of birth for the foreign-born population - Peru (%)
Place of birth for the foreign-born population - Uruguay (%)
Place of birth for the foreign-born population - Venezuela (%)
Place of birth for the foreign-born population - Other South America (%)
Place of birth for the foreign-born population - Canada (%)
Place of birth for the foreign-born population - Other Northern America (%)
Place of birth for the foreign-born population - Other (%)
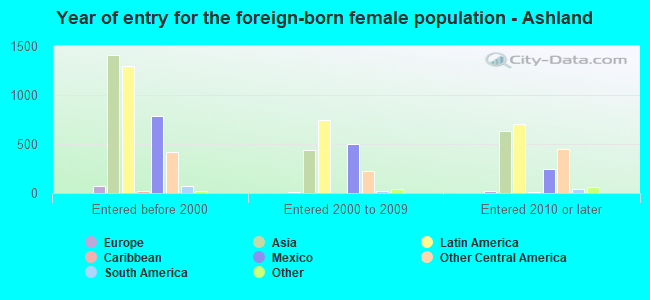
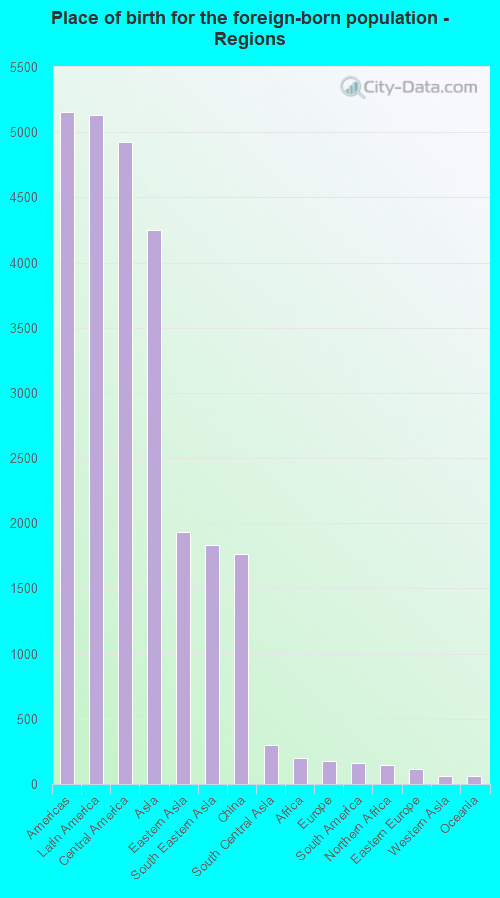
According to 2022 data, the most numerous races in Ashland, CA are Hispanic (11,351 residents), White alone (2,573 residents), and Asian alone (6,387 residents). 39.7% of Ashland residents speak English at home. 39.9% of Ashland, CA residents are foreign-born (20.7% born in Latin America, 17.2% born in Asia), which is 34.8% greater than the foreign-born rate of 26.0% across the entire state of California.
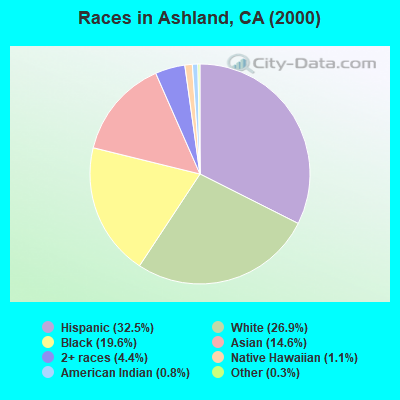
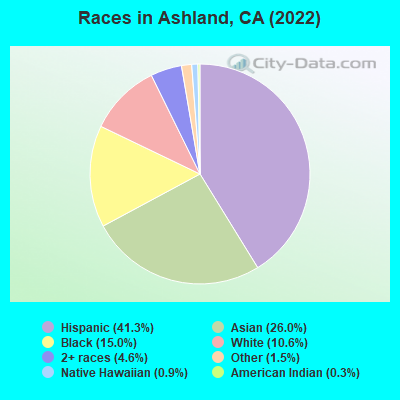
Race distribution in Ashland
2000 2022
15,816,790 46.7% White alone 10,966,556 32.4% Hispanic 3,648,860 10.8% Asian alone 2,181,926 6.4% Black alone 903,115 2.7% Two or more races 178,984 0.5% American Indian alone 103,736 0.3% Native Hawaiian and Other 71,681 0.2% Other race alone
15,732,184 40.3% Hispanic 13,160,426 33.7% White alone 5,957,867 15.3% Asian alone 2,025,218 5.2% Black alone 1,663,222 4.3% Two or more races 251,618 0.6% Other race alone 135,777 0.3% Native Hawaiian and Other 103,030 0.3% American Indian alone
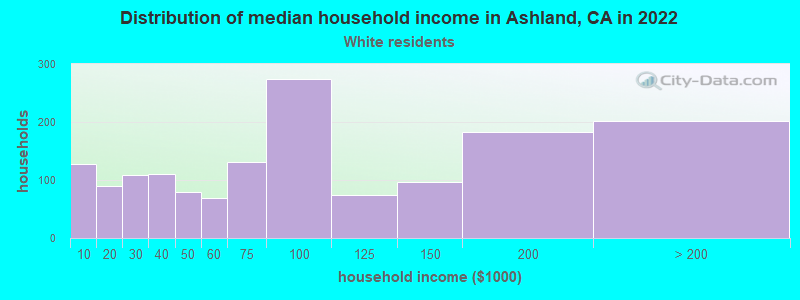
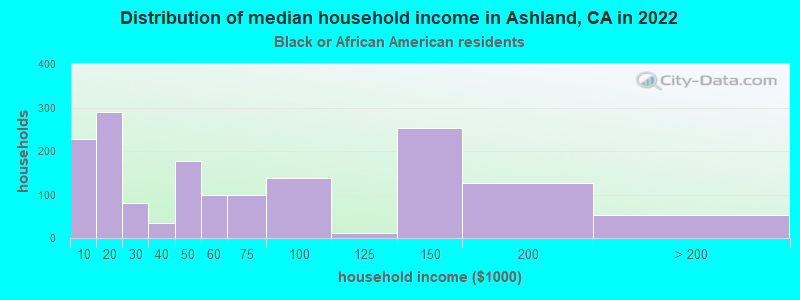
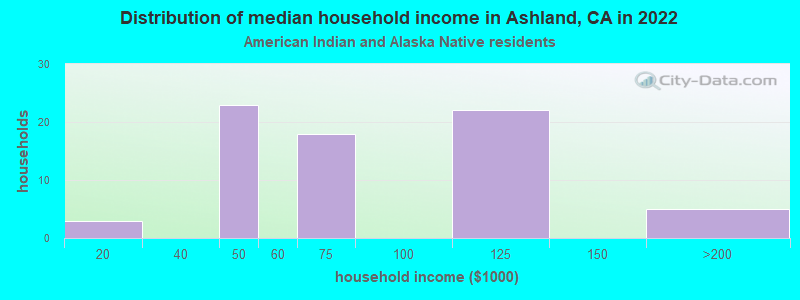
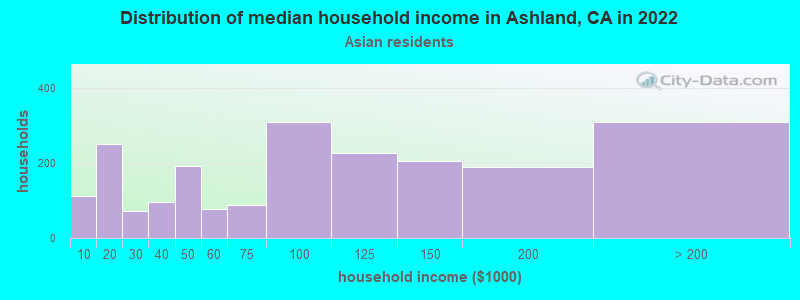
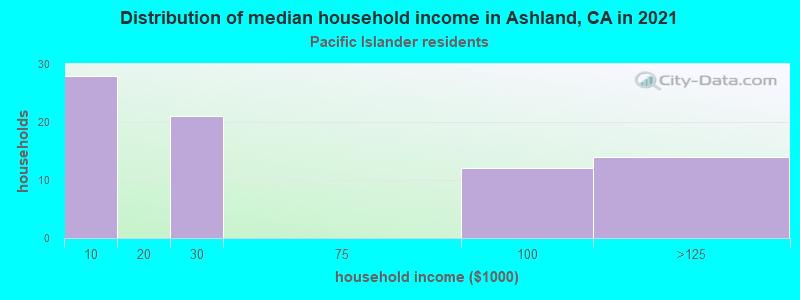
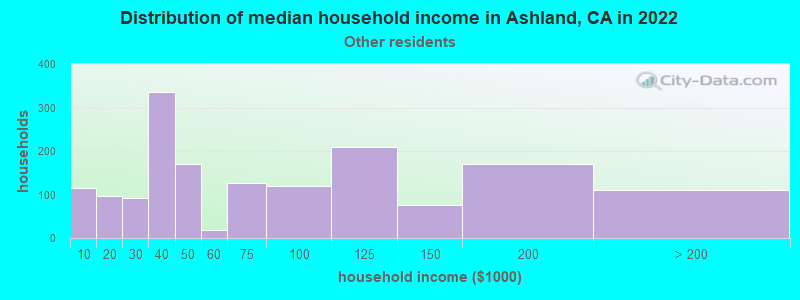
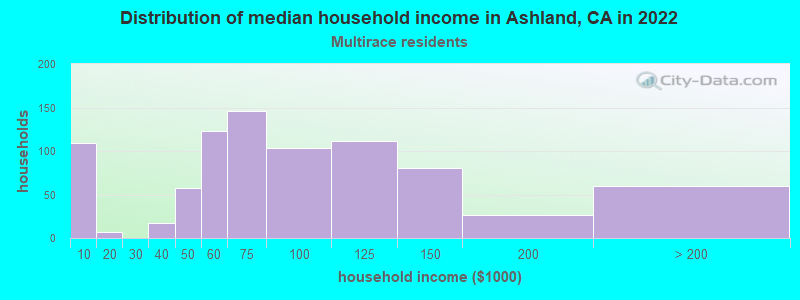
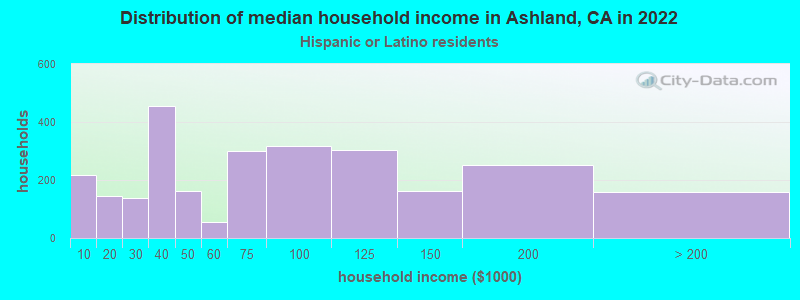
Income and house value in Ashland Median household income in 2022 $68,516 White non-Hispanic householders$69,504 Black householders$66,246 American Indian and Alaska Native householders$101,562 Asian householders$91,201 Native Hawaiian and other Pacific Islander householders$80,576 Some other race householders$77,693 Two or more races householders$102,799 Hispanic or Latino race householdersMedian 2022 house value $653,992 White Non-Hispanic householders$655,071 Black or African American householders$989,806 American Indian or Alaska Native householders $887,226 Asian householders$504,981 Native Hawaiian and other Pacific Islander householders$679,907 Some other race householders$701,862 Two or more races householders$688,905 Hispanic or Latino householders
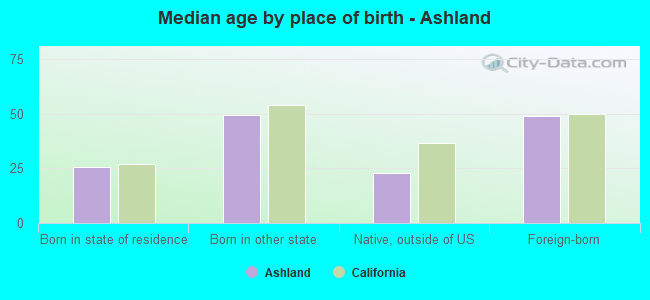
Median age by race in Ashland
34.6 Median age for White residents34.7 36.2 36.2 Median age for Black or African American residents26.1 37.7 21.1 Median age for American Indian / Alaska Native residents8.8 30.0 41.5 Median age for Asian residents41.3 42.1 46.7 Median age for Native Hawaiian / Pacific Islander residents45.5 44.2 32.6 Median age for Other race residents31.2 34.1 37.0 Median age for Two or more races residents38.4 35.5 45.0 Median age for White alone residents39.9 48.9 31.9 Median age for Hispanic or Latino residents32.2 31.4
Owner/renter occupied households by race in Ashland
House owners and renters - White residents 955 38.1% Owner occupied1,554 61.9% Renter occupiedHouse owners and renters - Black or African American residents 104 6.7% Owner occupied1,441 93.3% Renter occupiedHouse owners and renters - American Indian / Alaska Native residents 90 100.0% Renter occupiedHouse owners and renters - Asian residents 1,402 72.1% Owner occupied542 27.9% Renter occupiedHouse owners and renters - Native Hawaiian / Pacific Islander residents 14 28.1% Owner occupied35 71.9% Renter occupiedHouse owners and renters - Other race residents 401 32.8% Owner occupied820 67.2% Renter occupiedHouse owners and renters - Two or more races residents 336 27.7% Owner occupied877 72.3% Renter occupiedHouse owners and renters - White alone residents 620 51.0% Owner occupied597 49.0% Renter occupiedHouse owners and renters - Hispanic or Latino residents 875 28.4% Owner occupied2,205 71.6% Renter occupied
Language usage in Ashland
English speakers - Total 39.7% of residents of Ashland speak English at home.
35.5% of residents speak Spanish at home 4,405 54.2% Speak English very well3,721 45.8% Speak English less than very well24.3% of residents speak other language at home 2,113 38.0% Speak English very well3,454 62.0% Speak English less than very well
English speakers - Born in the United States 75.3% of residents of Ashland speak English at home.
16.9% of residents speak Spanish at home 198 77.6% Speak English very well57 22.4% Speak English less than very well8.0% of residents speak other language at home 110 90.9% Speak English very well11 9.1% Speak English less than very well
English speakers - Native, born elsewhere 25.5% of residents of Ashland speak English at home.
51.1% of residents speak Spanish at home 118 100.0% Speak English very well22.9% of residents speak other language at home 35 66.0% Speak English very well18 34.0% Speak English less than very well
English speakers - Foreign-born 7.4% of residents of Ashland speak English at home.
47.6% of residents speak Spanish at home 1,437 31.8% Speak English very well3,078 68.2% Speak English less than very well44.0% of residents speak other language at home 1,186 28.4% Speak English very well2,984 71.6% Speak English less than very well
White (Caucasian) - Speak only English Native:
60.2% (2,623)Foreign-born:
9.5% (198)
White (Caucasian) - Speak another language Native:
34.2% (1,489)Foreign-born:
86.6% (1,810)
Black or African American - Speak only English Native:
93.7% (2,787)Foreign-born:
64.3% (75)
Black or African American - Speak another language Native:
6.4% (191)Foreign-born:
46.9% (55)
American Indian / Alaska Native - Speak another language Native:
44.7% (106)Foreign-born:
100.0% (300)
Asian - Speak only English Native:
43.3% (884)Foreign-born:
9.2% (371)
Asian - Speak another language Native:
55.6% (1,134)Foreign-born:
90.5% (3,639)
Native Hawaiian / Pacific Islander - Speak another language Native:
18.5% (14)Foreign-born:
100.0% (50)
Other race - Speak only English Native:
45.3% (1,232)Foreign-born:
5.6% (103)
Other race - Speak another language Native:
58.5% (1,591)Foreign-born:
94.3% (1,722)
Two or more races - Speak only English Native:
73.8% (1,635)Foreign-born:
3.1% (55)
Two or more races - Speak another language Native:
12.2% (270)Foreign-born:
100.0% (1,786)
White alone - Speak only English Native:
86.4% (1,883)Foreign-born:
23.7% (91)
White alone - Speak another language Native:
15.2% (331)Foreign-born:
77.0% (296)
Hispanic or Latino - Speak only English Native:
39.6% (2,316)Foreign-born:
7.0% (314)
Hispanic or Latino - Speak another language Native:
59.9% (3,505)Foreign-born:
93.5% (4,219)
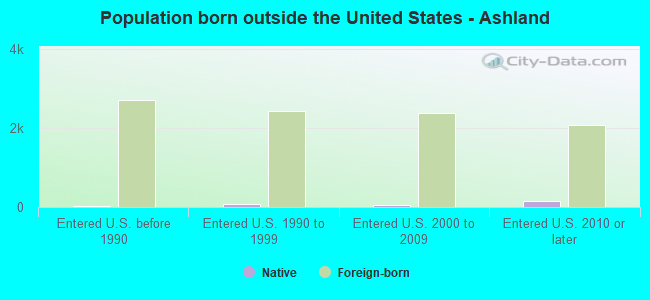
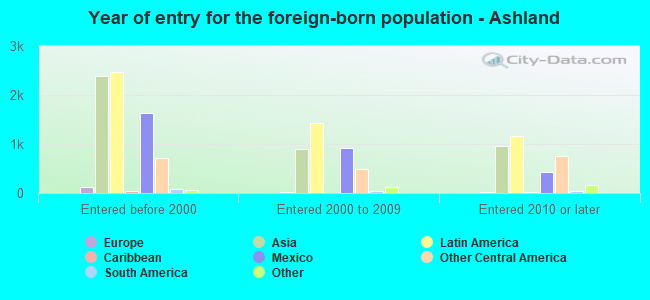
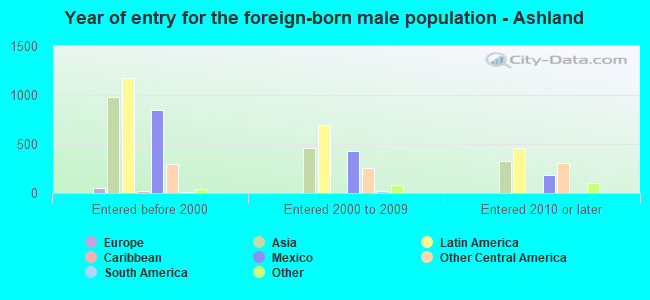
Foreign-born residents in Ashland 9,843 residents are foreign born (20.7% Latin America , 17.2% Asia ).
This city:
39.9%California:
100.0%
Marital status for residents in Ashland Marital status - White (Caucasian) population 15 years and over
Males 50.4% Never married36.8% Now married2.9% Separated2.9% Widowed7.0% DivorcedFemales 39.1% Never married35.9% Now married4.1% Separated5.7% Widowed15.2% DivorcedWomen who gave birth in the past 12 months Now married:
80.2% (77)Unmarried:
19.8% (19)
Women who did not give birth in the past 12 months Now married:
39.7% (699)Unmarried:
60.3% (1,063)
Marital status - Black or African American population 15 years and over
Males 74.5% Never married14.6% Now married2.0% Separated0.9% Widowed8.0% DivorcedFemales 65.3% Never married9.5% Now married6.0% Separated7.8% Widowed11.3% DivorcedWomen who did not give birth in the past 12 months Now married:
19.8% (244)Unmarried:
80.2% (987)
Marital status - American Indian / Alaska Native population 15 years and over
Males 72.1% Never married27.9% Now married0.0% Separated0.0% Widowed0.0% DivorcedFemales 70.8% Never married25.0% Now married0.0% Separated0.0% Widowed4.2% DivorcedWomen who did not give birth in the past 12 months Now married:
15.9% (34)Unmarried:
84.1% (180)
Marital status - Asian population 15 years and over
Males 30.3% Never married58.7% Now married1.6% Separated3.8% Widowed5.5% DivorcedFemales 34.0% Never married44.8% Now married2.5% Separated13.3% Widowed5.3% DivorcedWomen who gave birth in the past 12 months Now married:
53.5% (24)Unmarried:
46.5% (21)
Women who did not give birth in the past 12 months Now married:
44.8% (700)Unmarried:
55.2% (864)
Marital status - Native Hawaiian / Pacific Islander population 15 years and over
Males 0.0% Never married45.6% Now married0.0% Separated0.0% Widowed54.4% DivorcedFemales 11.9% Never married0.0% Now married0.0% Separated19.0% Widowed69.0% DivorcedWomen who did not give birth in the past 12 months Now married:
0.0% (0)Unmarried:
100.0% (24)
Marital status - Other race population 15 years and over
Males 39.0% Never married51.3% Now married1.7% Separated1.0% Widowed7.0% DivorcedFemales 51.6% Never married33.4% Now married2.3% Separated2.9% Widowed9.8% DivorcedWomen who gave birth in the past 12 months Now married:
0.0% (0)Unmarried:
100.0% (20)
Women who did not give birth in the past 12 months Now married:
35.7% (514)Unmarried:
64.3% (924)
Marital status - Two or more races population 15 years and over
Males 56.2% Never married26.7% Now married9.0% Separated1.5% Widowed6.5% DivorcedFemales 54.4% Never married39.8% Now married3.4% Separated0.0% Widowed2.4% DivorcedWomen who did not give birth in the past 12 months Now married:
32.8% (330)Unmarried:
67.2% (674)
Marital status - White alone, not Hispanic / Latino population 15 years and over
Males 52.1% Never married25.6% Now married1.3% Separated4.2% Widowed16.9% DivorcedFemales 41.0% Never married24.7% Now married5.0% Separated10.3% Widowed19.1% DivorcedWomen who did not give birth in the past 12 months Now married:
32.9% (208)Unmarried:
67.1% (424)
Marital status - Hispanic or Latino population 15 years and over
Males 46.5% Never married44.6% Now married2.8% Separated1.7% Widowed4.3% DivorcedFemales 44.5% Never married38.1% Now married3.2% Separated3.0% Widowed11.2% DivorcedWomen who gave birth in the past 12 months Now married:
72.2% (111)Unmarried:
27.8% (43)
Women who did not give birth in the past 12 months Now married:
37.9% (1,177)Unmarried:
62.1% (1,928)
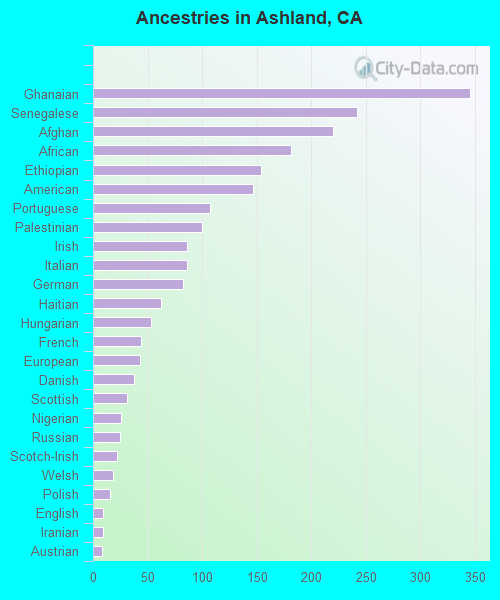
Ancestries in Ashland
296 1.8% American260 1.6% Palestinian152 0.9% African145 0.9% European128 0.8% English115 0.7% Portuguese79 0.5% Italian68 0.4% Irish54 0.3% Brazilian46 0.3% Egyptian46 0.3% French42 0.3% German27 0.2% Hungarian26 0.2% Norwegian22 0.1% Canadian21 0.1% Moroccan19 0.1% Greek19 0.1% Scottish17 0.1% Polish17 0.1% Russian16 0.10% Jamaican14 0.09% Northern European11 0.07% Ukrainian10 0.06% Czech10 0.06% Scotch-Irish7 0.04% Arab6 0.04% Welsh4 0.02% Swiss1 0.01% Iranian
Geographical mobility in Ashland Same house 1 year ago 6,713 93.2% White (Caucasian)3,353 100.0% Black or African American459 99.0% American Indian / Alaska Native5,660 87.6% Asian127 96.1% Native Hawaiian / Pacific Islander4,795 98.1% Other race3,799 100.0% Two or more races2,549 96.7% White alone, not Hispanic / Latino10,545 94.4% Hispanic or LatinoMoved within same county 316 4.4% White / Caucasian57 1.7% Black or African American14 3.1% American Indian / Alaska Native515 8.0% Asian5 3.5% Native Hawaiian / Pacific Islander56 1.1% Other race100 2.7% Two or more races77 2.9% White alone, not Hispanic / Latino388 3.5% Hispanic or LatinoMoved within same state 53 0.7% White / Caucasian250 3.9% Asian34 1.3% White alone, not Hispanic / Latino28 0.3% Hispanic or LatinoMoved from different state 16 0.2% AsianMoved from abroad 123 1.7% White52 0.8% Asian88 1.8% Other race267 2.4% Hispanic or Latino
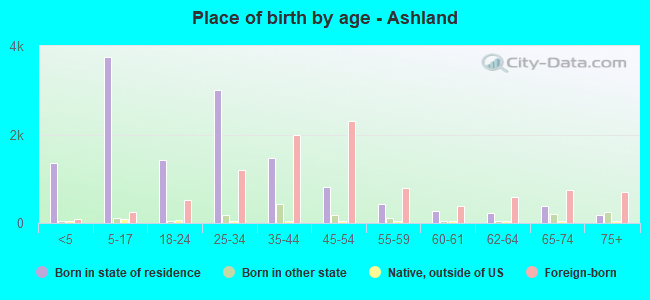
Children Nativity (place of birth) in Ashland
Children under 6 years - Living with two parents Both parents native 341 100.0% NativeBoth parents foreign-born 373 86.9% Native56 13.1% Foreign-bornOne native, one foreign-born parent 258 100.0% NativeChildren under 6 years - Living with one parent Native parent 518 100.0% Native0 0.0% Foreign-bornForeign-born parent 213 77.9% Native60 22.1% Foreign-bornChildren 6 to 17 years - Living with two parents Both parents native 515 99.9% Native1 0.1% Foreign-bornBoth parents foreign-born 842 88.3% Native111 11.7% Foreign-bornOne native, one foreign-born parent 442 100.0% NativeChildren 6 to 17 years - Living with one parent Native parent 878 100.0% NativeForeign-born parent 803 53.8% Native691 46.2% Foreign-born
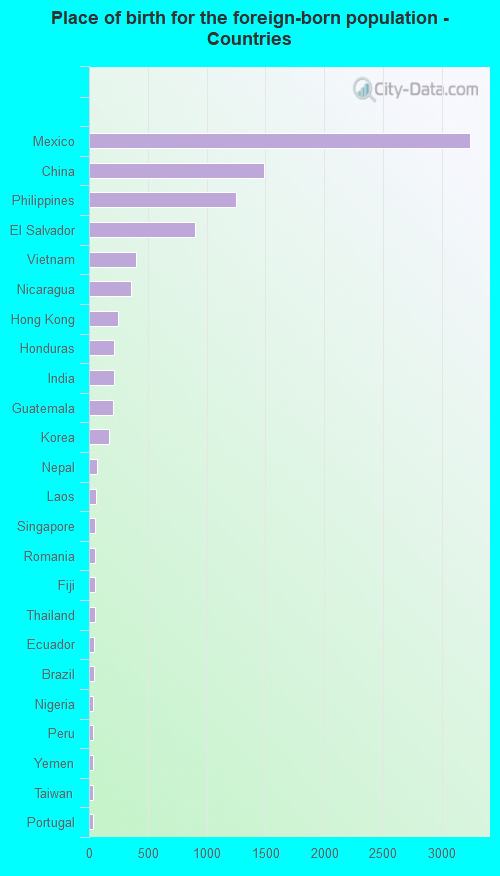
Place of birth for residents in Ashland 5,156 Americas5,130 Latin America4,925 Central America4,251 Asia1,934 Eastern Asia1,833 South Eastern Asia1,763 China299 South Central Asia196 Africa175 Europe160 South America144 Northern Africa116 Eastern Europe65 Western Asia63 Oceania44 Caribbean37 Western Africa30 Southern Europe26 Northern America20 Northern Europe14 Eastern Africa8 Western Europe3,241 Mexico1,488 China1,252 Philippines905 El Salvador397 Vietnam355 Nicaragua243 Hong Kong212 Honduras211 India202 Guatemala171 Korea71 Nepal57 Laos51 Singapore50 Romania50 Fiji48 Thailand44 Ecuador44 Brazil37 Nigeria35 Peru33 Yemen31 Taiwan30 Portugal29 Czechoslovakia26 Canada25 Burma25 Cuba22 Russia20 England19 Dominica19 Colombia18 Egypt18 Saudi Arabia16 Pakistan16 Guyana14 Zimbabwe14 Morocco14 Ukraine14 Syria8 Belize5 Switzerland3 Germany
Grandparents responsible for own grandchildren in Ashland
Grandparents (30 to 59 years) White / Caucasian 7 12.5% Responsible for grandchildren51 87.5% Not responsible for grandchildrenBlack or African American 16 100.0% Not responsible for grandchildrenAmerican Indian / Alaska Native 58 100.0% Not responsible for grandchildrenAsian 17 31.2% Responsible for grandchildren37 68.8% Not responsible for grandchildrenOther race 44 46.5% Responsible for grandchildren51 53.5% Not responsible for grandchildrenWhite alone, not Hispanic / Latino 6 100.0% Responsible for grandchildrenHispanic or Latino 35 20.0% Responsible for grandchildren138 80.0% Not responsible for grandchildrenGrandparents (60 years and over) White / Caucasian 111 100.0% Not responsible for grandchildrenBlack or African American 38 100.0% Not responsible for grandchildrenAsian 31 17.8% Responsible for grandchildren142 82.2% Not responsible for grandchildrenOther race 45 37.7% Responsible for grandchildren75 62.3% Not responsible for grandchildrenWhite alone, not Hispanic / Latino 101 100.0% Not responsible for grandchildrenHispanic or Latino 34 18.7% Responsible for grandchildren146 81.3% Not responsible for grandchildren