Races in Avilla Beach, California (CA) Detailed Stats
Ancestries, Foreign-born residents, place of birth
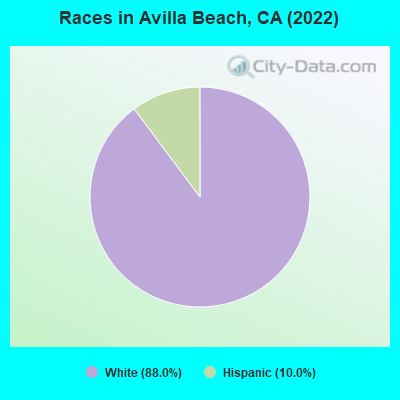
According to 2022 data, the most numerous races in Avilla Beach, CA are Hispanic (60 residents), White alone (1,111 residents), and Asian alone (64 residents). 91.5% of Avilla Beach residents speak English at home.
Race distribution in Avilla Beach

- 1,11184.1%White alone
- 644.8%Asian alone
- 604.5%Hispanic
2000
2022
-
- 15,816,79046.7%White alone
- 10,966,55632.4%Hispanic
- 3,648,86010.8%Asian alone
- 2,181,9266.4%Black alone
- 903,1152.7%Two or more races
- 178,9840.5%American Indian alone
- 103,7360.3%Native Hawaiian and Other
Pacific Islander alone - 71,6810.2%Other race alone

-
- 15,732,18440.3%Hispanic
- 13,160,42633.7%White alone
- 5,957,86715.3%Asian alone
- 2,025,2185.2%Black alone
- 1,663,2224.3%Two or more races
- 251,6180.6%Other race alone
- 135,7770.3%Native Hawaiian and Other
Pacific Islander alone - 103,0300.3%American Indian alone

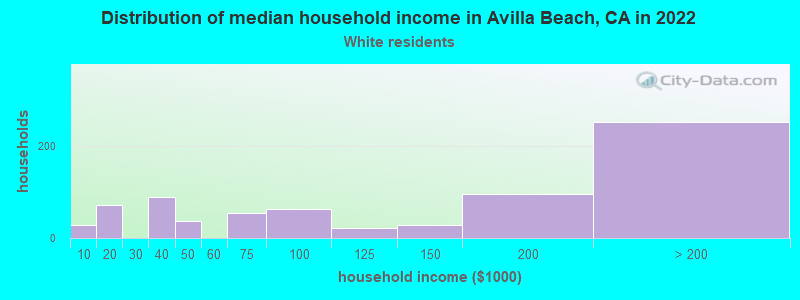
Income and house value in Avilla Beach
- Median household income in 2022
- $97,126White non-Hispanic householders
- Median 2022 house value
Household income for White non-Hispanic householders
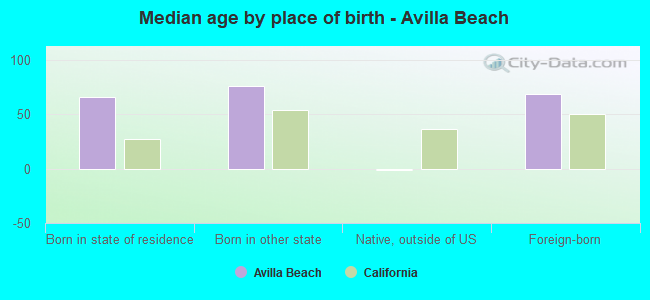
Median age by race in Avilla Beach
- 67.4Median age for White residents
- 61.1Males
- 72.5Females
- 84.4Median age for Asian residents
- 16.0Males
- 109.1Females
- 74.7Median age for Two or more races residents
- 64.6Median age for White alone residents
- 59.0Males
- 70.6Females
- 8.1Median age for Hispanic or Latino residents
Owner/renter occupied households by race in Avilla Beach
- House owners and renters - White residents
- 45771.1%Owner occupied
- 18628.9%Renter occupied
- House owners and renters - White alone residents
- 49270.1%Owner occupied
- 21029.9%Renter occupied
Language usage in Avilla Beach
- English speakers - Total
- 91.5% of residents of Avilla Beach speak English at home.
- 0.7% of residents speak Spanish at home
- 9100.0%Speak English very well
- 8.5% of residents speak other language at home
- 110100.0%Speak English very well
- English speakers - Born in the United States
- 91.6% of residents of Avilla Beach speak English at home.
- 2.9% of residents speak Spanish at home
- 8100.0%Speak English very well
- 5.1% of residents speak other language at home
- 14100.0%Speak English very well
- English speakers - Foreign-born
- 49.7% of residents of Avilla Beach speak English at home.
- 56.9% of residents speak other language at home
- 95100.0%Speak English very well
White (Caucasian) - Speak only English
| Native: | 100.0% (923) |
| Foreign-born: | 92.3% (59) |
White (Caucasian) - Speak another language
| Native: | 1.8% (16) |
| Foreign-born: | 28.8% (18) |
White alone - Speak only English
| Native: | 96.8% (969) |
| Foreign-born: | 57.8% (64) |
White alone - Speak another language
| Native: | 2.9% (29) |
| Foreign-born: | 35.8% (39) |
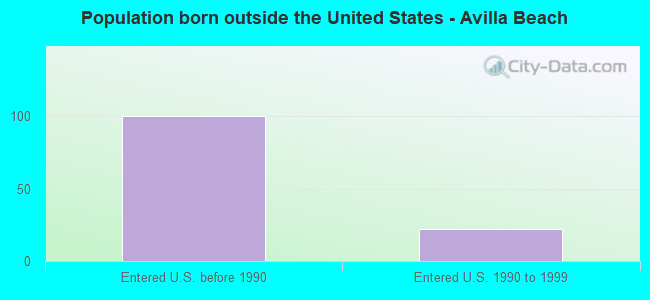
Foreign-born residents in Avilla Beach
Marital status for residents in Avilla Beach
Marital status - White (Caucasian) population 15 years and over
- Males
- 34.1%Never married
- 50.0%Now married
- 0.0%Separated
- 0.0%Widowed
- 15.9%Divorced
- Females
- 1.9%Never married
- 54.9%Now married
- 0.0%Separated
- 24.0%Widowed
- 19.2%Divorced
Women who did not give birth in the past 12 months
| Now married: | 91.2% (82) |
| Unmarried: | 8.8% (8) |
Marital status - Other race population 15 years and over
- Males
- 0.0%Never married
- 100.0%Now married
- 0.0%Separated
- 0.0%Widowed
- 0.0%Divorced
- Females
- 0.0%Never married
- 0.0%Now married
- 0.0%Separated
- 100.0%Widowed
- 0.0%Divorced
Marital status - White alone, not Hispanic / Latino population 15 years and over
- Males
- 34.1%Never married
- 50.0%Now married
- 0.0%Separated
- 0.0%Widowed
- 15.9%Divorced
- Females
- 1.9%Never married
- 54.9%Now married
- 0.0%Separated
- 24.0%Widowed
- 19.2%Divorced
Women who did not give birth in the past 12 months
| Now married: | 91.2% (94) |
| Unmarried: | 8.8% (9) |
Marital status - Hispanic or Latino population 15 years and over
- Males
- 0.0%Never married
- 100.0%Now married
- 0.0%Separated
- 0.0%Widowed
- 0.0%Divorced
- Females
- 0.0%Never married
- 0.0%Now married
- 0.0%Separated
- 100.0%Widowed
- 0.0%Divorced
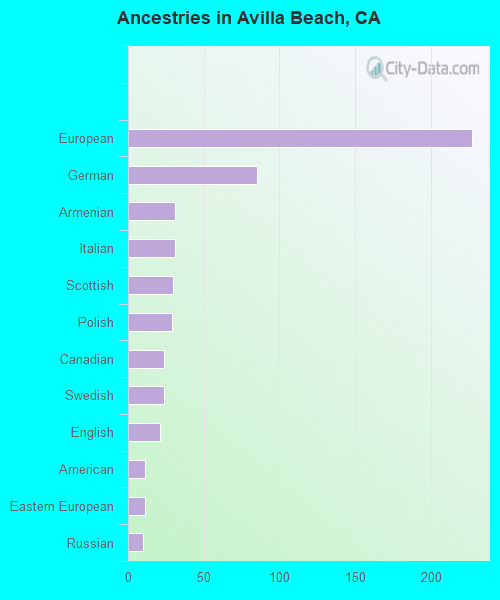
Ancestries in Avilla Beach

- 22730.7%European
- 8511.5%German
- 314.2%Armenian
- 314.2%Italian
- 304.1%Scottish
- 293.9%Polish
- 243.2%Canadian
- 243.2%Swedish
- 212.8%English
- 111.5%American
- 111.5%Eastern European
- 101.4%Russian
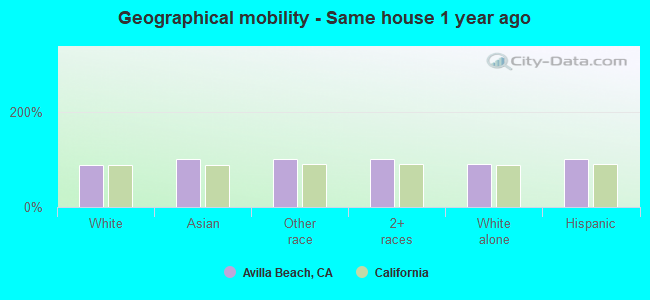
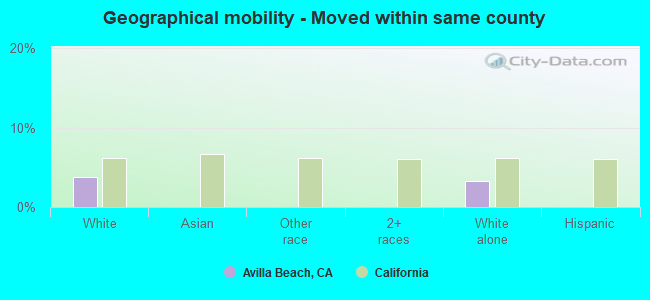
Geographical mobility in Avilla Beach

- Same house 1 year ago
- 84687.4%White (Caucasian)
- 66100.0%Asian
- 33100.0%Other race
- 89100.0%Two or more races
- 1,01689.7%White alone, not Hispanic / Latino
- 60100.0%Hispanic or Latino
-
- Moved within same county
- 373.8%White / Caucasian
- 373.3%White alone, not Hispanic / Latino
-
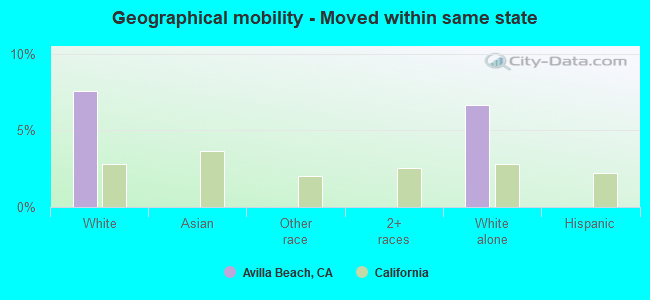
- Moved within same state
- 737.6%White / Caucasian
- 766.7%White alone, not Hispanic / Latino
-
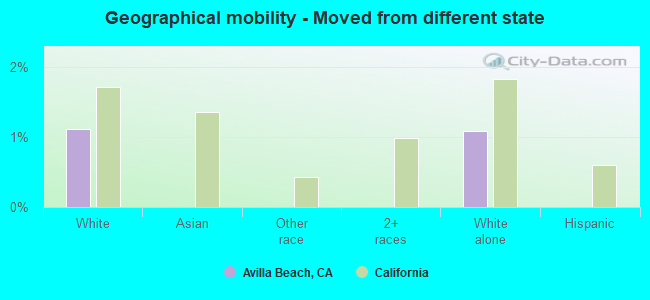
- Moved from different state
- 111.1%White / Caucasian
- 121.1%White alone, not Hispanic / Latino
Children Nativity (place of birth) in Avilla Beach
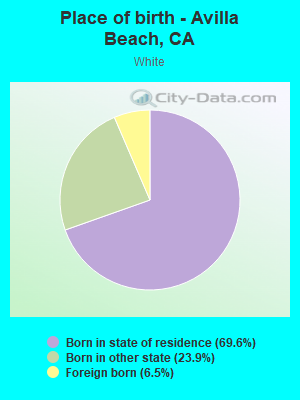
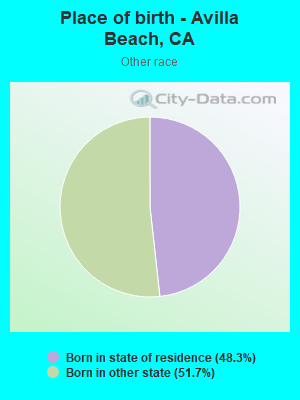
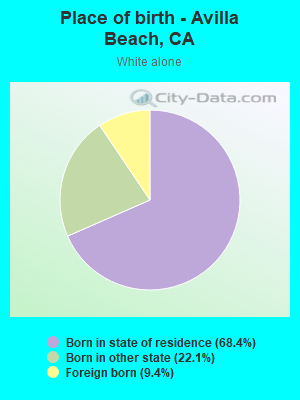
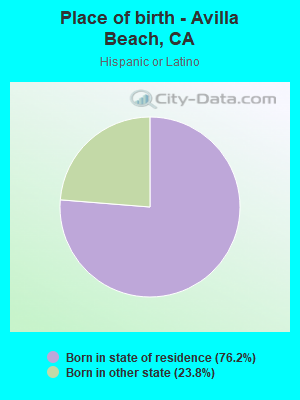
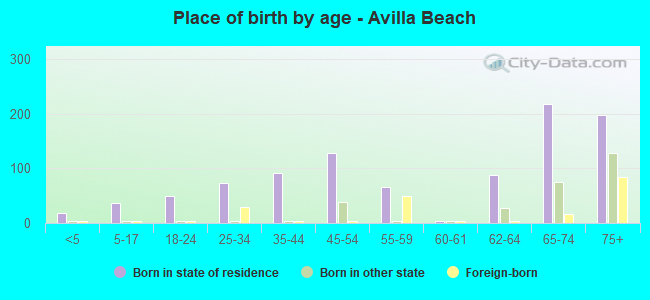
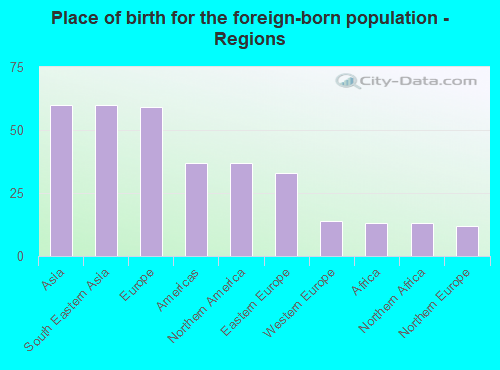
Place of birth for residents in Avilla Beach
![Place of birth for the foreign-born population - Regions]()
- 60Asia
- 60South Eastern Asia
- 59Europe
- 37Americas
- 37Northern America
- 33Eastern Europe
- 14Western Europe
- 13Africa
- 13Northern Africa
- 12Northern Europe
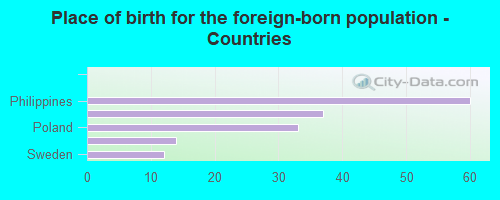
![Place of birth for the foreign-born population - Countries]()
- 60Philippines
- 37Canada
- 33Poland
- 14Germany
- 12Sweden