Races in Barre, New York (NY) Detailed Stats
Ancestries, Foreign-born residents, place of birth
0.6% of Barre, NY residents are foreign-born , which is 3794.0% less than the foreign-born rate of 22.0% across the entire state of New York.
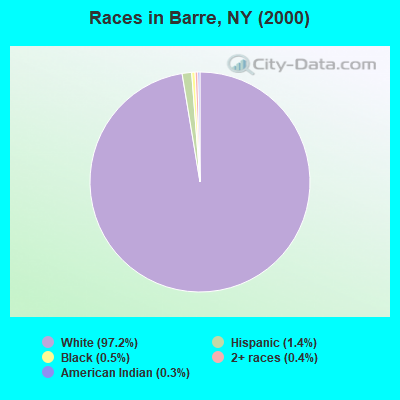
Race distribution in Barre

- 2,06597.2%White alone
- 291.4%Hispanic
- 110.5%Black alone
- 90.4%Two or more races
- 60.3%American Indian alone
- 20.09%Asian alone
- 20.09%Native Hawaiian and Other
Pacific Islander alone
2000
2022
-
- 11,760,98162.0%White alone
- 2,867,58315.1%Hispanic
- 2,812,62314.8%Black alone
- 1,035,9265.5%Asian alone
- 366,1161.9%Two or more races
- 75,4990.4%Other race alone
- 52,4990.3%American Indian alone
- 5,2300.03%Native Hawaiian and Other
Pacific Islander alone

-
- 10,408,93352.9%White alone
- 3,867,29919.7%Hispanic
- 2,633,84013.4%Black alone
- 1,776,2869.0%Asian alone
- 732,6703.7%Two or more races
- 216,1101.1%Other race alone
- 35,0820.2%American Indian alone
- 6,9310.04%Native Hawaiian and Other
Pacific Islander alone

Income and house value in Barre
- Median household income in 2022
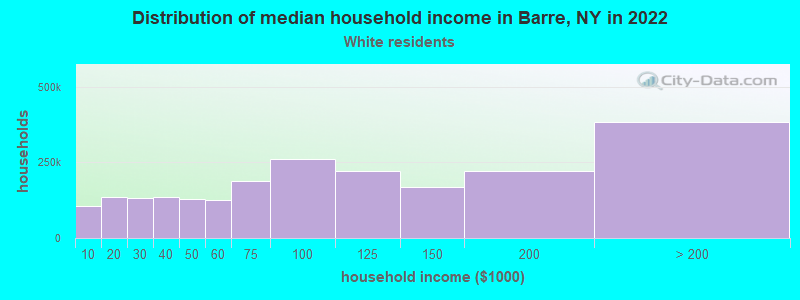
- $81,099White non-Hispanic householders
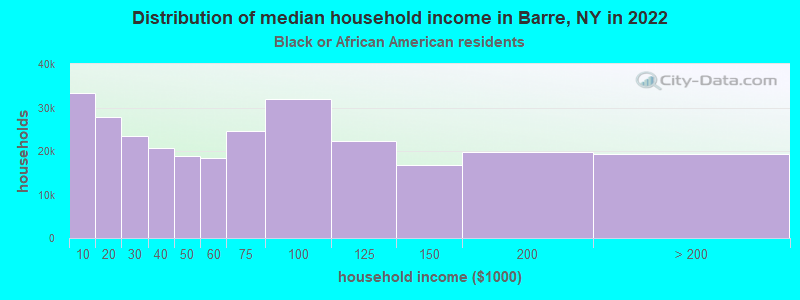
- $35,142Black householders
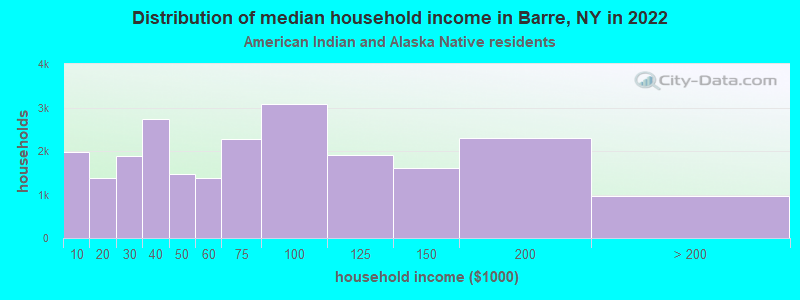
- $54,351American Indian and Alaska Native householders
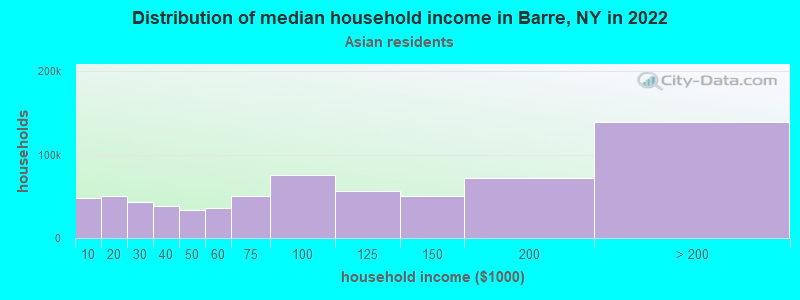
- $160,142Asian householders
- $71,555Some other race householders
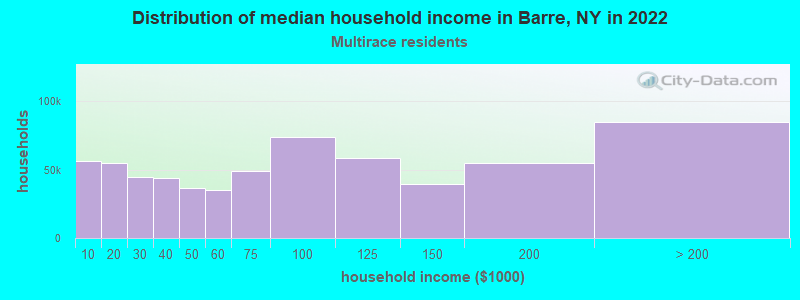
- $133,049Two or more races householders
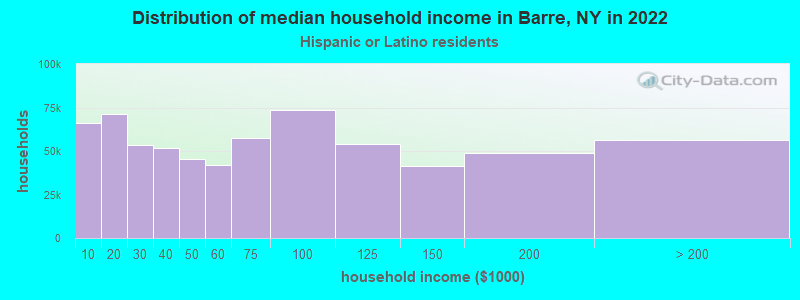
- $61,990Hispanic or Latino race householders
- Median 2022 house value
- $130,435White Non-Hispanic householders
- $67,281Black or African American householders
- $170,445Two or more races householders
Household income for White non-Hispanic householders
Household income for Black householders
Household income for American Indian and Alaska Native householders
Household income for Asian householders
Household income for Two or more races householders
Household income for Hispanic or Latino race householders
Foreign-born residents in Barre
12 residents are foreign born
| This city: | 0.6% |
| New York: | 20.4% |
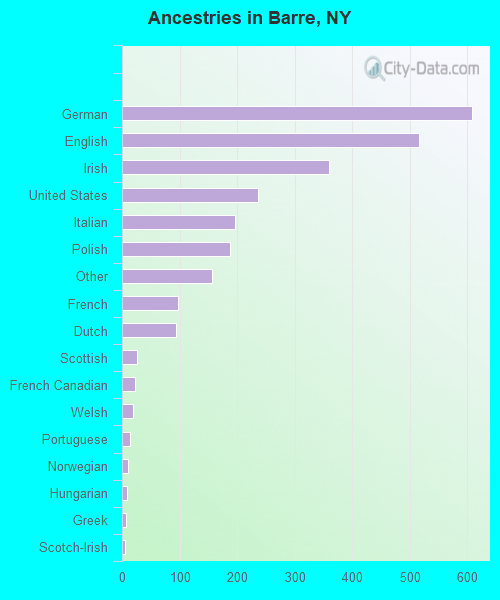
Ancestries in Barre

- 60723.5%German
- 51520.0%English
- 35913.9%Irish
- 2379.2%United States
- 1967.6%Italian
- 1887.3%Polish
- 1566.0%Other
- 983.8%French
- 933.6%Dutch
- 261.0%Scottish
- 230.9%French Canadian
- 190.7%Welsh
- 140.5%Portuguese
- 100.4%Norwegian
- 90.3%Hungarian
- 70.3%Greek
- 60.2%Scotch-Irish
- 50.2%Danish
- 30.1%Czech
- 30.1%Swedish
- 20.08%Russian
- 20.08%Subsaharan African
- 20.08%Swiss
Zip codes: 14411.