Estimated zip code population in 2022: 12,407
Zip code population in 2010: 14,491
Zip code population in 2000: 14,676
Houses and condos: 5,755
Renter-occupied apartments: 1,465
% of renters here:
29%State:
46%
March 2022 cost of living index in zip code 14411: 101.1
(near average, U.S. average is 100)
Land area: 113.3
sq. mi.
Water area: 0.3
sq. mi.
Population density: 110 people per square mile (very low).
OSM Map
General Map
Google Map
MSN Map
OSM Map
General Map
Google Map
MSN Map
OSM Map
General Map
Google Map
MSN Map
OSM Map
General Map
Google Map
MSN Map
Please wait while loading the map...
Real estate property taxes paid for housing units in 2022:
This zip code:
2.9% ($3,040)New York:
1.5% ($6,180)
Median real estate property taxes paid for housing units with mortgages in 2022: $3,787 (3.1%)
Median real estate property taxes paid for housing units with no mortgage in 2022: $2,533 (3.1%)
Profiles of local businesses
Business Search - 14 Million verified businesses
Males: 6,154 Females: 6,253
For population 25 years and over in 14411:
High school or higher: 82.3%Bachelor's degree or higher: 11.1%Graduate or professional degree: 4.9%Unemployed: 8.5%Mean travel time to work (commute): 24.0 minutes
For population 15 years and over in 14411:
Never married: 36.6%Now married: 40.2%Separated: 3.4%Widowed: 5.4%Divorced: 14.4%
Zip code 14411 compared to state average:
Median household income below state average. Median house value significantly below state average. Hispanic race population percentage significantly below state average. Median age above state average. Foreign-born population percentage significantly below state average. Renting percentage below state average. Length of stay since moving in significantly above state average. Number of rooms per house above state average. Number of college students below state average. Percentage of population with a bachelor's degree or higher significantly below state average. 10,207 82.3% White 1,339 10.8% Black 494 4.0% Hispanic or Latino 282 2.3% Two or more races 56 0.5% Asian 25 0.2% Some other race 2 0.02% American Indian
Data:
Median household income ($)
Median household income (% change since 2000)
Household income diversity
Ratio of average income to average house value (%)
Ratio of average income to average rent
Median household income ($) - White
Median household income ($) - Black or African American
Median household income ($) - Asian
Median household income ($) - Hispanic or Latino
Median household income ($) - American Indian and Alaska Native
Median household income ($) - Multirace
Median household income ($) - Other Race
Median household income for houses/condos with a mortgage ($)
Median household income for apartments without a mortgage ($)
Races - White alone (%)
Races - White alone (% change since 2000)
Races - Black alone (%)
Races - Black alone (% change since 2000)
Races - American Indian alone (%)
Races - American Indian alone (% change since 2000)
Races - Asian alone (%)
Races - Asian alone (% change since 2000)
Races - Hispanic (%)
Races - Hispanic (% change since 2000)
Races - Native Hawaiian and Other Pacific Islander alone (%)
Races - Native Hawaiian and Other Pacific Islander alone (% change since 2000)
Races - Two or more races (%)
Races - Two or more races (% change since 2000)
Races - Other race alone (%)
Races - Other race alone (% change since 2000)
Racial diversity
Unemployment (%)
Unemployment (% change since 2000)
Unemployment (%) - White
Unemployment (%) - Black or African American
Unemployment (%) - Asian
Unemployment (%) - Hispanic or Latino
Unemployment (%) - American Indian and Alaska Native
Unemployment (%) - Multirace
Unemployment (%) - Other Race
Population density (people per square mile)
Population - Males (%)
Population - Females (%)
Population - Males (%) - White
Population - Males (%) - Black or African American
Population - Males (%) - Asian
Population - Males (%) - Hispanic or Latino
Population - Males (%) - American Indian and Alaska Native
Population - Males (%) - Multirace
Population - Males (%) - Other Race
Population - Females (%) - White
Population - Females (%) - Black or African American
Population - Females (%) - Asian
Population - Females (%) - Hispanic or Latino
Population - Females (%) - American Indian and Alaska Native
Population - Females (%) - Multirace
Population - Females (%) - Other Race
Coronavirus confirmed cases (Apr 27, 2024)
Deaths caused by coronavirus (Apr 27, 2024)
Coronavirus confirmed cases (per 100k population) (Apr 27, 2024)
Deaths caused by coronavirus (per 100k population) (Apr 27, 2024)
Daily increase in number of cases (Apr 27, 2024)
Weekly increase in number of cases (Apr 27, 2024)
Cases doubled (in days) (Apr 27, 2024)
Hospitalized patients (Apr 18, 2022)
Negative test results (Apr 18, 2022)
Total test results (Apr 18, 2022)
COVID Vaccine doses distributed (per 100k population) (Sep 19, 2023)
COVID Vaccine doses administered (per 100k population) (Sep 19, 2023)
COVID Vaccine doses distributed (Sep 19, 2023)
COVID Vaccine doses administered (Sep 19, 2023)
Likely homosexual households (%)
Likely homosexual households (% change since 2000)
Likely homosexual households - Lesbian couples (%)
Likely homosexual households - Lesbian couples (% change since 2000)
Likely homosexual households - Gay men (%)
Likely homosexual households - Gay men (% change since 2000)
Cost of living index
Median gross rent ($)
Median contract rent ($)
Median monthly housing costs ($)
Median house or condo value ($)
Median house or condo value ($ change since 2000)
Mean house or condo value by units in structure - 1, detached ($)
Mean house or condo value by units in structure - 1, attached ($)
Mean house or condo value by units in structure - 2 ($)
Mean house or condo value by units in structure by units in structure - 3 or 4 ($)
Mean house or condo value by units in structure - 5 or more ($)
Mean house or condo value by units in structure - Boat, RV, van, etc. ($)
Mean house or condo value by units in structure - Mobile home ($)
Median house or condo value ($) - White
Median house or condo value ($) - Black or African American
Median house or condo value ($) - Asian
Median house or condo value ($) - Hispanic or Latino
Median house or condo value ($) - American Indian and Alaska Native
Median house or condo value ($) - Multirace
Median house or condo value ($) - Other Race
Median resident age
Resident age diversity
Median resident age - Males
Median resident age - Females
Median resident age - White
Median resident age - Black or African American
Median resident age - Asian
Median resident age - Hispanic or Latino
Median resident age - American Indian and Alaska Native
Median resident age - Multirace
Median resident age - Other Race
Median resident age - Males - White
Median resident age - Males - Black or African American
Median resident age - Males - Asian
Median resident age - Males - Hispanic or Latino
Median resident age - Males - American Indian and Alaska Native
Median resident age - Males - Multirace
Median resident age - Males - Other Race
Median resident age - Females - White
Median resident age - Females - Black or African American
Median resident age - Females - Asian
Median resident age - Females - Hispanic or Latino
Median resident age - Females - American Indian and Alaska Native
Median resident age - Females - Multirace
Median resident age - Females - Other Race
Commute - mean travel time to work (minutes)
Travel time to work - Less than 5 minutes (%)
Travel time to work - Less than 5 minutes (% change since 2000)
Travel time to work - 5 to 9 minutes (%)
Travel time to work - 5 to 9 minutes (% change since 2000)
Travel time to work - 10 to 19 minutes (%)
Travel time to work - 10 to 19 minutes (% change since 2000)
Travel time to work - 20 to 29 minutes (%)
Travel time to work - 20 to 29 minutes (% change since 2000)
Travel time to work - 30 to 39 minutes (%)
Travel time to work - 30 to 39 minutes (% change since 2000)
Travel time to work - 40 to 59 minutes (%)
Travel time to work - 40 to 59 minutes (% change since 2000)
Travel time to work - 60 to 89 minutes (%)
Travel time to work - 60 to 89 minutes (% change since 2000)
Travel time to work - 90 or more minutes (%)
Travel time to work - 90 or more minutes (% change since 2000)
Marital status - Never married (%)
Marital status - Now married (%)
Marital status - Separated (%)
Marital status - Widowed (%)
Marital status - Divorced (%)
Median family income ($)
Median family income (% change since 2000)
Median non-family income ($)
Median non-family income (% change since 2000)
Median per capita income ($)
Median per capita income (% change since 2000)
Median family income ($) - White
Median family income ($) - Black or African American
Median family income ($) - Asian
Median family income ($) - Hispanic or Latino
Median family income ($) - American Indian and Alaska Native
Median family income ($) - Multirace
Median family income ($) - Other Race
Median year house/condo built
Median year apartment built
Year house built - Built 2005 or later (%)
Year house built - Built 2000 to 2004 (%)
Year house built - Built 1990 to 1999 (%)
Year house built - Built 1980 to 1989 (%)
Year house built - Built 1970 to 1979 (%)
Year house built - Built 1960 to 1969 (%)
Year house built - Built 1950 to 1959 (%)
Year house built - Built 1940 to 1949 (%)
Year house built - Built 1939 or earlier (%)
Average household size
Household density (households per square mile)
Average household size - White
Average household size - Black or African American
Average household size - Asian
Average household size - Hispanic or Latino
Average household size - American Indian and Alaska Native
Average household size - Multirace
Average household size - Other Race
Occupied housing units (%)
Vacant housing units (%)
Owner occupied housing units (%)
Renter occupied housing units (%)
Vacancy status - For rent (%)
Vacancy status - For sale only (%)
Vacancy status - Rented or sold, not occupied (%)
Vacancy status - For seasonal, recreational, or occasional use (%)
Vacancy status - For migrant workers (%)
Vacancy status - Other vacant (%)
Residents with income below the poverty level (%)
Residents with income below 50% of the poverty level (%)
Children below poverty level (%)
Poor families by family type - Married-couple family (%)
Poor families by family type - Male, no wife present (%)
Poor families by family type - Female, no husband present (%)
Poverty status for native-born residents (%)
Poverty status for foreign-born residents (%)
Poverty among high school graduates not in families (%)
Poverty among people who did not graduate high school not in families (%)
Residents with income below the poverty level (%) - White
Residents with income below the poverty level (%) - Black or African American
Residents with income below the poverty level (%) - Asian
Residents with income below the poverty level (%) - Hispanic or Latino
Residents with income below the poverty level (%) - American Indian and Alaska Native
Residents with income below the poverty level (%) - Multirace
Residents with income below the poverty level (%) - Other Race
Air pollution - Air Quality Index (AQI)
Air pollution - CO
Air pollution - NO2
Air pollution - SO2
Air pollution - Ozone
Air pollution - PM10
Air pollution - PM25
Air pollution - Pb
Crime - Murders per 100,000 population
Crime - Rapes per 100,000 population
Crime - Robberies per 100,000 population
Crime - Assaults per 100,000 population
Crime - Burglaries per 100,000 population
Crime - Thefts per 100,000 population
Crime - Auto thefts per 100,000 population
Crime - Arson per 100,000 population
Crime - City-data.com crime index
Crime - Violent crime index
Crime - Property crime index
Crime - Murders per 100,000 population (5 year average)
Crime - Rapes per 100,000 population (5 year average)
Crime - Robberies per 100,000 population (5 year average)
Crime - Assaults per 100,000 population (5 year average)
Crime - Burglaries per 100,000 population (5 year average)
Crime - Thefts per 100,000 population (5 year average)
Crime - Auto thefts per 100,000 population (5 year average)
Crime - Arson per 100,000 population (5 year average)
Crime - City-data.com crime index (5 year average)
Crime - Violent crime index (5 year average)
Crime - Property crime index (5 year average)
1996 Presidential Elections Results (%) - Democratic Party (Clinton)
1996 Presidential Elections Results (%) - Republican Party (Dole)
1996 Presidential Elections Results (%) - Other
2000 Presidential Elections Results (%) - Democratic Party (Gore)
2000 Presidential Elections Results (%) - Republican Party (Bush)
2000 Presidential Elections Results (%) - Other
2004 Presidential Elections Results (%) - Democratic Party (Kerry)
2004 Presidential Elections Results (%) - Republican Party (Bush)
2004 Presidential Elections Results (%) - Other
2008 Presidential Elections Results (%) - Democratic Party (Obama)
2008 Presidential Elections Results (%) - Republican Party (McCain)
2008 Presidential Elections Results (%) - Other
2012 Presidential Elections Results (%) - Democratic Party (Obama)
2012 Presidential Elections Results (%) - Republican Party (Romney)
2012 Presidential Elections Results (%) - Other
2016 Presidential Elections Results (%) - Democratic Party (Clinton)
2016 Presidential Elections Results (%) - Republican Party (Trump)
2016 Presidential Elections Results (%) - Other
2020 Presidential Elections Results (%) - Democratic Party (Biden)
2020 Presidential Elections Results (%) - Republican Party (Trump)
2020 Presidential Elections Results (%) - Other
Ancestries Reported - Arab (%)
Ancestries Reported - Czech (%)
Ancestries Reported - Danish (%)
Ancestries Reported - Dutch (%)
Ancestries Reported - English (%)
Ancestries Reported - French (%)
Ancestries Reported - French Canadian (%)
Ancestries Reported - German (%)
Ancestries Reported - Greek (%)
Ancestries Reported - Hungarian (%)
Ancestries Reported - Irish (%)
Ancestries Reported - Italian (%)
Ancestries Reported - Lithuanian (%)
Ancestries Reported - Norwegian (%)
Ancestries Reported - Polish (%)
Ancestries Reported - Portuguese (%)
Ancestries Reported - Russian (%)
Ancestries Reported - Scotch-Irish (%)
Ancestries Reported - Scottish (%)
Ancestries Reported - Slovak (%)
Ancestries Reported - Subsaharan African (%)
Ancestries Reported - Swedish (%)
Ancestries Reported - Swiss (%)
Ancestries Reported - Ukrainian (%)
Ancestries Reported - United States (%)
Ancestries Reported - Welsh (%)
Ancestries Reported - West Indian (%)
Ancestries Reported - Other (%)
Educational Attainment - No schooling completed (%)
Educational Attainment - Less than high school (%)
Educational Attainment - High school or equivalent (%)
Educational Attainment - Less than 1 year of college (%)
Educational Attainment - 1 or more years of college (%)
Educational Attainment - Associate degree (%)
Educational Attainment - Bachelor's degree (%)
Educational Attainment - Master's degree (%)
Educational Attainment - Professional school degree (%)
Educational Attainment - Doctorate degree (%)
School Enrollment - Nursery, preschool (%)
School Enrollment - Kindergarten (%)
School Enrollment - Grade 1 to 4 (%)
School Enrollment - Grade 5 to 8 (%)
School Enrollment - Grade 9 to 12 (%)
School Enrollment - College undergrad (%)
School Enrollment - Graduate or professional (%)
School Enrollment - Not enrolled in school (%)
School enrollment - Public schools (%)
School enrollment - Private schools (%)
School enrollment - Not enrolled (%)
Median number of rooms in houses and condos
Median number of rooms in apartments
Housing units lacking complete plumbing facilities (%)
Housing units lacking complete kitchen facilities (%)
Density of houses
Urban houses (%)
Rural houses (%)
Households with people 60 years and over (%)
Households with people 65 years and over (%)
Households with people 75 years and over (%)
Households with one or more nonrelatives (%)
Households with no nonrelatives (%)
Population in households (%)
Family households (%)
Nonfamily households (%)
Population in families (%)
Family households with own children (%)
Median number of bedrooms in owner occupied houses
Mean number of bedrooms in owner occupied houses
Median number of bedrooms in renter occupied houses
Mean number of bedrooms in renter occupied houses
Median number of vehichles in owner occupied houses
Mean number of vehichles in owner occupied houses
Median number of vehichles in renter occupied houses
Mean number of vehichles in renter occupied houses
Mortgage status - with mortgage (%)
Mortgage status - with second mortgage (%)
Mortgage status - with home equity loan (%)
Mortgage status - with both second mortgage and home equity loan (%)
Mortgage status - without a mortgage (%)
Average family size
Average family size - White
Average family size - Black or African American
Average family size - Asian
Average family size - Hispanic or Latino
Average family size - American Indian and Alaska Native
Average family size - Multirace
Average family size - Other Race
Geographical mobility - Same house 1 year ago (%)
Geographical mobility - Moved within same county (%)
Geographical mobility - Moved from different county within same state (%)
Geographical mobility - Moved from different state (%)
Geographical mobility - Moved from abroad (%)
Place of birth - Born in state of residence (%)
Place of birth - Born in other state (%)
Place of birth - Native, outside of US (%)
Place of birth - Foreign born (%)
Housing units in structures - 1, detached (%)
Housing units in structures - 1, attached (%)
Housing units in structures - 2 (%)
Housing units in structures - 3 or 4 (%)
Housing units in structures - 5 to 9 (%)
Housing units in structures - 10 to 19 (%)
Housing units in structures - 20 to 49 (%)
Housing units in structures - 50 or more (%)
Housing units in structures - Mobile home (%)
Housing units in structures - Boat, RV, van, etc. (%)
House/condo owner moved in on average (years ago)
Renter moved in on average (years ago)
Year householder moved into unit - Moved in 1999 to March 2000 (%)
Year householder moved into unit - Moved in 1995 to 1998 (%)
Year householder moved into unit - Moved in 1990 to 1994 (%)
Year householder moved into unit - Moved in 1980 to 1989 (%)
Year householder moved into unit - Moved in 1970 to 1979 (%)
Year householder moved into unit - Moved in 1969 or earlier (%)
Means of transportation to work - Drove car alone (%)
Means of transportation to work - Carpooled (%)
Means of transportation to work - Public transportation (%)
Means of transportation to work - Bus or trolley bus (%)
Means of transportation to work - Streetcar or trolley car (%)
Means of transportation to work - Subway or elevated (%)
Means of transportation to work - Railroad (%)
Means of transportation to work - Ferryboat (%)
Means of transportation to work - Taxicab (%)
Means of transportation to work - Motorcycle (%)
Means of transportation to work - Bicycle (%)
Means of transportation to work - Walked (%)
Means of transportation to work - Other means (%)
Working at home (%)
Industry diversity
Most Common Industries - Agriculture, forestry, fishing and hunting, and mining (%)
Most Common Industries - Agriculture, forestry, fishing and hunting (%)
Most Common Industries - Mining, quarrying, and oil and gas extraction (%)
Most Common Industries - Construction (%)
Most Common Industries - Manufacturing (%)
Most Common Industries - Wholesale trade (%)
Most Common Industries - Retail trade (%)
Most Common Industries - Transportation and warehousing, and utilities (%)
Most Common Industries - Transportation and warehousing (%)
Most Common Industries - Utilities (%)
Most Common Industries - Information (%)
Most Common Industries - Finance and insurance, and real estate and rental and leasing (%)
Most Common Industries - Finance and insurance (%)
Most Common Industries - Real estate and rental and leasing (%)
Most Common Industries - Professional, scientific, and management, and administrative and waste management services (%)
Most Common Industries - Professional, scientific, and technical services (%)
Most Common Industries - Management of companies and enterprises (%)
Most Common Industries - Administrative and support and waste management services (%)
Most Common Industries - Educational services, and health care and social assistance (%)
Most Common Industries - Educational services (%)
Most Common Industries - Health care and social assistance (%)
Most Common Industries - Arts, entertainment, and recreation, and accommodation and food services (%)
Most Common Industries - Arts, entertainment, and recreation (%)
Most Common Industries - Accommodation and food services (%)
Most Common Industries - Other services, except public administration (%)
Most Common Industries - Public administration (%)
Occupation diversity
Most Common Occupations - Management, business, science, and arts occupations (%)
Most Common Occupations - Management, business, and financial occupations (%)
Most Common Occupations - Management occupations (%)
Most Common Occupations - Business and financial operations occupations (%)
Most Common Occupations - Computer, engineering, and science occupations (%)
Most Common Occupations - Computer and mathematical occupations (%)
Most Common Occupations - Architecture and engineering occupations (%)
Most Common Occupations - Life, physical, and social science occupations (%)
Most Common Occupations - Education, legal, community service, arts, and media occupations (%)
Most Common Occupations - Community and social service occupations (%)
Most Common Occupations - Legal occupations (%)
Most Common Occupations - Education, training, and library occupations (%)
Most Common Occupations - Arts, design, entertainment, sports, and media occupations (%)
Most Common Occupations - Healthcare practitioners and technical occupations (%)
Most Common Occupations - Health diagnosing and treating practitioners and other technical occupations (%)
Most Common Occupations - Health technologists and technicians (%)
Most Common Occupations - Service occupations (%)
Most Common Occupations - Healthcare support occupations (%)
Most Common Occupations - Protective service occupations (%)
Most Common Occupations - Fire fighting and prevention, and other protective service workers including supervisors (%)
Most Common Occupations - Law enforcement workers including supervisors (%)
Most Common Occupations - Food preparation and serving related occupations (%)
Most Common Occupations - Building and grounds cleaning and maintenance occupations (%)
Most Common Occupations - Personal care and service occupations (%)
Most Common Occupations - Sales and office occupations (%)
Most Common Occupations - Sales and related occupations (%)
Most Common Occupations - Office and administrative support occupations (%)
Most Common Occupations - Natural resources, construction, and maintenance occupations (%)
Most Common Occupations - Farming, fishing, and forestry occupations (%)
Most Common Occupations - Construction and extraction occupations (%)
Most Common Occupations - Installation, maintenance, and repair occupations (%)
Most Common Occupations - Production, transportation, and material moving occupations (%)
Most Common Occupations - Production occupations (%)
Most Common Occupations - Transportation occupations (%)
Most Common Occupations - Material moving occupations (%)
People in Group quarters - Institutionalized population (%)
People in Group quarters - Correctional institutions (%)
People in Group quarters - Federal prisons and detention centers (%)
People in Group quarters - Halfway houses (%)
People in Group quarters - Local jails and other confinement facilities (including police lockups) (%)
People in Group quarters - Military disciplinary barracks (%)
People in Group quarters - State prisons (%)
People in Group quarters - Other types of correctional institutions (%)
People in Group quarters - Nursing homes (%)
People in Group quarters - Hospitals/wards, hospices, and schools for the handicapped (%)
People in Group quarters - Hospitals/wards and hospices for chronically ill (%)
People in Group quarters - Hospices or homes for chronically ill (%)
People in Group quarters - Military hospitals or wards for chronically ill (%)
People in Group quarters - Other hospitals or wards for chronically ill (%)
People in Group quarters - Hospitals or wards for drug/alcohol abuse (%)
People in Group quarters - Mental (Psychiatric) hospitals or wards (%)
People in Group quarters - Schools, hospitals, or wards for the mentally retarded (%)
People in Group quarters - Schools, hospitals, or wards for the physically handicapped (%)
People in Group quarters - Institutions for the deaf (%)
People in Group quarters - Institutions for the blind (%)
People in Group quarters - Orthopedic wards and institutions for the physically handicapped (%)
People in Group quarters - Wards in general hospitals for patients who have no usual home elsewhere (%)
People in Group quarters - Wards in military hospitals for patients who have no usual home elsewhere (%)
People in Group quarters - Juvenile institutions (%)
People in Group quarters - Long-term care (%)
People in Group quarters - Homes for abused, dependent, and neglected children (%)
People in Group quarters - Residential treatment centers for emotionally disturbed children (%)
People in Group quarters - Training schools for juvenile delinquents (%)
People in Group quarters - Short-term care, detention or diagnostic centers for delinquent children (%)
People in Group quarters - Type of juvenile institution unknown (%)
People in Group quarters - Noninstitutionalized population (%)
People in Group quarters - College dormitories (includes college quarters off campus) (%)
People in Group quarters - Military quarters (%)
People in Group quarters - On base (%)
People in Group quarters - Barracks, unaccompanied personnel housing (UPH), (Enlisted/Officer), ;and similar group living quarters for military personnel (%)
People in Group quarters - Transient quarters for temporary residents (%)
People in Group quarters - Military ships (%)
People in Group quarters - Group homes (%)
People in Group quarters - Homes or halfway houses for drug/alcohol abuse (%)
People in Group quarters - Homes for the mentally ill (%)
People in Group quarters - Homes for the mentally retarded (%)
People in Group quarters - Homes for the physically handicapped (%)
People in Group quarters - Other group homes (%)
People in Group quarters - Religious group quarters (%)
People in Group quarters - Dormitories (%)
People in Group quarters - Agriculture workers' dormitories on farms (%)
People in Group quarters - Job Corps and vocational training facilities (%)
People in Group quarters - Other workers' dormitories (%)
People in Group quarters - Crews of maritime vessels (%)
People in Group quarters - Other nonhousehold living situations (%)
People in Group quarters - Other noninstitutional group quarters (%)
Residents speaking English at home (%)
Residents speaking English at home - Born in the United States (%)
Residents speaking English at home - Native, born elsewhere (%)
Residents speaking English at home - Foreign born (%)
Residents speaking Spanish at home (%)
Residents speaking Spanish at home - Born in the United States (%)
Residents speaking Spanish at home - Native, born elsewhere (%)
Residents speaking Spanish at home - Foreign born (%)
Residents speaking other language at home (%)
Residents speaking other language at home - Born in the United States (%)
Residents speaking other language at home - Native, born elsewhere (%)
Residents speaking other language at home - Foreign born (%)
Class of Workers - Employee of private company (%)
Class of Workers - Self-employed in own incorporated business (%)
Class of Workers - Private not-for-profit wage and salary workers (%)
Class of Workers - Local government workers (%)
Class of Workers - State government workers (%)
Class of Workers - Federal government workers (%)
Class of Workers - Self-employed workers in own not incorporated business and Unpaid family workers (%)
House heating fuel used in houses and condos - Utility gas (%)
House heating fuel used in houses and condos - Bottled, tank, or LP gas (%)
House heating fuel used in houses and condos - Electricity (%)
House heating fuel used in houses and condos - Fuel oil, kerosene, etc. (%)
House heating fuel used in houses and condos - Coal or coke (%)
House heating fuel used in houses and condos - Wood (%)
House heating fuel used in houses and condos - Solar energy (%)
House heating fuel used in houses and condos - Other fuel (%)
House heating fuel used in houses and condos - No fuel used (%)
House heating fuel used in apartments - Utility gas (%)
House heating fuel used in apartments - Bottled, tank, or LP gas (%)
House heating fuel used in apartments - Electricity (%)
House heating fuel used in apartments - Fuel oil, kerosene, etc. (%)
House heating fuel used in apartments - Coal or coke (%)
House heating fuel used in apartments - Wood (%)
House heating fuel used in apartments - Solar energy (%)
House heating fuel used in apartments - Other fuel (%)
House heating fuel used in apartments - No fuel used (%)
Armed forces status - In Armed Forces (%)
Armed forces status - Civilian (%)
Armed forces status - Civilian - Veteran (%)
Armed forces status - Civilian - Nonveteran (%)
Fatal accidents locations in years 2005-2021
Fatal accidents locations in 2005
Fatal accidents locations in 2006
Fatal accidents locations in 2007
Fatal accidents locations in 2008
Fatal accidents locations in 2009
Fatal accidents locations in 2010
Fatal accidents locations in 2011
Fatal accidents locations in 2012
Fatal accidents locations in 2013
Fatal accidents locations in 2014
Fatal accidents locations in 2015
Fatal accidents locations in 2016
Fatal accidents locations in 2017
Fatal accidents locations in 2018
Fatal accidents locations in 2019
Fatal accidents locations in 2020
Fatal accidents locations in 2021
Alcohol use - People drinking some alcohol every month (%)
Alcohol use - People not drinking at all (%)
Alcohol use - Average days/month drinking alcohol
Alcohol use - Average drinks/week
Alcohol use - Average days/year people drink much
Audiometry - Average condition of hearing (%)
Audiometry - People that can hear a whisper from across a quiet room (%)
Audiometry - People that can hear normal voice from across a quiet room (%)
Audiometry - Ears ringing, roaring, buzzing (%)
Audiometry - Had a job exposure to loud noise (%)
Audiometry - Had off-work exposure to loud noise (%)
Blood Pressure & Cholesterol - Has high blood pressure (%)
Blood Pressure & Cholesterol - Checking blood pressure at home (%)
Blood Pressure & Cholesterol - Frequently checking blood cholesterol (%)
Blood Pressure & Cholesterol - Has high cholesterol level (%)
Consumer Behavior - Money monthly spent on food at supermarket/grocery store
Consumer Behavior - Money monthly spent on food at other stores
Consumer Behavior - Money monthly spent on eating out
Consumer Behavior - Money monthly spent on carryout/delivered foods
Consumer Behavior - Income spent on food at supermarket/grocery store (%)
Consumer Behavior - Income spent on food at other stores (%)
Consumer Behavior - Income spent on eating out (%)
Consumer Behavior - Income spent on carryout/delivered foods (%)
Current Health Status - General health condition (%)
Current Health Status - Blood donors (%)
Current Health Status - Has blood ever tested for HIV virus (%)
Current Health Status - Left-handed people (%)
Dermatology - People using sunscreen (%)
Diabetes - Diabetics (%)
Diabetes - Had a blood test for high blood sugar (%)
Diabetes - People taking insulin (%)
Diet Behavior & Nutrition - Diet health (%)
Diet Behavior & Nutrition - Milk product consumption (# of products/month)
Diet Behavior & Nutrition - Meals not home prepared (#/week)
Diet Behavior & Nutrition - Meals from fast food or pizza place (#/week)
Diet Behavior & Nutrition - Ready-to-eat foods (#/month)
Diet Behavior & Nutrition - Frozen meals/pizza (#/month)
Drug Use - People that ever used marijuana or hashish (%)
Drug Use - Ever used hard drugs (%)
Drug Use - Ever used any form of cocaine (%)
Drug Use - Ever used heroin (%)
Drug Use - Ever used methamphetamine (%)
Health Insurance - People covered by health insurance (%)
Kidney Conditions-Urology - Avg. # of times urinating at night
Medical Conditions - People with asthma (%)
Medical Conditions - People with anemia (%)
Medical Conditions - People with psoriasis (%)
Medical Conditions - People with overweight (%)
Medical Conditions - Elderly people having difficulties in thinking or remembering (%)
Medical Conditions - People who ever received blood transfusion (%)
Medical Conditions - People having trouble seeing even with glass/contacts (%)
Medical Conditions - People with arthritis (%)
Medical Conditions - People with gout (%)
Medical Conditions - People with congestive heart failure (%)
Medical Conditions - People with coronary heart disease (%)
Medical Conditions - People with angina pectoris (%)
Medical Conditions - People who ever had heart attack (%)
Medical Conditions - People who ever had stroke (%)
Medical Conditions - People with emphysema (%)
Medical Conditions - People with thyroid problem (%)
Medical Conditions - People with chronic bronchitis (%)
Medical Conditions - People with any liver condition (%)
Medical Conditions - People who ever had cancer or malignancy (%)
Mental Health - People who have little interest in doing things (%)
Mental Health - People feeling down, depressed, or hopeless (%)
Mental Health - People who have trouble sleeping or sleeping too much (%)
Mental Health - People feeling tired or having little energy (%)
Mental Health - People with poor appetite or overeating (%)
Mental Health - People feeling bad about themself (%)
Mental Health - People who have trouble concentrating on things (%)
Mental Health - People moving or speaking slowly or too fast (%)
Mental Health - People having thoughts they would be better off dead (%)
Oral Health - Average years since last visit a dentist
Oral Health - People embarrassed because of mouth (%)
Oral Health - People with gum disease (%)
Oral Health - General health of teeth and gums (%)
Oral Health - Average days a week using dental floss/device
Oral Health - Average days a week using mouthwash for dental problem
Oral Health - Average number of teeth
Pesticide Use - Households using pesticides to control insects (%)
Pesticide Use - Households using pesticides to kill weeds (%)
Physical Activity - People doing vigorous-intensity work activities (%)
Physical Activity - People doing moderate-intensity work activities (%)
Physical Activity - People walking or bicycling (%)
Physical Activity - People doing vigorous-intensity recreational activities (%)
Physical Activity - People doing moderate-intensity recreational activities (%)
Physical Activity - Average hours a day doing sedentary activities
Physical Activity - Average hours a day watching TV or videos
Physical Activity - Average hours a day using computer
Physical Functioning - People having limitations keeping them from working (%)
Physical Functioning - People limited in amount of work they can do (%)
Physical Functioning - People that need special equipment to walk (%)
Physical Functioning - People experiencing confusion/memory problems (%)
Physical Functioning - People requiring special healthcare equipment (%)
Prescription Medications - Average number of prescription medicines taking
Preventive Aspirin Use - Adults 40+ taking low-dose aspirin (%)
Reproductive Health - Vaginal deliveries (%)
Reproductive Health - Cesarean deliveries (%)
Reproductive Health - Deliveries resulted in a live birth (%)
Reproductive Health - Pregnancies resulted in a delivery (%)
Reproductive Health - Women breastfeeding newborns (%)
Reproductive Health - Women that had a hysterectomy (%)
Reproductive Health - Women that had both ovaries removed (%)
Reproductive Health - Women that have ever taken birth control pills (%)
Reproductive Health - Women taking birth control pills (%)
Reproductive Health - Women that have ever used Depo-Provera or injectables (%)
Reproductive Health - Women that have ever used female hormones (%)
Sexual Behavior - People 18+ that ever had sex (vaginal, anal, or oral) (%)
Sexual Behavior - Males 18+ that ever had vaginal sex with a woman (%)
Sexual Behavior - Males 18+ that ever performed oral sex on a woman (%)
Sexual Behavior - Males 18+ that ever had anal sex with a woman (%)
Sexual Behavior - Males 18+ that ever had any sex with a man (%)
Sexual Behavior - Females 18+ that ever had vaginal sex with a man (%)
Sexual Behavior - Females 18+ that ever performed oral sex on a man (%)
Sexual Behavior - Females 18+ that ever had anal sex with a man (%)
Sexual Behavior - Females 18+ that ever had any kind of sex with a woman (%)
Sexual Behavior - Average age people first had sex
Sexual Behavior - Average number of female sex partners in lifetime (males 18+)
Sexual Behavior - Average number of female vaginal sex partners in lifetime (males 18+)
Sexual Behavior - Average age people first performed oral sex on a woman (18+)
Sexual Behavior - Average number of woman performed oral sex on in lifetime (18+)
Sexual Behavior - Average number of male sex partners in lifetime (males 18+)
Sexual Behavior - Average number of male anal sex partners in lifetime (males 18+)
Sexual Behavior - Average age people first performed oral sex on a man (18+)
Sexual Behavior - Average number of male oral sex partners in lifetime (18+)
Sexual Behavior - People using protection when performing oral sex (%)
Sexual Behavior - Average number of times people have vaginal or anal sex a year
Sexual Behavior - People having sex without condom (%)
Sexual Behavior - Average number of male sex partners in lifetime (females 18+)
Sexual Behavior - Average number of male vaginal sex partners in lifetime (females 18+)
Sexual Behavior - Average number of female sex partners in lifetime (females 18+)
Sexual Behavior - Circumcised males 18+ (%)
Sleep Disorders - Average hours sleeping at night
Sleep Disorders - People that has trouble sleeping (%)
Smoking-Cigarette Use - People smoking cigarettes (%)
Taste & Smell - People 40+ having problems with smell (%)
Taste & Smell - People 40+ having problems with taste (%)
Taste & Smell - People 40+ that ever had wisdom teeth removed (%)
Taste & Smell - People 40+ that ever had tonsils teeth removed (%)
Taste & Smell - People 40+ that ever had a loss of consciousness because of a head injury (%)
Taste & Smell - People 40+ that ever had a broken nose or other serious injury to face or skull (%)
Taste & Smell - People 40+ that ever had two or more sinus infections (%)
Weight - Average height (inches)
Weight - Average weight (pounds)
Weight - Average BMI
Weight - People that are obese (%)
Weight - People that ever were obese (%)
Weight - People trying to lose weight (%)
Urban population: 6,734
Rural population: 5,672
Estimated median house/condo value in 2022: $105,495
14411:
$105,495New York:
$400,400
Median resident age: This zip code:
45.6 yearsNew York median age:
40.0 years
Average household size: This zip code:
2.1 peopleNew York:
2.5 people
Averages for the 2020 tax year for zip code 14411, filed in 2021:
Average Adjusted Gross Income (AGI) in 2020: $49,283 (Individual Income Tax Returns) Here:
$49,283State:
$90,930
Salary/wage: $41,903 (reported on 82.0% of returns )Here:
$41,903State:
$72,104
(% of AGI for various income ranges: 1172.0% for AGIs below $25k , 3386.7% for AGIs $25k-50k , 5978.8% for AGIs $50k-75k , 9077.6% for AGIs $75k-100k , 15602.2% for AGIs $100k-200k , 55125.0% for AGIs over 200k ) Taxable interest for individuals: $750 (reported on 33.7% of returns )This zip code:
$750New York:
$3,075
(% of AGI for various income ranges: 14.4% for AGIs below $25k , 13.0% for AGIs $25k-50k , 35.5% for AGIs $50k-75k , 44.7% for AGIs $75k-100k , 133.4% for AGIs $100k-200k , 1205.0% for AGIs over 200k ) Ordinary dividends: $2,852 (reported on 13.6% of returns )(% of AGI for various income ranges: 21.8% for AGIs below $25k , 17.3% for AGIs $25k-50k , 37.5% for AGIs $50k-75k , 87.4% for AGIs $75k-100k , 195.6% for AGIs $100k-200k , 2445.0% for AGIs over 200k ) Net capital gain/loss in AGI: +$9,409 (reported on 9.9% of returns )Here:
+$9,409State:
+$44,925
(% of AGI for various income ranges: 10.1% for AGIs below $25k , 22.2% for AGIs $25k-50k , 94.3% for AGIs $50k-75k , 153.5% for AGIs $75k-100k , 594.1% for AGIs $100k-200k , 8855.0% for AGIs over 200k ) Profit/loss from business: +$7,957 (reported on 9.0% of returns )Here:
+$7,957State:
+$14,940
(% of AGI for various income ranges: 39.8% for AGIs below $25k , 35.2% for AGIs $25k-50k , 65.7% for AGIs $50k-75k , 113.5% for AGIs $75k-100k , 690.3% for AGIs $100k-200k ) Taxable individual retirement arrangement distribution: $13,171 (reported on 9.0% of returns )14411:
$13,171New York:
$19,609
(% of AGI for various income ranges: 55.0% for AGIs below $25k , 84.0% for AGIs $25k-50k , 196.3% for AGIs $50k-75k , 308.5% for AGIs $75k-100k , 765.9% for AGIs $100k-200k ) Total itemized deductions: $27,908 (reported on 2.3% of returns )Here:
$27,908State:
$39,326
(% of AGI for various income ranges: 58.0% for AGIs $25k-50k , 97.2% for AGIs $50k-75k , 142.4% for AGIs $75k-100k , 528.8% for AGIs $100k-200k ) Charity contributions: $9,040 (reported on 1.8% of returns )(% of AGI for various income ranges: 53.3% for AGIs $50k-75k , 170.9% for AGIs $100k-200k ) Taxes paid: $7,662 (reported on 2.3% of returns )(% of AGI for various income ranges: 12.0% for AGIs $25k-50k , 26.9% for AGIs $50k-75k , 50.9% for AGIs $75k-100k , 149.1% for AGIs $100k-200k ) Earned income credit: $2,119 (reported on 17.8% of returns )(% of AGI for various income ranges: 84.1% for AGIs below $25k , 72.8% for AGIs $25k-50k ) Percentage of individuals using paid preparers for their 2020 taxes: 95.2%(% for various income ranges: 91.9% for AGIs below $25k , 96.4% for AGIs $25k-50k , 97.8% for AGIs $50k-75k , 98.0% for AGIs $75k-100k , 96.4% for AGIs $100k-200k , 100.0% for AGIs over 200k )
Averages for the 2012 tax year for zip code 14411, filed in 2013:
Average Adjusted Gross Income (AGI) in 2012: $41,740 (Individual Income Tax Returns) Here:
$41,740State:
$77,088
Salary/wage: $36,600 (reported on 85.0% of returns )Here:
$36,600State:
$60,593
(% of AGI for various income ranges: 72.2% for AGIs below $25k , 79.2% for AGIs $25k-50k , 75.7% for AGIs $50k-75k , 75.2% for AGIs $75k-100k , 77.4% for AGIs $100k-200k , 40.7% for AGIs over 200k ) Taxable interest for individuals: $732 (reported on 37.7% of returns )This zip code:
$732New York:
$3,125
(% of AGI for various income ranges: 0.9% for AGIs below $25k , 0.5% for AGIs $25k-50k , 0.6% for AGIs $50k-75k , 0.6% for AGIs $75k-100k , 0.6% for AGIs $100k-200k , 1.2% for AGIs over 200k ) Ordinary dividends: $2,308 (reported on 16.3% of returns )(% of AGI for various income ranges: 1.1% for AGIs below $25k , 0.6% for AGIs $25k-50k , 0.8% for AGIs $50k-75k , 0.8% for AGIs $75k-100k , 1.6% for AGIs $100k-200k ) Net capital gain/loss in AGI: +$5,030 (reported on 9.8% of returns )Here:
+$5,030State:
+$42,474
(% of AGI for various income ranges: 0.3% for AGIs $25k-50k , 1.1% for AGIs $50k-75k , 1.0% for AGIs $75k-100k , 0.7% for AGIs $100k-200k , 11.3% for AGIs over 200k ) Profit/loss from business: +$10,056 (reported on 10.3% of returns )Here:
+$10,056State:
+$16,168
(% of AGI for various income ranges: 3.1% for AGIs below $25k , 2.5% for AGIs $25k-50k , 0.8% for AGIs $50k-75k , 1.5% for AGIs $75k-100k , 5.3% for AGIs $100k-200k ) Taxable individual retirement arrangement distribution: $10,098 (reported on 8.9% of returns )14411:
$10,098New York:
$17,621
(% of AGI for various income ranges: 2.8% for AGIs below $25k , 1.8% for AGIs $25k-50k , 2.4% for AGIs $50k-75k , 1.8% for AGIs $75k-100k , 2.7% for AGIs $100k-200k ) Self-employment retirement plans: $20,300 (reported on 0.4% of returns )14411:
$20,300New York:
$27,330
Total itemized deductions: $16,498 (20% of AGI, reported on 21.4% of returns )Here:
$16,498State:
$34,985
Here:
20.2% of AGIState:
21.3% of AGI
(% of AGI for various income ranges: 4.4% for AGIs below $25k , 6.3% for AGIs $25k-50k , 8.0% for AGIs $50k-75k , 9.9% for AGIs $75k-100k , 12.4% for AGIs $100k-200k , 9.8% for AGIs over 200k ) Charity contributions: $2,862 (reported on 16.1% of returns )(% of AGI for various income ranges: 0.3% for AGIs below $25k , 0.6% for AGIs $25k-50k , 1.1% for AGIs $50k-75k , 1.5% for AGIs $75k-100k , 1.8% for AGIs $100k-200k , 1.6% for AGIs over 200k ) Taxes paid: $7,826 (reported on 21.2% of returns )14411:
$7,826State:
$18,656
(% of AGI for various income ranges: 1.1% for AGIs below $25k , 2.4% for AGIs $25k-50k , 3.5% for AGIs $50k-75k , 4.6% for AGIs $75k-100k , 6.9% for AGIs $100k-200k , 6.8% for AGIs over 200k ) Earned income credit: $2,115 (reported on 19.4% of returns )(% of AGI for various income ranges: 5.6% for AGIs below $25k , 1.1% for AGIs $25k-50k ) Percentage of individuals using paid preparers for their 2012 taxes: 56.0%(% for various income ranges: 48.9% for AGIs below $25k , 56.3% for AGIs $25k-50k , 61.3% for AGIs $50k-75k , 69.6% for AGIs $75k-100k , 69.4% for AGIs $100k-200k , 75.0% for AGIs over 200k )
Averages for the 2004 tax year for zip code 14411, filed in 2005:
Average Adjusted Gross Income (AGI) in 2004: $33,829 (Individual Income Tax Returns) Here:
$33,829State:
$59,519
Salary/wage: $30,629 (reported on 86.5% of returns )Here:
$30,629State:
$50,673
(% of AGI for various income ranges: 97.0% for AGIs below $10k , 76.4% for AGIs $10k-25k , 78.5% for AGIs $25k-50k , 80.0% for AGIs $50k-75k , 84.3% for AGIs $75k-100k , 65.7% for AGIs over 100k ) Taxable interest for individuals: $1,057 (reported on 49.3% of returns )This zip code:
$1,057New York:
$2,377
(% of AGI for various income ranges: 3.7% for AGIs below $10k , 1.7% for AGIs $10k-25k , 1.2% for AGIs $25k-50k , 1.0% for AGIs $50k-75k , 0.5% for AGIs $75k-100k , 4.0% for AGIs over 100k ) Taxable dividends: $1,456 (reported on 23.2% of returns )(% of AGI for various income ranges: 4.3% for AGIs below $10k , 0.9% for AGIs $10k-25k , 0.8% for AGIs $25k-50k , 0.6% for AGIs $50k-75k , 0.5% for AGIs $75k-100k , 2.3% for AGIs over 100k ) Net capital gain/loss: +$2,677 (reported on 15.1% of returns )Here:
+$2,677State:
+$23,581
(% of AGI for various income ranges: -0.2% for AGIs below $10k , 0.6% for AGIs $10k-25k , 0.6% for AGIs $25k-50k , 0.9% for AGIs $50k-75k , 0.7% for AGIs $75k-100k , 4.8% for AGIs over 100k ) Profit/loss from business: +$7,279 (reported on 11.4% of returns )Here:
+$7,279State:
+$13,809
(% of AGI for various income ranges: 3.6% for AGIs below $10k , 2.8% for AGIs $10k-25k , 2.3% for AGIs $25k-50k , 1.6% for AGIs $50k-75k , 3.2% for AGIs $75k-100k , 2.9% for AGIs over 100k ) IRA payment deduction: $2,378 (reported on 2.1% of returns )14411:
$2,378New York:
$3,115
(% of AGI for various income ranges: 0.1% for AGIs $10k-25k , 0.2% for AGIs $25k-50k , 0.2% for AGIs $50k-75k , 0.2% for AGIs $75k-100k ) Self-employed pension: $9,333 (reported on 0.3% of returns )Here:
$9,333New York:
$19,016
Total itemized deductions: $14,148 (22% of AGI, reported on 23.9% of returns )Here:
$14,148State:
$25,864
Here:
21.9% of AGIState:
21.9% of AGI
(% of AGI for various income ranges: 3.5% for AGIs below $10k , 4.0% for AGIs $10k-25k , 8.1% for AGIs $25k-50k , 11.6% for AGIs $50k-75k , 13.8% for AGIs $75k-100k , 14.6% for AGIs over 100k ) Charity contributions deductions: $2,269 (3% of AGI, reported on 21.4% of returns )Here:
3.4% of AGIState:
3.6% of AGI
(% of AGI for various income ranges: 0.4% for AGIs $10k-25k , 1.0% for AGIs $25k-50k , 1.5% for AGIs $50k-75k , 2.1% for AGIs $75k-100k , 2.9% for AGIs over 100k ) Total tax: $3,845 (reported on 72.1% of returns )14411:
$3,845State:
$11,730
(% of AGI for various income ranges: 2.0% for AGIs below $10k , 3.7% for AGIs $10k-25k , 6.6% for AGIs $25k-50k , 8.4% for AGIs $50k-75k , 10.1% for AGIs $75k-100k , 15.5% for AGIs over 100k ) Earned income credit: $1,756 (reported on 18.5% of returns )Percentage of individuals using paid preparers for their 2004 taxes: 61.8%(% for various income ranges: 54.6% for AGIs below $10k , 58.4% for AGIs $10k-25k , 63.8% for AGIs $25k-50k , 68.4% for AGIs $50k-75k , 69.6% for AGIs $75k-100k , 78.2% for AGIs over 100k )
Estimated median household income in 2022: This zip code:
$48,212New York:
$79,557
Nearest zip codes: 14479 ,
14571 ,
14477 ,
14058 ,
14470 ,
14125 .
Percentage of family households: This zip code:
37.9%New York:
41.3%
Percentage of households with unmarried partners: This zip code:
11.6%New York:
42.3%
Likely homosexual households (counted as self-reported same-sex unmarried-partner households)
Lesbian couples: 0.1% of all households Gay men: 0.2% of all households
Household received Food Stamps/SNAP in the past 12 months: 1,006Household did not receive Food Stamps/SNAP in the past 12 months: 4,089
Women who had a birth in the past 12 months: 109 (104 now married , 3 unmarried) Women who did not have a birth in the past 12 months: 2,489 (837 now married , 1,655 unmarried)
Housing units in zip code 14411 with a mortgage: 1,938 (218
second mortgage , 28
home equity loan , 135
both second mortgage and home equity loan )
Houses without a mortgage: 140
Median monthly owner costs for units with a mortgage: $1,199
Median monthly owner costs for units without a mortgage: $602
Residents with income below the poverty level in 2022:
This zip code:
19.9%Whole state:
14.3%
Residents with income below 50% of the poverty level in 2022:
This zip code:
5.8%Whole state:
6.8%
Median number of rooms in houses and condos: Median number of rooms in apartments: Notable locations in this zip code not listed on our city pages
Click to draw/clear zip code borders Notable locations in zip code 14411: (A) , Intergrow Greenhouses (B) , Panek Farms (C) , Wild Rose Farm (D) , Sunrich Farms (E) , Stymus Farms (F) , Shady Maple Farm (G) , Touhey Farms (H) , H and R Farms (I) , Nice Farms (J) , Navarra Farm and Greenhouse (K) , Mill Stream Farms (L) , Vendetti Farms (M) , Kempenland Farm (N) , Kast Farms (O) , Embten Acres (P) , Imburgia Farms (Q) , Hugh Lane Farm (R) , Hicks Hollow Farm (S) , H and E Farms (T) . Display/hide their locations on the map
Churches in zip code 14411 include: (A) , Saint Mary's Polish Roman Catholic Church (B) , Pullman Universalist Memorial Church (C) , Free Methodist Church (D) , First Baptist Church (E) , Saint Joseph's Roman Catholic Church (F) , Christ Episcopal Church (G) , First Presbyterian Church (H) , Transit Church (I) . Display/hide their locations on the map
Cemeteries: (1) , Gaines Cemetery (2) , Standish Cemetery (3) , Transit Cemetery (4) , West Barre Cemetery (5) , Pine Hill Cemetery (6) , Snyder Cemetery (7) . Display/hide their locations on the map
Reservoirs: (A) , Albion Reservoir Number One (B) , Waterport Pond (C) . Display/hide their locations on the map
Creek: (A) . Display/hide its location on the map
Park in zip code 14411: (1) . Display/hide its location on the map
Year house built (houses)
0 2020 or later70 2010 to 2019309 2000 to 2009406 1990 to 1999723 1980 to 1989543 1970 to 1979269 1960 to 1969543 1950 to 1959306 1940 to 19492,488 1939 or earlier
Zip code 14411 household income distribution in 2022 556 Less than $10,000384 $10,000 to $14,999141 $15,000 to $19,999132 $20,000 to $24,999389 $25,000 to $29,999128 $30,000 to $34,999373 $35,000 to $39,999373 $40,000 to $44,999154 $45,000 to $49,999430 $50,000 to $59,999458 $60,000 to $74,999718 $75,000 to $99,999412 $100,000 to $124,999158 $125,000 to $149,999230 $150,000 to $199,99983 $200,000 or moreEstimate of home value of owner-occupied houses/condos in 2022 in zip code 14411 198 Less than $10,00094 $10,000 to $14,999123 $15,000 to $19,99941 $20,000 to $24,99919 $25,000 to $29,99947 $30,000 to $34,99915 $35,000 to $39,99997 $40,000 to $49,999179 $50,000 to $59,999295 $60,000 to $69,999352 $70,000 to $79,999241 $80,000 to $89,99990 $90,000 to $99,999487 $100,000 to $124,999298 $125,000 to $149,999165 $150,000 to $174,999137 $175,000 to $199,999253 $200,000 to $249,999138 $250,000 to $299,999127 $300,000 to $399,99911 $400,000 to $499,99917 $500,000 to $749,99926 $750,000 to $999,9995 $2,000,000 or moreRent paid by renters in 2022 in zip code 14411 10 $100 to $14925 $200 to $24910 $250 to $29914 $300 to $34989 $350 to $39924 $400 to $44957 $450 to $499209 $500 to $54950 $550 to $599216 $600 to $649178 $650 to $699297 $700 to $749130 $750 to $79922 $800 to $8995 $1,000 to $1,2493 $1,250 to $1,49927 $1,500 to $1,99943 $3,000 to $3,499112 No cash rent
Median gross rent in 2022: $802.
Estimated median house (or condo) value in 2022 for: White Non-Hispanic householders: $112,010Black or African American householders: $102,081American Indian or Alaska Native householders: $174,531Asian householders: $174,531Some other race householders: $238,293Two or more races householders: $132,799Hispanic or Latino householders: $252,101Estimated median house or condo value in 2022: $105,495
14411:
$105,495New York:
$400,400
Lower value quartile - upper value quartile: $68,874 - $152,369
Mean price in 2022: Detached houses: $259,603Here:
$259,603State:
$476,719
Townhouses or other attached units: $289,894Here:
$289,894State:
$699,270
In 2-unit structures: $42,649Here:
$42,649State:
$713,077
Mobile homes: $40,754Here:
$40,754State:
$88,925
Housing units in structures:
One, detached: 3,658One, attached: 132Two: 4423 or 4: 3965 to 9: 13210 to 19: 10320 to 49: 8950 or more: 35Mobile homes: 727Unemployment : 8.5%
Means of transportation to work in zip code 14411 70.3% 3,243 Drove a car alone11.1% 514 Carpooled0.8% 35 Motorcycle0.6% 27 Bicycle5.7% 265 Walked1.8% 84 Other means10.2% 473 Worked at homeTravel time to work (commute) in zip code 14411 355 Less than 5 minutes734 5 to 9 minutes393 10 to 14 minutes453 15 to 19 minutes256 20 to 24 minutes239 25 to 29 minutes588 30 to 34 minutes256 35 to 39 minutes132 40 to 44 minutes398 45 to 59 minutes227 60 to 89 minutes61 90 or more minutes
Percentage of zip code residents living and working in this county: 65.6%
Household type by relationship:
Households: 12,407
Male householders: 2,534 (963 living alone ), Female householders: 2,537 (983 living alone )1,954 spouses (1,904 opposite-sex spouses ), 553 unmarried partners , (535 opposite-sex unmarried partners ), 2,623 children (2,499 natural , 4 adopted , 119 stepchildren ), 109 grandchildren , 12 brothers or sisters , 149 parents , 17 foster children , 89 other relatives , 123 non-relatives In group quarters: 1,917 (-1 institutionalized population )
Size of family households: 1,473 2-persons , 583 3-persons , 503 4-persons , 107 5-persons , 81 6-persons , 55 7-or-more-persons
Size of nonfamily households: 1,947 1-person , 338 2-persons , 2 3-persons , 13 4-persons
900 married couples with children. single-parent households (235 men , 618 women ).
94.9% of residents of 14411 zip code speak English at home. of residents speak Spanish at home (92% very well, 6% well, 2% not at all ).of residents speak other Indo-European language at home (27% very well, 38% well, 35% not well ).of residents speak Asian or Pacific Island language at home (62% very well, 28% well, 10% not well ).of residents speak other language at home (100% very well ).
Foreign born population: 317 (2.6%)
(78.9%
of them are naturalized citizens )
This zip code:
2.6%Whole state:
22.7%
20% Honduras 19% Haiti 8% Singapore 7% Dominica 5% Taiwan 4% France 4% North Macedonia (Macedonia) 16% English 15% Italian 15% German 12% American 10% Irish 3% Polish 2% Scottish
Year of entry for the foreign-born population
51 2010 or later 30 2000 to 2009 60 1990 to 1999 270 Before 1990
Major facilities with environmental interests located in this zip code:
ALBION ELEMENTARY SCHOOL (324 EAST AVE in ALBION, NY)
AIR SYNTHETIC MINOR (AIRS/AFS) STATE MASTER (New York facility tracking) - AIR PROGRAM, National Pollutant Discharge Elimination System Permit (Resource Conservation and Recovery Act (tracking hazardous waste)) Conditionally Exempt Small Quantity Generators, less than 100 kg/month of hazardous waste (Resource Conservation and Recovery Act (tracking hazardous waste)) - notification Business SIC and NAICS classification: ELEMENTARY AND SECONDARY SCHOOLSOrganizations: ALBION CENTRAL SCHOOL DIST (CONTACT/OWNER)
, ALBION CTL SCH DIST (LEGALLY RESPONSIBLE PARTY)
Alternative names: ALBION CENTRAL SCHOOL DIST, ALBION PRIMARY SCHOOL
ALBION JOINT MUN INDUSTRIES POL CTRL (14740 DENSMORE STREET in ALBION, NY)
(Integrated Compliance Information System) - ICIS-02-2001-3304, FORMAL ENFORCEMENT ACTION, ICIS-02-2001-3012, National Pollutant Discharge Elimination System MAJOR (Tracking pollutant discharge elimination systems) - permit Business SIC classification: SEWERAGE SYSTEMSOrganizations: ALBION (V) (CONTACT/OWNER)
Alternative names: ALBION (V), VILLAGE OF ALBION JMIPCF
ALBION CORR FACIL ( in ALBION, NY)
(National Center for Education Statistics) - STATE ID-450101969201 Organizations: ALBION CSD (SCHOOL DISTRICT)
ALBION ES ( in ALBION, NY)
(National Center for Education Statistics) - STATE ID-450101060002 Organizations: ALBION CSD (SCHOOL DISTRICT)
ALBION HS ( in ALBION, NY)
(National Center for Education Statistics) - STATE ID-450101060003 Organizations: ALBION CSD (SCHOOL DISTRICT)
ALBION MS ( in ALBION, NY)
(National Center for Education Statistics) - STATE ID-450101060005 Organizations: ALBION CSD (SCHOOL DISTRICT)
ALBION VILLAGE OF BOOSTIC PUMP STATION (OAK ORCHARD RD (RTE 98) in ALBION, NY)
(Resource Conservation and Recovery Act (tracking hazardous waste)) Organizations: VILLAGE OF ALBION (CONTACT/OPERATOR)
ALBION VILLAGE OF GARAGE (301 WASHINGTON ST in ALBION, NY)
(Resource Conservation and Recovery Act (tracking hazardous waste)) Organizations: VILLAGE OF ALBION (CONTACT/OWNER)
ALBION VILLAGE OF VILLAGE GARAGE (WEST ACADEMY ST in ALBION, NY)
(Resource Conservation and Recovery Act (tracking hazardous waste)) Organizations: VILLAGE OF ALBION (CONTACT/OPERATOR)
AGWAY PETROLEUM CORP (W STATE ST in ALBION, NY)
(Resource Conservation and Recovery Act (tracking hazardous waste))
ALBION #80 SUB (E BANK ST in ALBION, NY)
(Resource Conservation and Recovery Act (tracking hazardous waste))
ALBION SUBSTATION (235 WEST AVE in ALBION, NY)
(Resource Conservation and Recovery Act (tracking hazardous waste))
CONFER CINDY (13866 ROOT RD in ALBION, NY)
(Resource Conservation and Recovery Act (tracking hazardous waste))
Housing units lacking complete plumbing facilities: 2.5%
Housing units lacking complete kitchen facilities: 4.6%
54.8% Utility gas 14.1% Bottled, tank, or LP gas 12.8% Electricity 12.3% Fuel oil, kerosene, etc. 4.0% Wood 1.9% Other fuel
Population in 1990: 12,743. Population change in the 1990s: +1,933 (+15.2%).
Place of birth for U.S.-born residents:
This state: 10,457Northeast: 415Midwest: 360South: 365West: 368
59% of the 14411 zip code residents lived in the same house 5 years ago.
Out of people who lived in different houses, 56% lived in this county.
Out of people who lived in different counties, 50% lived in New York.
90% of the 14411 zip code residents lived in the same house 1 year ago.
Out of people who lived in different houses, 28% moved from this county.
Out of people who lived in different houses, 66% moved from different county within same state.
Out of people who lived in different houses, 6% moved from different state.
Out of people who lived in different houses, 1% moved from abroad.
Private vs. public school enrollment:
Students in private schools in grades 1 to 8 (elementary and middle school): 113
Students in private schools in grades 9 to 12 (high school): 66
Students in private undergraduate colleges: 19
Occupation by median earnings in the past 12 months ($)
73,376 Management occupations 72,432 Architecture and engineering occupations 68,697 Education, training, and library occupations 65,358 Community and social service occupations 65,063 Health diagnosing and treating practitioners and other technical occupations 63,773 Law enforcement workers including supervisors
Top industries in this zip code by the number of employees in 2005:
Finance and Insurance: Savings Institutions (500-999 employees: 1 establishment, 20-49 employees: 1 establishment, 5-9 employees: 1 establishment)Accommodation and Food Services: Limited-Service Restaurants (50-99: 1, 20-49: 2, 10-19: 1, 5-9: 1, 1-4: 2)Health Care and Social Assistance: Other Individual and Family Services (50-99: 1, 20-49: 1, 10-19: 1, 5-9: 1, 1-4: 2)Health Care and Social Assistance: Services for the Elderly and Persons with Disabilities (50-99: 1, 20-49: 1)Accommodation and Food Services: Full-Service Restaurants (20-49: 2, 5-9: 2, 1-4: 4)Health Care and Social Assistance: All Other Outpatient Care Centers (50-99: 1, 10-19: 1)
People in group quarters in 2010:
1,901 people in state prisons
126 people in nursing facilities/skilled-nursing facilities
67 people in local jails and other municipal confinement facilities
40 people in group homes intended for adults
People in group quarters in 2000:
1,446 people in state prisons
155 people in nursing homes
103 people in local jails and other confinement facilities (including police lockups)
Fatal accident statistics in 2011:
Fatal accident count: 2Vehicles involved in fatal accidents: 4Fatal accidents caused by drunken drivers: 0Fatalities: 2Persons involved in fatal accidents: 5Pedestrians involved in fatal accidents: 0
Home Mortgage Disclosure Act Aggregated Statistics For Year 2009(Based on 1 full and 4 partial tracts) A) FHA, FSA/RHS & VA B) Conventional C) Refinancings D) Home Improvement Loans E) Loans on Dwellings For 5+ Families F) Non-occupant Loans on G) Loans On Manufactured Number Average Value Number Average Value Number Average Value Number Average Value Number Average Value Number Average Value Number Average Value
LOANS ORIGINATED 48 $97,148 23 $61,822 88 $87,218 26 $20,087 1 $263,000 9 $52,772 8 $56,659 APPLICATIONS APPROVED, NOT ACCEPTED 3 $65,707 4 $41,530 13 $107,602 7 $30,987 0 $0 0 $0 3 $34,653 APPLICATIONS DENIED 15 $69,549 12 $90,587 81 $83,537 38 $21,178 0 $0 6 $33,163 9 $53,531 APPLICATIONS WITHDRAWN 7 $94,991 2 $85,780 44 $97,689 5 $24,734 0 $0 1 $133,640 0 $0 FILES CLOSED FOR INCOMPLETENESS 2 $192,020 0 $0 15 $77,113 2 $28,615 0 $0 0 $0 0 $0
Aggregated Statistics For Year 2008(Based on 1 full and 4 partial tracts) A) FHA, FSA/RHS & VA B) Conventional C) Refinancings D) Home Improvement Loans E) Loans on Dwellings For 5+ Families F) Non-occupant Loans on G) Loans On Manufactured Number Average Value Number Average Value Number Average Value Number Average Value Number Average Value Number Average Value Number Average Value
LOANS ORIGINATED 50 $75,027 54 $71,386 86 $78,215 37 $24,857 2 $232,500 11 $71,428 17 $61,032 APPLICATIONS APPROVED, NOT ACCEPTED 7 $77,841 13 $53,850 19 $91,632 10 $36,626 0 $0 2 $5,150 10 $55,574 APPLICATIONS DENIED 18 $79,006 20 $60,664 180 $83,490 62 $33,882 0 $0 8 $29,874 19 $55,741 APPLICATIONS WITHDRAWN 2 $86,210 7 $66,424 62 $87,552 6 $62,602 0 $0 4 $93,148 2 $51,510 FILES CLOSED FOR INCOMPLETENESS 2 $65,305 1 $76,000 13 $99,686 0 $0 0 $0 1 $65,000 0 $0
Aggregated Statistics For Year 2007(Based on 1 full and 4 partial tracts) A) FHA, FSA/RHS & VA B) Conventional C) Refinancings D) Home Improvement Loans E) Loans on Dwellings For 5+ Families F) Non-occupant Loans on G) Loans On Manufactured Number Average Value Number Average Value Number Average Value Number Average Value Number Average Value Number Average Value Number Average Value
LOANS ORIGINATED 44 $80,053 118 $74,421 141 $79,767 83 $25,013 2 $176,000 23 $66,675 18 $50,616 APPLICATIONS APPROVED, NOT ACCEPTED 3 $65,513 25 $58,674 32 $89,242 15 $30,355 0 $0 6 $37,553 9 $32,671 APPLICATIONS DENIED 9 $66,812 61 $55,847 206 $79,712 100 $27,916 0 $0 16 $61,706 30 $44,937 APPLICATIONS WITHDRAWN 3 $89,740 11 $81,635 115 $87,187 7 $46,083 0 $0 2 $84,415 3 $63,530 FILES CLOSED FOR INCOMPLETENESS 3 $58,950 5 $90,740 20 $92,752 2 $36,925 0 $0 3 $49,333 0 $0
Aggregated Statistics For Year 2006(Based on 1 full and 4 partial tracts) A) FHA, FSA/RHS & VA B) Conventional C) Refinancings D) Home Improvement Loans E) Loans on Dwellings For 5+ Families F) Non-occupant Loans on G) Loans On Manufactured Number Average Value Number Average Value Number Average Value Number Average Value Number Average Value Number Average Value Number Average Value
LOANS ORIGINATED 51 $86,146 113 $70,360 175 $72,088 99 $24,628 1 $165,000 23 $65,769 10 $39,497 APPLICATIONS APPROVED, NOT ACCEPTED 4 $71,995 30 $39,498 46 $80,902 21 $21,654 0 $0 4 $126,042 8 $23,240 APPLICATIONS DENIED 6 $108,918 44 $76,665 290 $81,040 134 $39,016 0 $0 22 $77,453 22 $43,904 APPLICATIONS WITHDRAWN 3 $47,327 15 $70,054 184 $84,568 14 $34,236 2 $42,000 6 $73,818 3 $50,937 FILES CLOSED FOR INCOMPLETENESS 0 $0 6 $67,452 30 $100,202 3 $42,677 0 $0 0 $0 0 $0
Aggregated Statistics For Year 2005(Based on 1 full and 4 partial tracts) A) FHA, FSA/RHS & VA B) Conventional C) Refinancings D) Home Improvement Loans E) Loans on Dwellings For 5+ Families F) Non-occupant Loans on G) Loans On Manufactured Number Average Value Number Average Value Number Average Value Number Average Value Number Average Value Number Average Value Number Average Value
LOANS ORIGINATED 34 $86,341 119 $70,516 181 $76,691 101 $21,431 0 $0 17 $57,843 12 $54,509 APPLICATIONS APPROVED, NOT ACCEPTED 0 $0 33 $51,665 41 $71,249 8 $29,208 1 $105,000 5 $47,256 12 $25,289 APPLICATIONS DENIED 12 $65,697 43 $43,423 305 $75,506 96 $27,293 0 $0 14 $50,263 38 $38,875 APPLICATIONS WITHDRAWN 7 $57,611 17 $79,795 192 $79,448 17 $79,960 0 $0 9 $88,173 6 $66,648 FILES CLOSED FOR INCOMPLETENESS 0 $0 4 $55,735 37 $107,183 5 $45,172 0 $0 1 $77,000 0 $0
Aggregated Statistics For Year 2004(Based on 1 full and 4 partial tracts) A) FHA, FSA/RHS & VA B) Conventional C) Refinancings D) Home Improvement Loans F) Non-occupant Loans on G) Loans On Manufactured Number Average Value Number Average Value Number Average Value Number Average Value Number Average Value Number Average Value
LOANS ORIGINATED 36 $88,082 125 $76,162 198 $70,204 68 $19,544 18 $56,493 15 $46,689 APPLICATIONS APPROVED, NOT ACCEPTED 2 $97,570 20 $46,884 65 $79,246 9 $21,527 7 $40,656 7 $41,774 APPLICATIONS DENIED 11 $67,062 38 $50,968 226 $69,272 68 $28,534 8 $47,324 29 $36,852 APPLICATIONS WITHDRAWN 3 $125,603 16 $59,487 169 $78,253 19 $57,771 3 $58,667 1 $47,000 FILES CLOSED FOR INCOMPLETENESS 0 $0 7 $65,131 47 $84,976 3 $37,010 0 $0 0 $0
Aggregated Statistics For Year 2003(Based on 1 full and 4 partial tracts) A) FHA, FSA/RHS & VA B) Conventional C) Refinancings D) Home Improvement Loans F) Non-occupant Loans on Number Average Value Number Average Value Number Average Value Number Average Value Number Average Value
LOANS ORIGINATED 46 $69,223 114 $73,974 402 $73,935 66 $13,811 27 $54,250 APPLICATIONS APPROVED, NOT ACCEPTED 2 $50,650 19 $54,152 63 $72,983 8 $9,166 3 $53,760 APPLICATIONS DENIED 13 $83,863 58 $46,122 301 $73,524 58 $16,102 16 $61,152 APPLICATIONS WITHDRAWN 2 $95,460 7 $71,721 152 $73,447 5 $24,076 1 $42,000 FILES CLOSED FOR INCOMPLETENESS 3 $52,277 0 $0 25 $92,907 0 $0 0 $0
Aggregated Statistics For Year 2002(Based on 1 full and 2 partial tracts) A) FHA, FSA/RHS & VA B) Conventional C) Refinancings D) Home Improvement Loans F) Non-occupant Loans on Number Average Value Number Average Value Number Average Value Number Average Value Number Average Value
LOANS ORIGINATED 40 $67,714 93 $66,145 300 $62,918 54 $15,677 20 $45,064 APPLICATIONS APPROVED, NOT ACCEPTED 2 $66,965 10 $62,459 73 $57,114 6 $28,847 3 $48,077 APPLICATIONS DENIED 5 $41,222 54 $45,413 229 $66,064 54 $13,788 3 $58,703 APPLICATIONS WITHDRAWN 4 $79,000 6 $53,038 163 $67,155 7 $23,537 4 $53,855 FILES CLOSED FOR INCOMPLETENESS 3 $60,020 3 $60,453 24 $70,265 0 $0 0 $0
Aggregated Statistics For Year 2001(Based on 1 full and 2 partial tracts) A) FHA, FSA/RHS & VA B) Conventional C) Refinancings D) Home Improvement Loans F) Non-occupant Loans on Number Average Value Number Average Value Number Average Value Number Average Value Number Average Value
LOANS ORIGINATED 35 $72,859 102 $60,990 229 $63,566 68 $11,148 21 $38,047 APPLICATIONS APPROVED, NOT ACCEPTED 2 $74,690 19 $48,726 47 $58,537 7 $12,534 1 $16,000 APPLICATIONS DENIED 5 $47,800 69 $38,643 287 $62,170 66 $17,513 12 $74,018 APPLICATIONS WITHDRAWN 3 $43,000 13 $52,842 126 $67,234 9 $29,643 2 $49,795 FILES CLOSED FOR INCOMPLETENESS 2 $56,000 2 $55,800 20 $76,897 0 $0 2 $120,190
Aggregated Statistics For Year 2000(Based on 1 full and 2 partial tracts) A) FHA, FSA/RHS & VA B) Conventional C) Refinancings D) Home Improvement Loans E) Loans on Dwellings For 5+ Families F) Non-occupant Loans on Number Average Value Number Average Value Number Average Value Number Average Value Number Average Value Number Average Value
LOANS ORIGINATED 38 $68,766 116 $54,875 128 $58,751 63 $15,966 1 $131,000 17 $41,734 APPLICATIONS APPROVED, NOT ACCEPTED 1 $82,000 21 $47,729 55 $60,291 16 $16,057 0 $0 2 $87,565 APPLICATIONS DENIED 5 $70,388 122 $35,633 246 $58,014 68 $21,050 0 $0 6 $22,273 APPLICATIONS WITHDRAWN 0 $0 16 $50,266 88 $50,836 11 $47,543 0 $0 4 $48,690 FILES CLOSED FOR INCOMPLETENESS 4 $61,298 2 $34,340 15 $80,777 0 $0 0 $0 0 $0
Aggregated Statistics For Year 1999(Based on 1 full and 1 partial tracts) A) FHA, FSA/RHS & VA B) Conventional C) Refinancings D) Home Improvement Loans F) Non-occupant Loans on Number Average Value Number Average Value Number Average Value Number Average Value Number Average Value
LOANS ORIGINATED 45 $63,447 85 $46,588 121 $54,620 56 $19,843 8 $45,445 APPLICATIONS APPROVED, NOT ACCEPTED 0 $0 7 $34,429 58 $53,226 21 $22,379 2 $104,500 APPLICATIONS DENIED 7 $57,201 57 $32,939 139 $50,118 69 $16,523 7 $37,084 APPLICATIONS WITHDRAWN 4 $51,750 8 $57,774 52 $56,246 13 $47,801 1 $95,000 FILES CLOSED FOR INCOMPLETENESS 0 $0 2 $36,520 21 $61,405 1 $18,000 1 $24,040
Detailed HMDA statistics for the following Tracts:
0406.00
,
0407.00 ,
4010.02
Private Mortgage Insurance Companies Aggregated Statistics For Year 2009(Based on 1 full and 4 partial tracts) A) Conventional B) Refinancings Number Average Value Number Average Value
LOANS ORIGINATED 3 $46,450 4 $75,980 APPLICATIONS APPROVED, NOT ACCEPTED 2 $71,310 1 $140,460 APPLICATIONS DENIED 2 $78,765 2 $72,970 APPLICATIONS WITHDRAWN 0 $0 2 $67,820 FILES CLOSED FOR INCOMPLETENESS 0 $0 0 $0
Aggregated Statistics For Year 2008(Based on 1 full and 4 partial tracts) A) Conventional B) Refinancings C) Non-occupant Loans on Number Average Value Number Average Value Number Average Value
LOANS ORIGINATED 25 $78,452 10 $120,577 4 $54,245 APPLICATIONS APPROVED, NOT ACCEPTED 4 $57,732 3 $106,090 0 $0 APPLICATIONS DENIED 9 $71,613 0 $0 2 $60,095 APPLICATIONS WITHDRAWN 0 $0 0 $0 0 $0 FILES CLOSED FOR INCOMPLETENESS 2 $60,095 0 $0 2 $60,095
Aggregated Statistics For Year 2007(Based on 1 full and 4 partial tracts) A) Conventional B) Refinancings C) Non-occupant Loans on Number Average Value Number Average Value Number Average Value
LOANS ORIGINATED 39 $81,331 16 $128,598 4 $90,095 APPLICATIONS APPROVED, NOT ACCEPTED 4 $69,202 10 $82,820 3 $82,190 APPLICATIONS DENIED 0 $0 0 $0 0 $0 APPLICATIONS WITHDRAWN 4 $114,940 5 $114,664 0 $0 FILES CLOSED FOR INCOMPLETENESS 0 $0 0 $0 0 $0
Aggregated Statistics For Year 2006(Based on 1 full and 4 partial tracts) A) Conventional B) Refinancings C) Non-occupant Loans on Number Average Value Number Average Value Number Average Value
LOANS ORIGINATED 32 $69,381 17 $119,951 4 $79,270 APPLICATIONS APPROVED, NOT ACCEPTED 0 $0 4 $170,590 0 $0 APPLICATIONS DENIED 0 $0 0 $0 0 $0 APPLICATIONS WITHDRAWN 2 $51,000 2 $111,605 0 $0 FILES CLOSED FOR INCOMPLETENESS 0 $0 0 $0 0 $0
Aggregated Statistics For Year 2005(Based on 1 full and 4 partial tracts) A) Conventional B) Refinancings C) Non-occupant Loans on Number Average Value Number Average Value Number Average Value
LOANS ORIGINATED 37 $76,751 32 $100,558 5 $100,670 APPLICATIONS APPROVED, NOT ACCEPTED 7 $51,154 7 $153,141 0 $0 APPLICATIONS DENIED 1 $59,000 0 $0 0 $0 APPLICATIONS WITHDRAWN 0 $0 0 $0 0 $0 FILES CLOSED FOR INCOMPLETENESS 0 $0 0 $0 0 $0
Aggregated Statistics For Year 2004(Based on 1 full and 4 partial tracts) A) Conventional B) Refinancings C) Non-occupant Loans on Number Average Value Number Average Value Number Average Value
LOANS ORIGINATED 47 $73,860 18 $87,187 5 $55,000 APPLICATIONS APPROVED, NOT ACCEPTED 7 $73,553 10 $102,525 0 $0 APPLICATIONS DENIED 0 $0 0 $0 0 $0 APPLICATIONS WITHDRAWN 3 $84,667 3 $60,197 0 $0 FILES CLOSED FOR INCOMPLETENESS 0 $0 2 $81,555 0 $0
Aggregated Statistics For Year 2003(Based on 1 full and 4 partial tracts) A) Conventional B) Refinancings C) Non-occupant Loans on Number Average Value Number Average Value Number Average Value
LOANS ORIGINATED 50 $80,944 71 $87,093 0 $0 APPLICATIONS APPROVED, NOT ACCEPTED 4 $82,360 18 $96,227 1 $32,220 APPLICATIONS DENIED 0 $0 3 $92,717 0 $0 APPLICATIONS WITHDRAWN 1 $30,000 0 $0 0 $0 FILES CLOSED FOR INCOMPLETENESS 0 $0 0 $0 0 $0
Aggregated Statistics For Year 2002(Based on 1 full and 2 partial tracts) A) Conventional B) Refinancings C) Non-occupant Loans on Number Average Value Number Average Value Number Average Value
LOANS ORIGINATED 40 $77,949 33 $82,572 4 $34,500 APPLICATIONS APPROVED, NOT ACCEPTED 4 $60,250 10 $75,970 2 $35,500 APPLICATIONS DENIED 1 $58,000 2 $76,000 0 $0 APPLICATIONS WITHDRAWN 2 $61,810 4 $64,190 0 $0 FILES CLOSED FOR INCOMPLETENESS 0 $0 0 $0 0 $0
Aggregated Statistics For Year 2001(Based on 1 full and 2 partial tracts) A) Conventional B) Refinancings C) Non-occupant Loans on Number Average Value Number Average Value Number Average Value
LOANS ORIGINATED 37 $60,688 30 $82,465 2 $46,500 APPLICATIONS APPROVED, NOT ACCEPTED 4 $68,780 4 $94,388 1 $44,000 APPLICATIONS DENIED 3 $78,920 5 $73,608 3 $39,000 APPLICATIONS WITHDRAWN 0 $0 3 $103,020 0 $0 FILES CLOSED FOR INCOMPLETENESS 0 $0 0 $0 0 $0
Aggregated Statistics For Year 2000(Based on 1 full and 2 partial tracts) A) Conventional B) Refinancings C) Non-occupant Loans on Number Average Value Number Average Value Number Average Value
LOANS ORIGINATED 29 $71,014 15 $112,231 1 $33,000 APPLICATIONS APPROVED, NOT ACCEPTED 7 $86,193 2 $116,755 0 $0 APPLICATIONS DENIED 2 $55,800 0 $0 0 $0 APPLICATIONS WITHDRAWN 0 $0 0 $0 0 $0 FILES CLOSED FOR INCOMPLETENESS 0 $0 0 $0 0 $0
Aggregated Statistics For Year 1999(Based on 1 full and 1 partial tracts) A) Conventional B) Refinancings Number Average Value Number Average Value
LOANS ORIGINATED 21 $67,546 6 $67,665 APPLICATIONS APPROVED, NOT ACCEPTED 2 $31,315 2 $62,250 APPLICATIONS DENIED 1 $39,000 0 $0 APPLICATIONS WITHDRAWN 0 $0 0 $0 FILES CLOSED FOR INCOMPLETENESS 0 $0 0 $0
Detailed PMIC statistics for the following Tracts:
0406.00
,
0407.00 ,
4010.02
2002 - 2018 National Fire Incident Reporting System (NFIRS) incidents See full 2006 National Fire Incident Reporting System statistics for zip code 14411, New York
Most common first names in zip code 14411 among deceased individuals Name Count Lived (average)
John 118 73.2 years Mary 112 82.4 years William 91 75.9 years Charles 78 76.2 years Robert 65 70.9 years Helen 63 81.5 years George 60 76.0 years Edward 58 73.9 years James 57 70.5 years Dorothy 53 79.7 years
Most common last names in zip code 14411 among deceased individuals Last name Count Lived (average)
Smith 47 74.4 years Miller 40 74.6 years Monacelli 30 79.5 years Clark 30 73.7 years Johnson 20 80.4 years Brown 18 77.5 years Moore 18 74.2 years Jones 17 70.1 years Allen 17 75.5 years Thompson 16 72.5 years
Businesses in zip code 14411
Name Count Name Count
Ace Hardware 1 McDonald's 1 AutoZone 1 Rite Aid 1 Burger King 1 Tim Hortons 1 Chevrolet 1 True Value 1 Cold Stone Creamery 1 U-Haul 1 GNC 1 UPS 1 H&R Block 1 Walmart 1
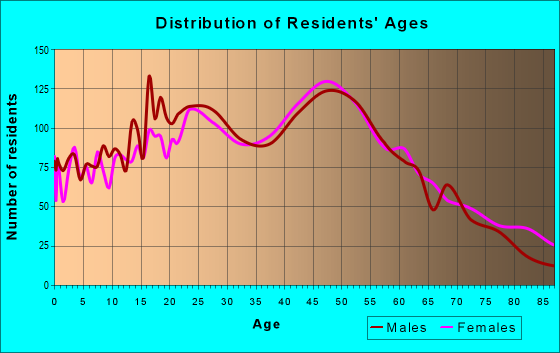
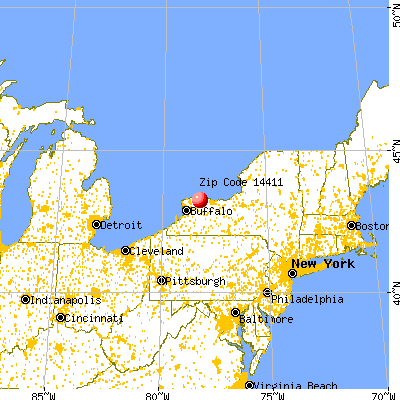


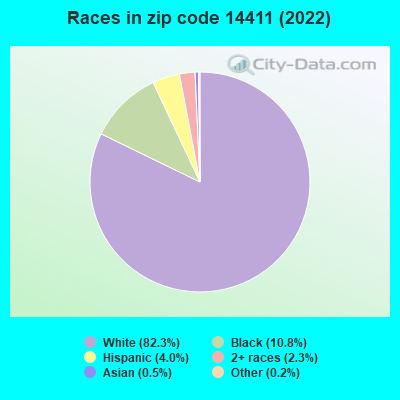


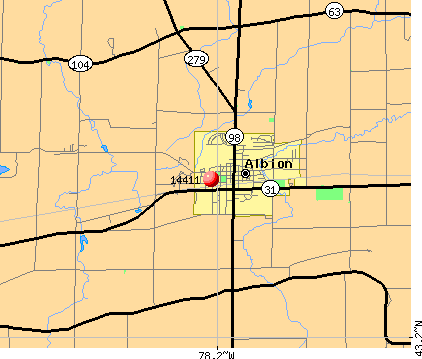 Nearest zip codes: 14479, 14571, 14477, 14058, 14470, 14125.
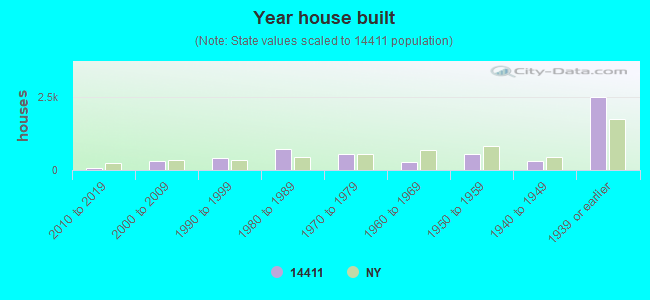

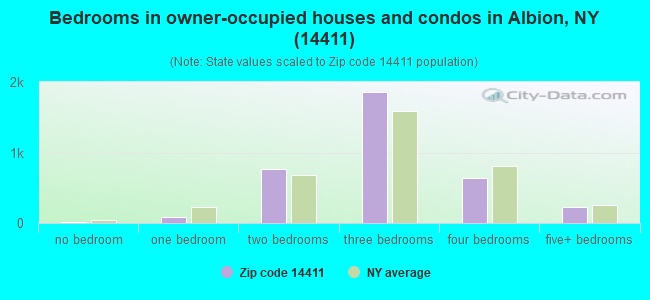
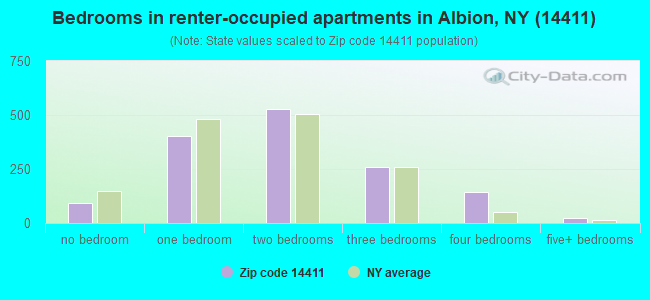
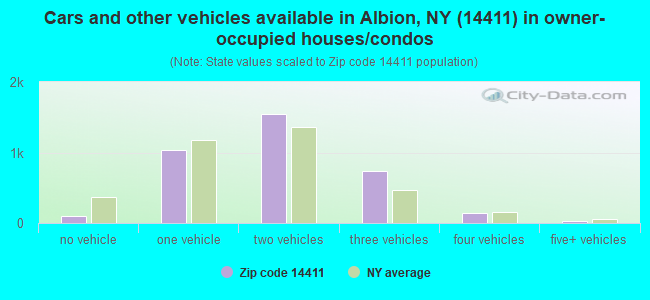
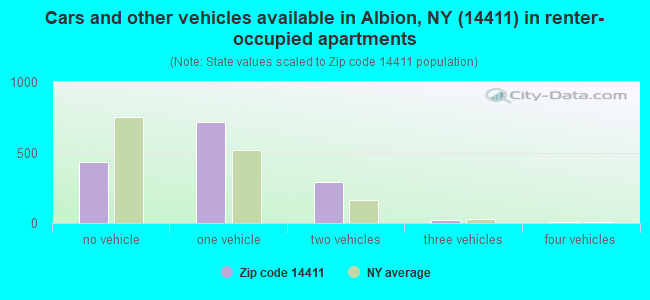


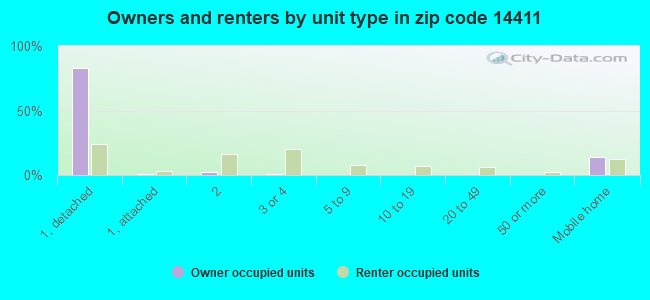
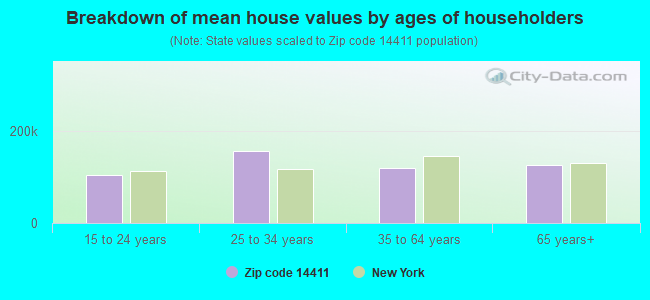


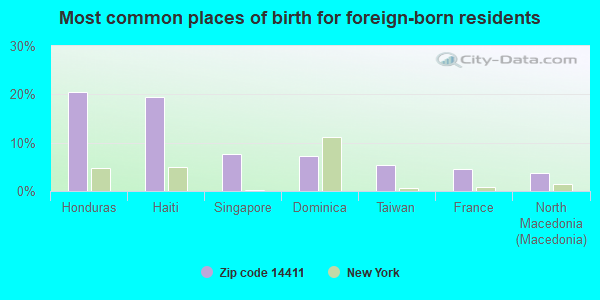
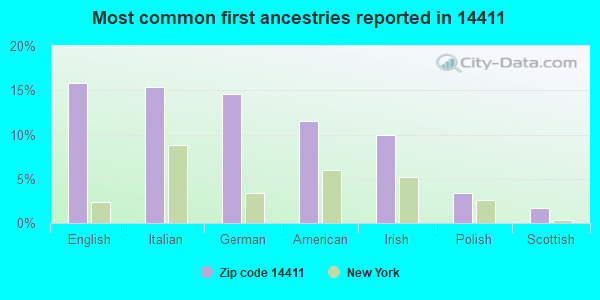

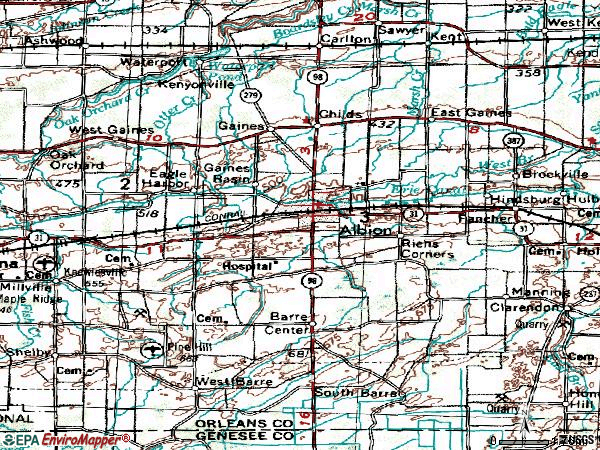

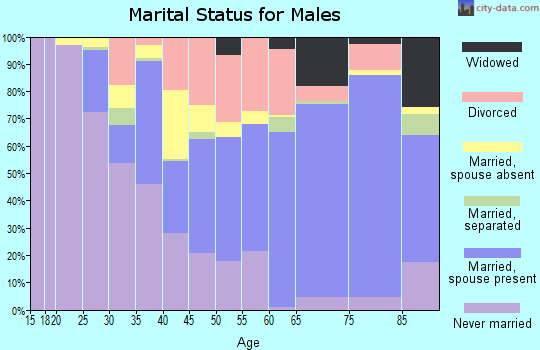
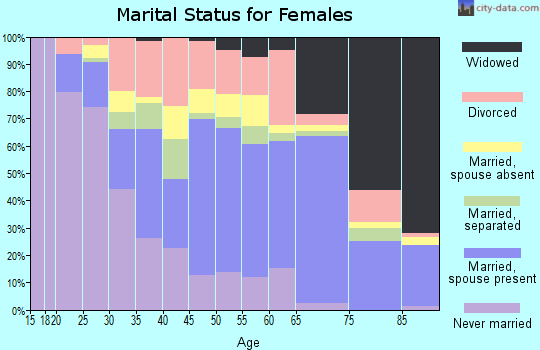
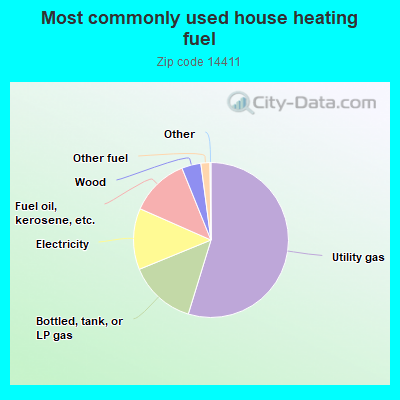
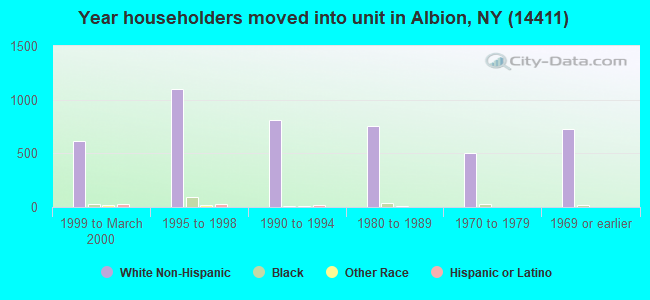
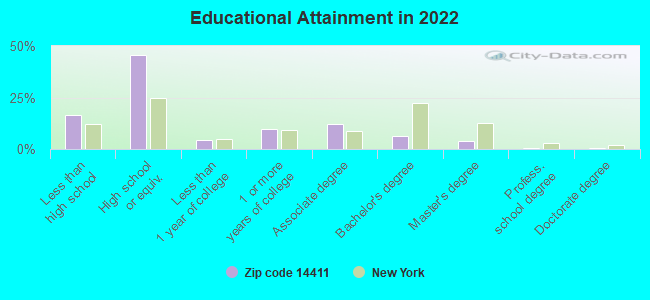
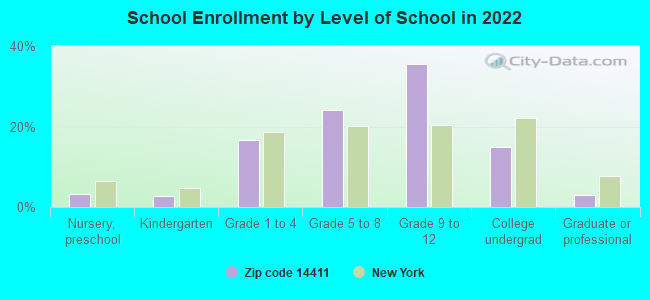
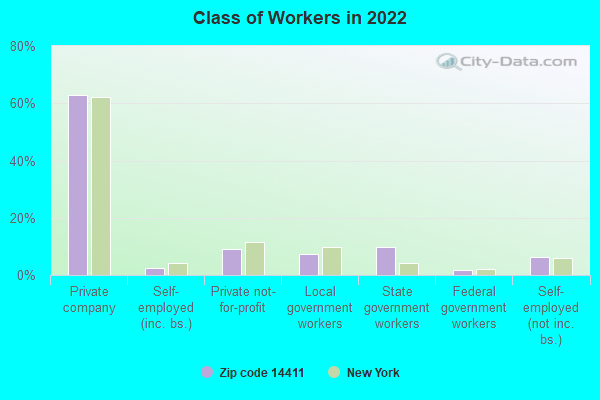
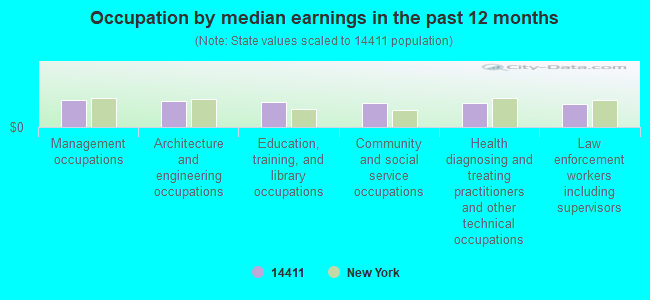
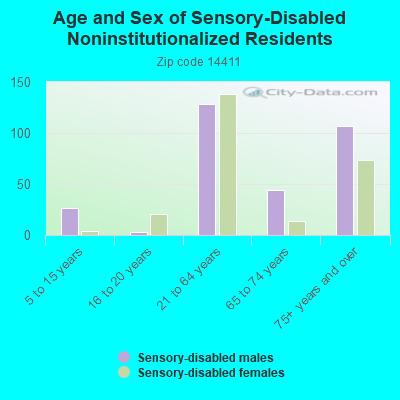
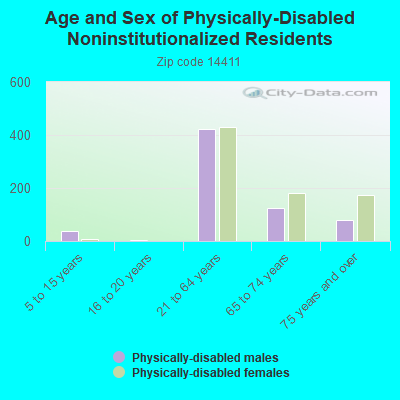
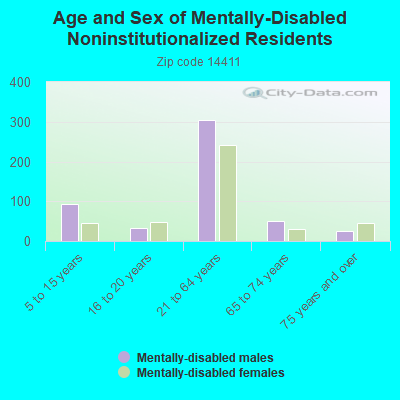
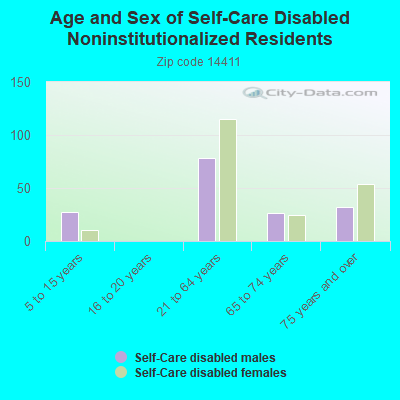
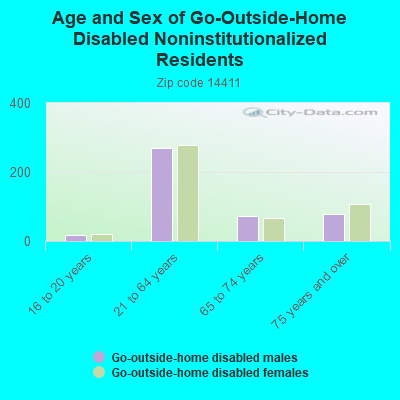
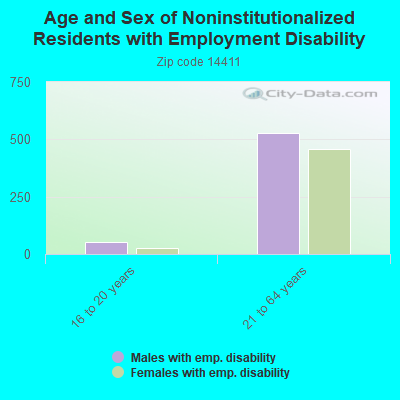
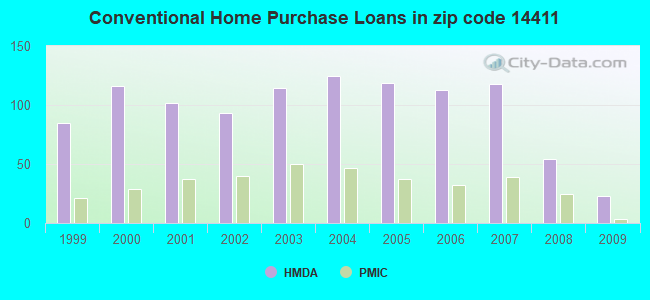
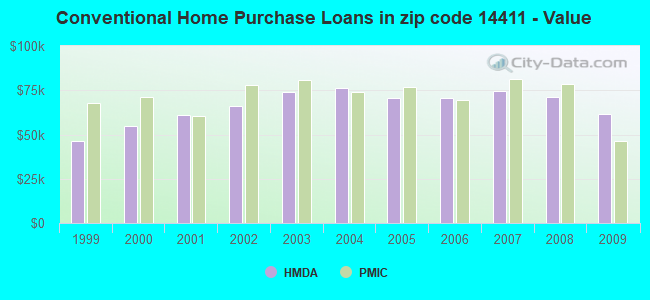
 Based on the data from the years 2002 - 2018 the average number of fires per year is 59. The highest number of fires - 84 took place in 2007, and the least - 14 in 2010. The data has a decreasing trend.
 When looking into fire subcategories, the most incidents belonged to: Structure Fires (45.8%), and Outside Fires (26.3%).