Estimated zip code population in 2022: 2,369 Zip code population in 2010: 2,285 Zip code population in 2000: 2,325
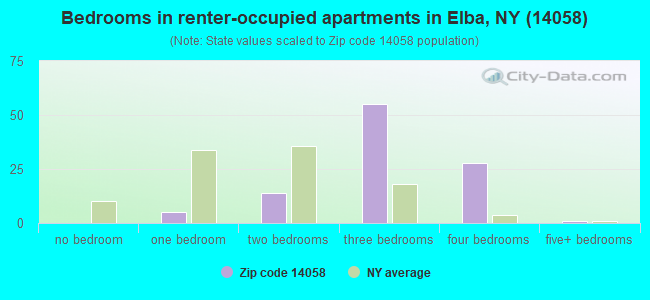
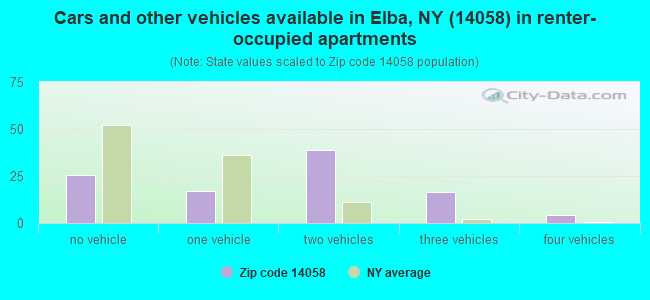
Houses and condos: 893 Renter-occupied apartments: 103
% of renters here:
13%
State:
46%
March 2022 cost of living index in zip code 14058: 94.2 (less than average, U.S. average is 100)
Land area: 39.8 sq. mi. Water area: 0.0 sq. mi.
Population density: 59 people per square mile
(very low).
OSM Map
General Map
Google Map
MSN Map
OSM Map
General Map
Google Map
MSN Map
OSM Map
General Map
Google Map
MSN Map
OSM Map
General Map
Google Map
MSN Map
Please wait while loading the map...
Real estate property taxes paid for housing units in 2022:
This zip code:
2.2% ($3,376)
New York:
1.5% ($6,180)
Median real estate property taxes paid for housing units with mortgages in 2022: $3,632 (2.1%) Median real estate property taxes paid for housing units with no mortgage in 2022: $3,118 (2.3%)
Business Search- 14 Million verified businesses
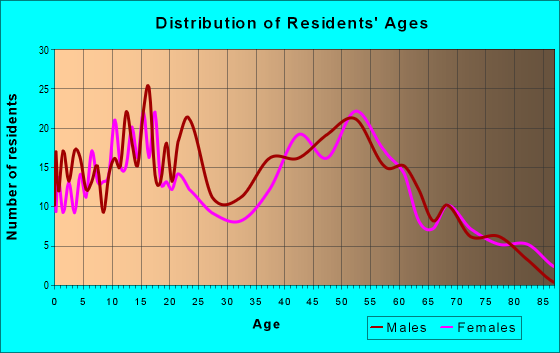
Males: 1,225
(51.7%)
Females: 1,144
(48.3%)
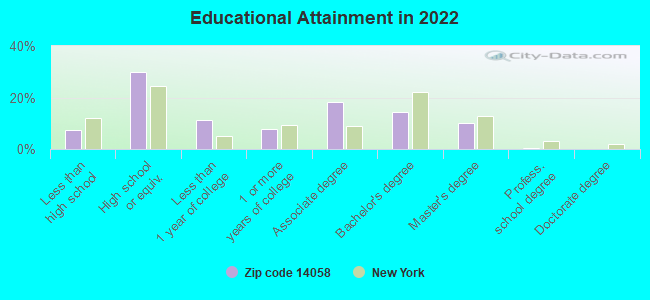
For population 25 years and over in 14058:
High school or higher: 92.5%
Bachelor's degree or higher: 25.3%
Graduate or professional degree: 10.8%
Unemployed: 8.1%
Mean travel time to work (commute): 22.6 minutes
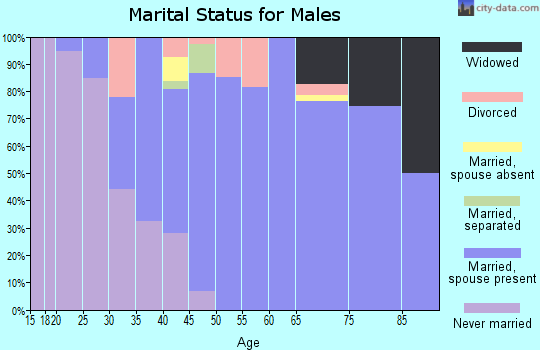
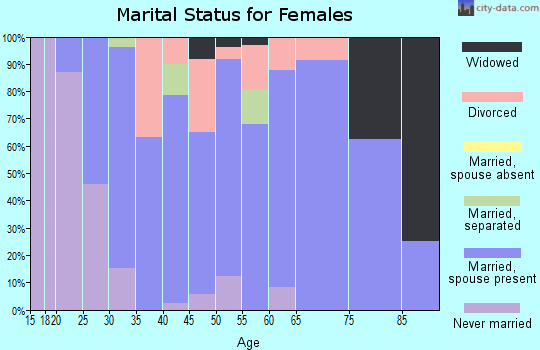
For population 15 years and over in 14058:
Never married: 23.4%
Now married: 63.4%
Separated: 0.5%
Widowed: 4.6%
Divorced: 8.1%
Zip code 14058 compared to state average:
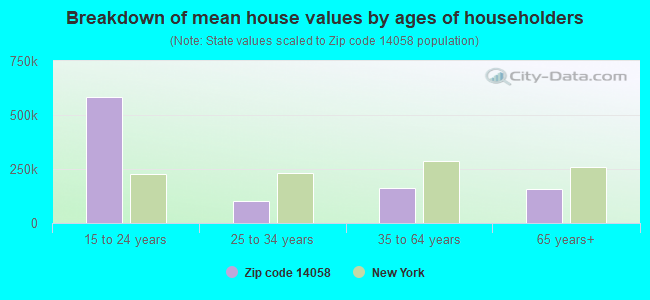
Median house value significantly below state average.
Black race population percentage significantly below state average.
Median age below state average.
Foreign-born population percentage significantly below state average.
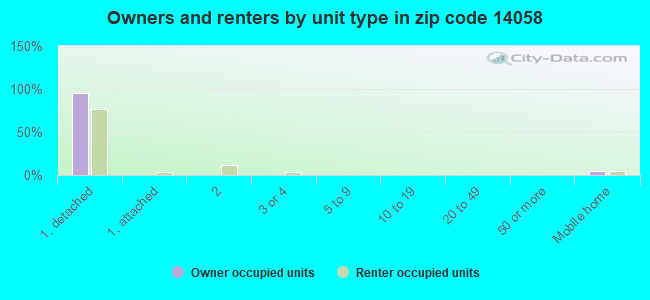
Renting percentage significantly below state average.
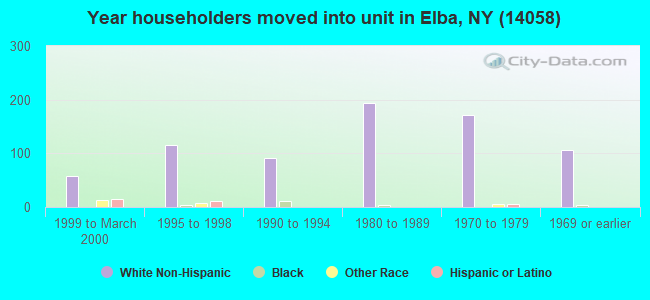
Length of stay since moving in significantly above state average.
Number of rooms per house above state average.
Number of college students below state average.
Percentage of population with a bachelor's degree or higher below state average.
Averages for the 2020 tax year for zip code 14058, filed in 2021:
Average Adjusted Gross Income (AGI) in 2020: $60,298 (Individual Income Tax Returns)
Here:
$60,298
State:
$90,930
Salary/wage: $50,545 (reported on 83.3% of returns)
Here:
$50,545
State:
$72,104
(% of AGI for various income ranges: 1141.1% for AGIs below $25k, 3651.8% for AGIs $25k-50k, 6450.0% for AGIs $50k-75k, 9438.0% for AGIs $75k-100k, 16724.4% for AGIs $100k-200k)
Taxable interest for individuals: $500 (reported on 40.2% of returns)
This zip code:
$500
New York:
$3,075
(% of AGI for various income ranges: 17.8% for AGIs below $25k, 17.3% for AGIs $25k-50k, 10.0% for AGIs $50k-75k, 54.0% for AGIs $75k-100k, 75.6% for AGIs $100k-200k)
Ordinary dividends: $4,353 (reported on 18.6% of returns)
Here:
$4,353
State:
$11,095
(% of AGI for various income ranges: 29.4% for AGIs below $25k, 33.6% for AGIs $25k-50k, 67.7% for AGIs $50k-75k, 107.0% for AGIs $75k-100k, 561.1% for AGIs $100k-200k)
Net capital gain/loss in AGI: +$4,550 (reported on 15.7% of returns)
Here:
+$4,550
State:
+$44,925
(% of AGI for various income ranges: 31.1% for AGIs below $25k, 25.9% for AGIs $25k-50k, 50.8% for AGIs $50k-75k, 104.0% for AGIs $75k-100k, 494.4% for AGIs $100k-200k)
Profit/loss from business: +$8,064 (reported on 10.8% of returns)
Here:
+$8,064
State:
+$14,940
(% of AGI for various income ranges: 52.8% for AGIs below $25k, 188.5% for AGIs $50k-75k, 50.0% for AGIs $75k-100k, 552.2% for AGIs $100k-200k)
Taxable individual retirement arrangement distribution: $13,162 (reported on 12.7% of returns)
14058:
$13,162
New York:
$19,609
(% of AGI for various income ranges: 46.1% for AGIs below $25k, 155.5% for AGIs $25k-50k, 292.3% for AGIs $50k-75k, 419.0% for AGIs $75k-100k, 541.1% for AGIs $100k-200k)
Total itemized deductions: $23,967 (reported on 2.9% of returns)
Here:
$23,967
State:
$39,326
(% of AGI for various income ranges: 553.1% for AGIs $50k-75k)
Charity contributions: $8,050 (reported on 2.0% of returns)
Here:
$8,050
State:
$15,420
(% of AGI for various income ranges: 73.2% for AGIs $25k-50k)
Taxes paid: $5,467 (reported on 2.9% of returns)
14058:
$5,467
State:
$9,183
(% of AGI for various income ranges: 126.2% for AGIs $50k-75k)
Earned income credit: $1,642 (reported on 11.8% of returns)
Here:
$1,642
State:
$2,138
(% of AGI for various income ranges: 52.8% for AGIs below $25k, 46.4% for AGIs $25k-50k)
Percentage of individuals using paid preparers for their 2020 taxes: 95.1%
Here:
95%
State:
95%
(% for various income ranges: 96.3% for AGIs below $25k, 92.9% for AGIs $25k-50k, 94.4% for AGIs $50k-75k, 100.0% for AGIs $75k-100k, 92.3% for AGIs $100k-200k, 100.0% for AGIs over 200k)
Averages for the 2012 tax year for zip code 14058, filed in 2013:
Average Adjusted Gross Income (AGI) in 2012: $49,457 (Individual Income Tax Returns)
Here:
$49,457
State:
$77,088
Salary/wage: $42,327 (reported on 87.9% of returns)
Here:
$42,327
State:
$60,593
(% of AGI for various income ranges: 81.7% for AGIs below $25k, 77.5% for AGIs $25k-50k, 75.5% for AGIs $50k-75k, 79.5% for AGIs $75k-100k, 68.4% for AGIs $100k-200k)
Taxable interest for individuals: $437 (reported on 43.0% of returns)
This zip code:
$437
New York:
$3,125
(% of AGI for various income ranges: 0.8% for AGIs below $25k, 0.3% for AGIs $25k-50k, 0.3% for AGIs $50k-75k, 0.3% for AGIs $75k-100k, 0.5% for AGIs $100k-200k)
Ordinary dividends: $2,522 (reported on 21.5% of returns)
Here:
$2,522
State:
$10,299
(% of AGI for various income ranges: 1.4% for AGIs below $25k, 1.3% for AGIs $25k-50k, 1.0% for AGIs $50k-75k, 1.0% for AGIs $75k-100k, 1.1% for AGIs $100k-200k)
Net capital gain/loss in AGI: +$3,393 (reported on 13.1% of returns)
Here:
+$3,393
State:
+$42,474
(% of AGI for various income ranges: 0.7% for AGIs $25k-50k, 0.1% for AGIs $50k-75k, 2.6% for AGIs $100k-200k)
Profit/loss from business: +$6,018 (reported on 10.3% of returns)
Here:
+$6,018
State:
+$16,168
(% of AGI for various income ranges: 2.9% for AGIs below $25k, 2.0% for AGIs $25k-50k, 0.9% for AGIs $50k-75k, 2.0% for AGIs $75k-100k)
Taxable individual retirement arrangement distribution: $9,087 (reported on 14.0% of returns)
14058:
$9,087
New York:
$17,621
(% of AGI for various income ranges: 3.4% for AGIs below $25k, 2.7% for AGIs $25k-50k, 4.1% for AGIs $50k-75k, 4.1% for AGIs $75k-100k)
Total itemized deductions: $18,658 (21% of AGI, reported on 24.3% of returns)
Here:
$18,658
State:
$34,985
Here:
20.9% of AGI
State:
21.3% of AGI
(% of AGI for various income ranges: 6.2% for AGIs $25k-50k, 7.7% for AGIs $50k-75k, 9.0% for AGIs $75k-100k, 15.1% for AGIs $100k-200k)
Charity contributions: $3,100 (reported on 18.7% of returns)
Here:
$3,100
State:
$5,572
(% of AGI for various income ranges: 0.5% for AGIs $25k-50k, 1.2% for AGIs $50k-75k, 1.2% for AGIs $75k-100k, 1.9% for AGIs $100k-200k)
Taxes paid: $8,492 (reported on 24.3% of returns)
14058:
$8,492
State:
$18,656
(% of AGI for various income ranges: 2.3% for AGIs $25k-50k, 3.1% for AGIs $50k-75k, 3.6% for AGIs $75k-100k, 7.8% for AGIs $100k-200k)
Earned income credit: $2,262 (reported on 12.1% of returns)
Here:
$2,262
State:
$2,230
(% of AGI for various income ranges: 4.3% for AGIs below $25k, 0.9% for AGIs $25k-50k)
Percentage of individuals using paid preparers for their 2012 taxes: 67.3%
Here:
67%
State:
66%
(% for various income ranges: 60.5% for AGIs below $25k, 66.7% for AGIs $25k-50k, 73.7% for AGIs $50k-75k, 69.2% for AGIs $75k-100k, 80.0% for AGIs $100k-200k)
Averages for the 2004 tax year for zip code 14058, filed in 2005:
Average Adjusted Gross Income (AGI) in 2004: $40,805 (Individual Income Tax Returns)
Here:
$40,805
State:
$59,519
Salary/wage: $35,631 (reported on 88.3% of returns)
Here:
$35,631
State:
$50,673
(% of AGI for various income ranges: 91.3% for AGIs below $10k, 77.7% for AGIs $10k-25k, 84.7% for AGIs $25k-50k, 82.1% for AGIs $50k-75k, 84.7% for AGIs $75k-100k, 55.2% for AGIs over 100k)
Taxable interest for individuals: $519 (reported on 53.5% of returns)
This zip code:
$519
New York:
$2,377
(% of AGI for various income ranges: 2.6% for AGIs below $10k, 1.0% for AGIs $10k-25k, 0.9% for AGIs $25k-50k, 0.3% for AGIs $50k-75k, 0.4% for AGIs $75k-100k, 0.8% for AGIs over 100k)
Taxable dividends: $1,325 (reported on 29.1% of returns)
Here:
$1,325
State:
$5,394
(% of AGI for various income ranges: 3.3% for AGIs below $10k, 1.7% for AGIs $10k-25k, 0.9% for AGIs $25k-50k, 0.6% for AGIs $50k-75k, 0.5% for AGIs $75k-100k, 1.2% for AGIs over 100k)
Net capital gain/loss: +$2,648 (reported on 17.2% of returns)
Here:
+$2,648
State:
+$23,581
(% of AGI for various income ranges: -0.1% for AGIs below $10k, -0.0% for AGIs $10k-25k, 0.8% for AGIs $25k-50k, -0.1% for AGIs $50k-75k, -0.1% for AGIs $75k-100k, 4.4% for AGIs over 100k)
Profit/loss from business: +$6,172 (reported on 12.1% of returns)
Here:
+$6,172
State:
+$13,809
(% of AGI for various income ranges: 5.0% for AGIs below $10k, 1.0% for AGIs $10k-25k, 2.5% for AGIs $25k-50k, 2.5% for AGIs $50k-75k, 2.3% for AGIs $75k-100k)
Profit/loss from farming: +$2,692 (reported on 1.2% of returns)
Here:
+$2,692
State:
-$2,666
IRA payment deduction: $3,138 (reported on 2.7% of returns)
14058:
$3,138
New York:
$3,115
Total itemized deductions: $15,003 (21% of AGI, reported on 28.8% of returns)
Here:
$15,003
State:
$25,864
Here:
20.5% of AGI
State:
21.9% of AGI
(% of AGI for various income ranges: 8.7% for AGIs $10k-25k, 9.3% for AGIs $25k-50k, 10.6% for AGIs $50k-75k, 13.2% for AGIs $75k-100k, 11.9% for AGIs over 100k)
Charity contributions deductions: $1,889 (3% of AGI, reported on 25.6% of returns)
Here:
$1,889
State:
$4,439
Here:
2.6% of AGI
State:
3.6% of AGI
(% of AGI for various income ranges: 0.9% for AGIs $10k-25k, 1.3% for AGIs $25k-50k, 1.1% for AGIs $50k-75k, 1.6% for AGIs $75k-100k, 1.1% for AGIs over 100k)
Total tax: $5,241 (reported on 76.8% of returns)
14058:
$5,241
State:
$11,730
(% of AGI for various income ranges: 2.4% for AGIs below $10k, 4.2% for AGIs $10k-25k, 6.3% for AGIs $25k-50k, 8.4% for AGIs $50k-75k, 9.9% for AGIs $75k-100k, 18.8% for AGIs over 100k)
Earned income credit: $1,565 (reported on 12.4% of returns)
Here:
$1,565
State:
$1,757
Percentage of individuals using paid preparers for their 2004 taxes: 63.6%
Here:
64%
State:
67%
(% for various income ranges: 54.5% for AGIs below $10k, 63.9% for AGIs $10k-25k, 63.3% for AGIs $25k-50k, 72.1% for AGIs $50k-75k, 68.7% for AGIs $75k-100k, 62.0% for AGIs over 100k)
Household received Food Stamps/SNAP in the past 12 months: 29 Household did not receive Food Stamps/SNAP in the past 12 months: 779
Women who had a birth in the past 12 months: 33 (25 now married, 8 unmarried) Women who did not have a birth in the past 12 months: 381 (227 now married, 149 unmarried)
Housing units in zip code 14058 with a mortgage: 423 (96 second mortgage, 97 both second mortgage and home equity loan) Houses without a mortgage: 59
Median monthly owner costs for units with a mortgage: $1,376 Median monthly owner costs for units without a mortgage: $571
Residents with income below the poverty level in 2022:
This zip code:
6.8%
Whole state:
14.3%
Residents with income below 50% of the poverty level in 2022:
This zip code:
3.5%
Whole state:
6.8%
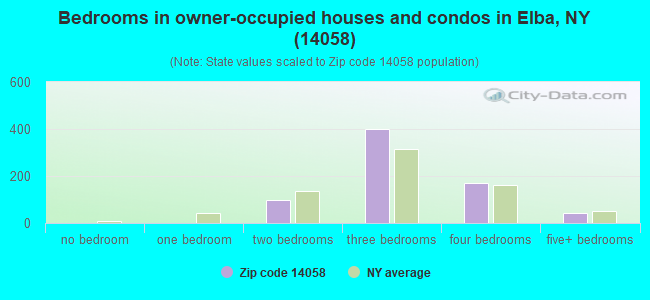
Median number of rooms in houses and condos:
Here:
6.8
State:
6.3
Median number of rooms in apartments:
Here:
6.2
State:
3.8
Notable locations in this zip code not listed on our city pages
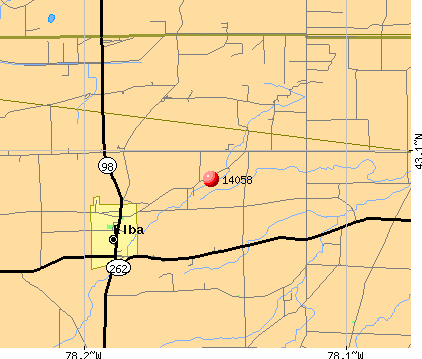
Notable locations in zip code 14058: Porter Farm (A), Big O Farms (B), Triple G Farms (C), Angevine Farms (D), Elba Village Wastewater Treatment Plant (E), Elba Fire Department (F). Display/hide their locations on the map
Churches in zip code 14058 include: Church of Brotherly Love (A), First Baptist Church (B), First Presbyterian Church (C), Our Lady of Fatima Church (D), Elba United Methodist Church (E). Display/hide their locations on the map
In group quarters: 3 (-1 institutionalized population)
Size of family households: 284 2-persons, 121 3-persons, 66 4-persons, 97 5-persons, 17 6-persons, 20 7-or-more-persons
Size of nonfamily households: 171 1-person, 33 2-persons, 4 4-persons
548 married couples with children.
116 single-parent households (17 men, 99 women).
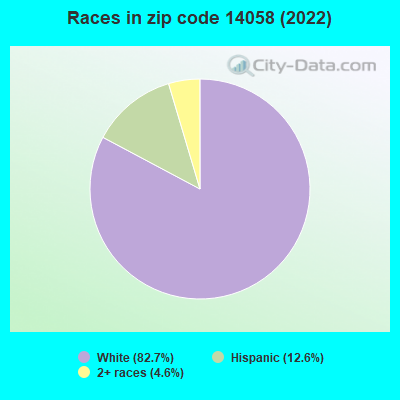
90.1% of residents of 14058 zip code speak English at home.
8.7% of residents speak Spanish at home (34% very well, 39% well, 28% not well).
0.5% of residents speak other Indo-European language at home (55% very well, 45% well).
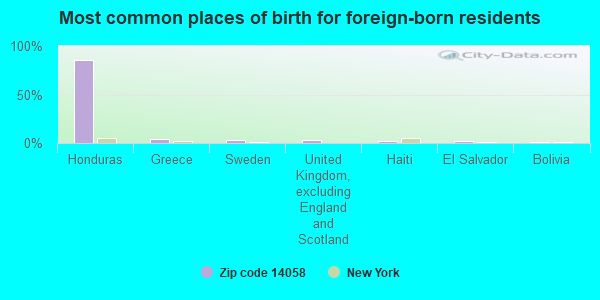
Foreign born population: 111 (4.7%) (9.0% of them are naturalized citizens)
This zip code:
4.7%
Whole state:
22.7%
86%Honduras
4%Greece
3%Sweden
3%United Kingdom, excluding England and Scotland
2%Haiti
2%El Salvador
1%Bolivia
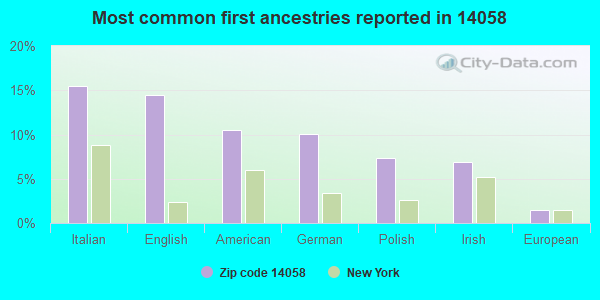
15%Italian
14%English
10%American
10%German
7%Polish
7%Irish
1%European
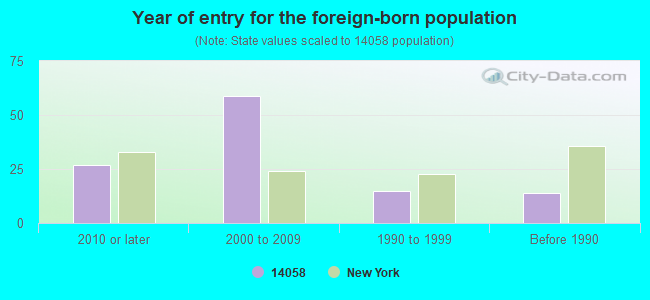
Year of entry for the foreign-born population
272010 or later
592000 to 2009
151990 to 1999
14Before 1990
Facilities with environmental interests located in this zip code:
STATE MASTER (New York facility tracking) - National Pollutant Discharge Elimination System Permit National Pollutant Discharge Elimination System NON-MAJOR (Tracking pollutant discharge elimination systems) - permit Business SIC classification: GENERAL FARMS, PRIMARILY LIVESTOCK AND ANIMAL SPECIALTIES Organizations: AGWAY, INC. (CONTACT/OWNER)
, AGWAY INC (LEGALLY RESPONSIBLE PARTY)
Alternative names: A.J. WORMUTH
ANGLER SPORT GROUP (6619 OAK ORCHARD RD in ELBA, NY)
Conditionally Exempt Small Quantity Generators, less than 100 kg/month of hazardous waste (Resource Conservation and Recovery Act (tracking hazardous waste)) - notification Organizations: PAUL BETTERS (CONTACT/OWNER)
Housing units lacking complete plumbing facilities: 2.0% Housing units lacking complete kitchen facilities: 2.6%
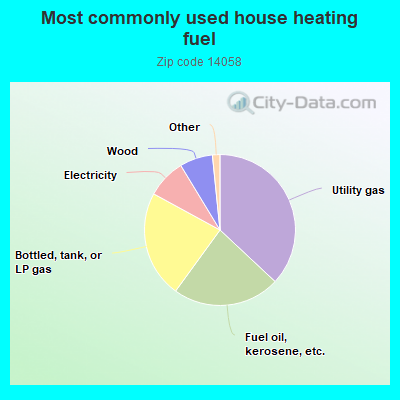
37.1%Utility gas
23.1%Fuel oil, kerosene, etc.
23.0%Bottled, tank, or LP gas
8.4%Electricity
7.1%Wood
0.9%Other fuel
0.6%Coal or coke
Population in 1990: 2,331.
Place of birth for U.S.-born residents:
This state: 2,108
Northeast: 49
Midwest: 29
South: 33
West: 22
75% of the 14058 zip code residents lived in the same house 5 years ago. Out of people who lived in different houses, 72% lived in this county. Out of people who lived in different counties, 50% lived in New York.
97% of the 14058 zip code residents lived in the same house 1 year ago. Out of people who lived in different houses, 36% moved from this county. Out of people who lived in different houses, 55% moved from different county within same state. Out of people who lived in different houses, 5% moved from different state.
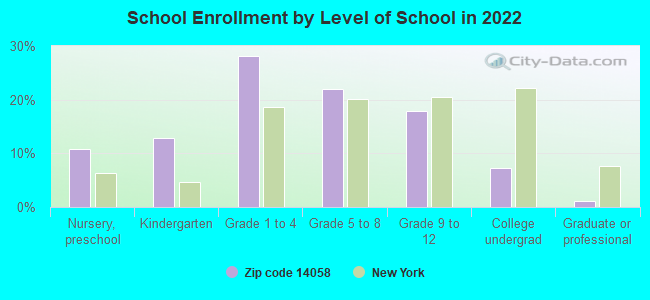
Private vs. public school enrollment:
Students in private schools in grades 1 to 8 (elementary and middle school): 87
Here:
27.7%
New York:
15.6%
Students in private schools in grades 9 to 12 (high school): 40
Here:
35.8%
New York:
15.0%
Students in private undergraduate colleges:
Here:
0.0%
New York:
39.2%
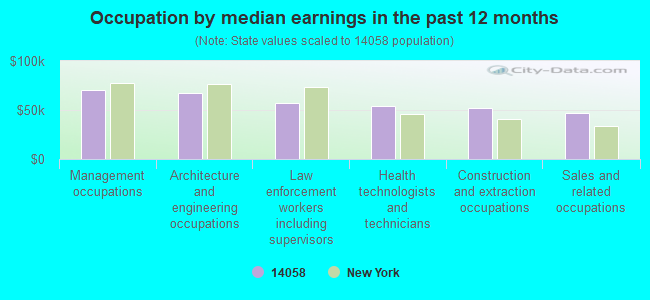
Occupation by median earnings in the past 12 months ($)
69,986Management occupations
67,399Architecture and engineering occupations
56,937Law enforcement workers including supervisors
54,204Health technologists and technicians
51,770Construction and extraction occupations
47,423Sales and related occupations
Top industries in this zip code by the number of employees in 2005:
Health Care and Social Assistance: Services for the Elderly and Persons with Disabilities (50-99 employees: 1 establishment)
Accommodation and Food Services: Full-Service Restaurants (10-19: 1, 5-9: 1)
Wholesale Trade: Fresh Fruit and Vegetable Merchant Wholesalers (10-19: 1, 1-4: 2)
Wholesale Trade: Sporting and Recreational Goods and Supplies Merchant Wholesalers (10-19: 1)
Other Services (except Public Administration): Religious Organizations (5-9: 1, 1-4: 2)
Construction: Framing Contractors (5-9: 1)
Accommodation and Food Services: Limited-Service Restaurants (1-4: 1)
People in group quarters in 2010:
2 people in workers' group living quarters and job corps centers
People in group quarters in 2000:
30 people in agriculture workers' dormitories on farms
Fatal accident statistics in 2012:
Fatal accident count: 2
Vehicles involved in fatal accidents: 3
Fatal accidents caused by drunken drivers: 0
Fatalities: 2
Persons involved in fatal accidents: 3
Pedestrians involved in fatal accidents: 0
Fatal accident statistics in 2011:
Fatal accident count: 1
Vehicles involved in fatal accidents: 1
Fatal accidents caused by drunken drivers: 0
Fatalities: 1
Persons involved in fatal accidents: 1
Pedestrians involved in fatal accidents: 0
Home Mortgage Disclosure Act Aggregated Statistics For Year 2003 (Based on 2 partial tracts)
A) FHA, FSA/RHS & VA Home Purchase Loans
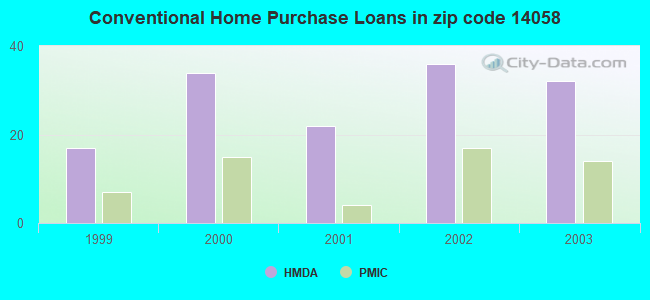
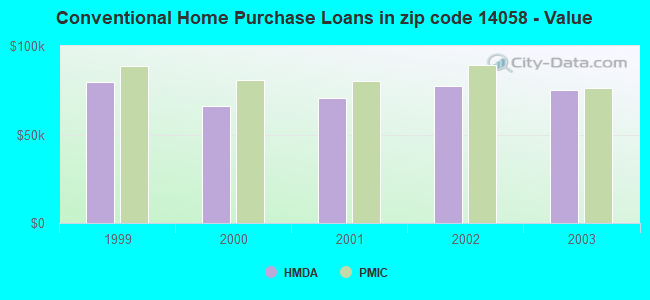
B) Conventional Home Purchase Loans
C) Refinancings
D) Home Improvement Loans
E) Loans on Dwellings For 5+ Families
F) Non-occupant Loans on < 5 Family Dwellings (A B C & D)
Number
Average Value
Number
Average Value
Number
Average Value
Number
Average Value
Number
Average Value
Number
Average Value
LOANS ORIGINATED
8
$72,539
32
$75,112
114
$71,904
16
$21,314
0
$0
10
$69,657
APPLICATIONS APPROVED, NOT ACCEPTED
2
$95,910
0
$0
21
$70,907
2
$11,140
0
$0
2
$50,380
APPLICATIONS DENIED
0
$0
9
$72,014
67
$77,808
13
$13,340
1
$72,660
4
$84,528
APPLICATIONS WITHDRAWN
2
$88,645
5
$114,124
42
$73,836
3
$53,930
0
$0
2
$49,410
FILES CLOSED FOR INCOMPLETENESS
1
$115,290
2
$124,005
4
$63,940
1
$42,630
0
$0
0
$0
Aggregated Statistics For Year 2002 (Based on 2 partial tracts)
A) FHA, FSA/RHS & VA Home Purchase Loans
B) Conventional Home Purchase Loans
C) Refinancings
D) Home Improvement Loans
F) Non-occupant Loans on < 5 Family Dwellings (A B C & D)
Number
Average Value
Number
Average Value
Number
Average Value
Number
Average Value
Number
Average Value
LOANS ORIGINATED
15
$69,818
36
$77,316
103
$72,265
19
$12,594
7
$73,490
APPLICATIONS APPROVED, NOT ACCEPTED
1
$72,660
7
$46,364
16
$54,374
2
$11,625
0
$0
APPLICATIONS DENIED
2
$56,675
6
$38,107
60
$69,318
11
$22,546
0
$0
APPLICATIONS WITHDRAWN
0
$0
1
$60,070
47
$70,537
1
$19,380
1
$41,660
FILES CLOSED FOR INCOMPLETENESS
0
$0
1
$73,630
13
$75,641
0
$0
0
$0
Aggregated Statistics For Year 2001 (Based on 2 partial tracts)
A) FHA, FSA/RHS & VA Home Purchase Loans
B) Conventional Home Purchase Loans
C) Refinancings
D) Home Improvement Loans
F) Non-occupant Loans on < 5 Family Dwellings (A B C & D)
Number
Average Value
Number
Average Value
Number
Average Value
Number
Average Value
Number
Average Value
LOANS ORIGINATED
14
$88,576
22
$70,590
81
$71,512
28
$16,020
4
$52,072
APPLICATIONS APPROVED, NOT ACCEPTED
1
$77,500
1
$52,320
15
$64,651
1
$13,560
0
$0
APPLICATIONS DENIED
2
$63,940
4
$60,065
75
$63,114
19
$15,654
1
$54,250
APPLICATIONS WITHDRAWN
0
$0
2
$295,485
44
$72,418
3
$30,680
0
$0
FILES CLOSED FOR INCOMPLETENESS
1
$47,470
0
$0
4
$43,355
1
$24,220
0
$0
Aggregated Statistics For Year 2000 (Based on 2 partial tracts)
A) FHA, FSA/RHS & VA Home Purchase Loans
B) Conventional Home Purchase Loans
C) Refinancings
D) Home Improvement Loans
F) Non-occupant Loans on < 5 Family Dwellings (A B C & D)
Number
Average Value
Number
Average Value
Number
Average Value
Number
Average Value
Number
Average Value
LOANS ORIGINATED
15
$74,597
34
$65,964
35
$73,989
36
$13,671
5
$38,946
APPLICATIONS APPROVED, NOT ACCEPTED
0
$0
4
$47,470
15
$67,622
13
$13,042
0
$0
APPLICATIONS DENIED
3
$76,213
9
$46,502
68
$48,127
18
$21,691
1
$42,630
APPLICATIONS WITHDRAWN
0
$0
2
$92,035
9
$41,443
2
$38,270
0
$0
FILES CLOSED FOR INCOMPLETENESS
1
$51,350
1
$46,500
3
$73,307
0
$0
0
$0
Aggregated Statistics For Year 1999 (Based on 1 partial tract)
A) FHA, FSA/RHS & VA Home Purchase Loans
B) Conventional Home Purchase Loans
C) Refinancings
D) Home Improvement Loans
F) Non-occupant Loans on < 5 Family Dwellings (A B C & D)
Detailed PMIC statistics for the following Tracts:9502.00
2002 - 2018 National Fire Incident Reporting System (NFIRS) incidents
Based on the data from the years 2002 - 2018 the average number of fire incidents per year is 9. The highest number of fire incidents - 39 took place in 2015, and the least - 0 in 2013. The data has a rising trend.
When looking into fire subcategories, the most reports belonged to: Structure Fires (64.4%), and Outside Fires (25.0%).
Fire incident types reported to NFIRS in Zip Code 14058


+$2,692
-$2,666
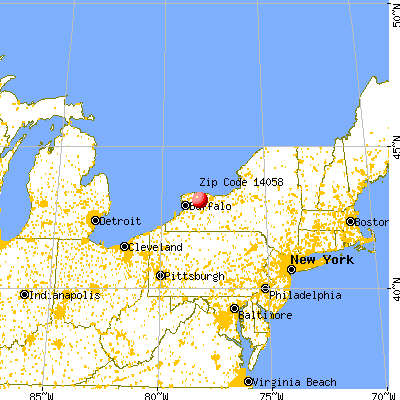
 Nearest zip codes: 14422, 14125, 14020, 14411, 14470, 14143.
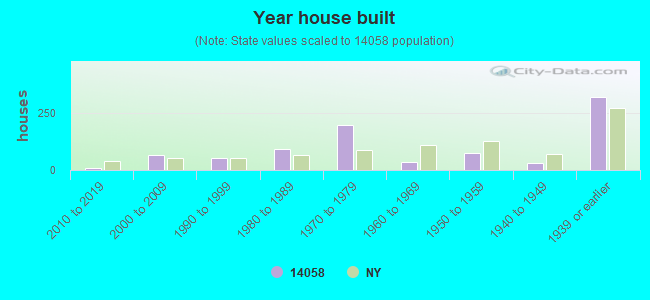


 Based on the data from the years 2002 - 2018 the average number of fire incidents per year is 9. The highest number of fire incidents - 39 took place in 2015, and the least - 0 in 2013. The data has a rising trend.
 When looking into fire subcategories, the most reports belonged to: Structure Fires (64.4%), and Outside Fires (25.0%).