Races in Barrow, Alaska (AK) Detailed Stats
Latest news about races in Barrow, AK collected exclusively by city-data.com from local newspapers, TV, and radio stations
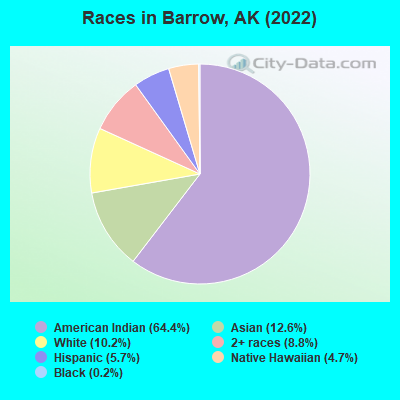
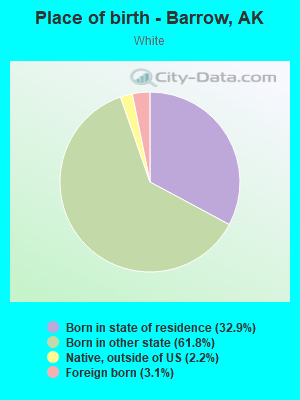
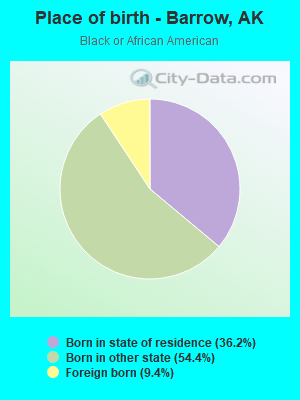
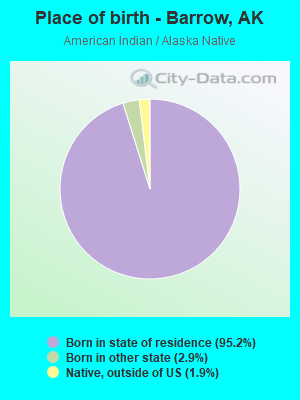
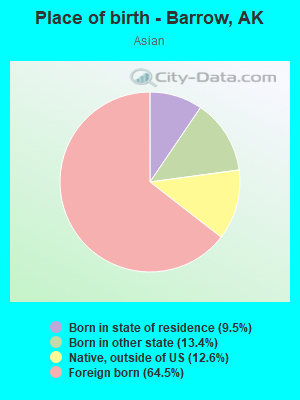
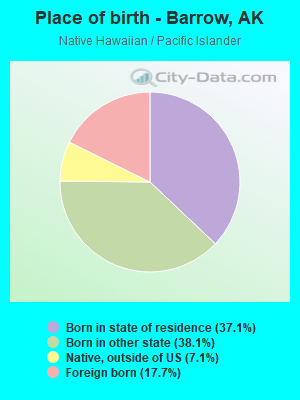
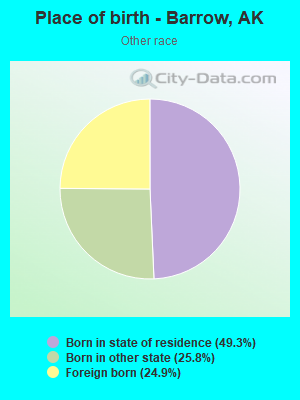
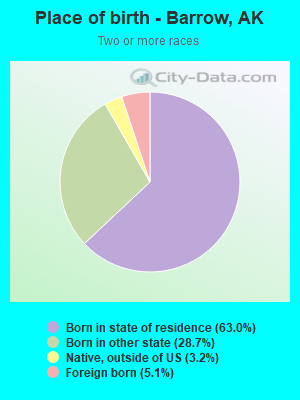
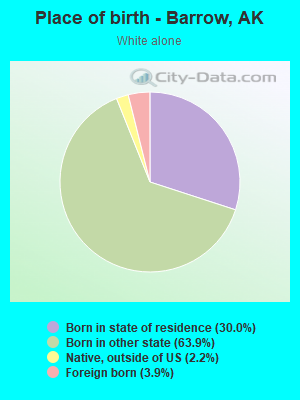
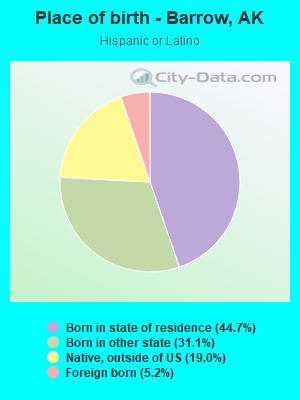
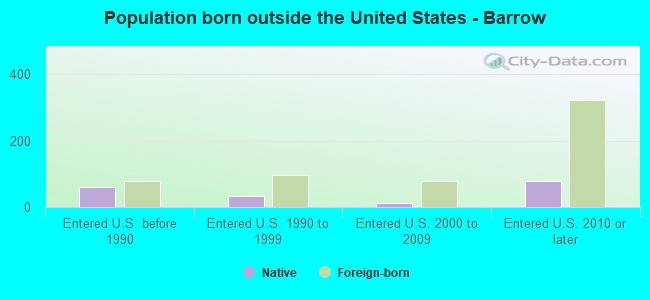
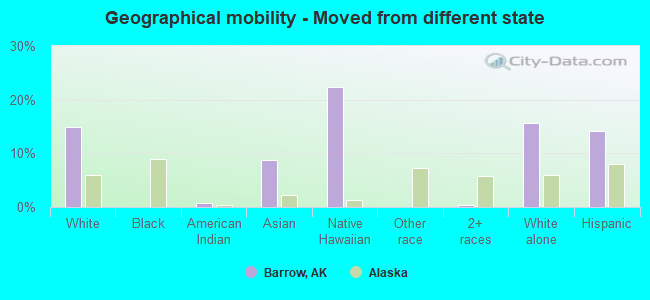
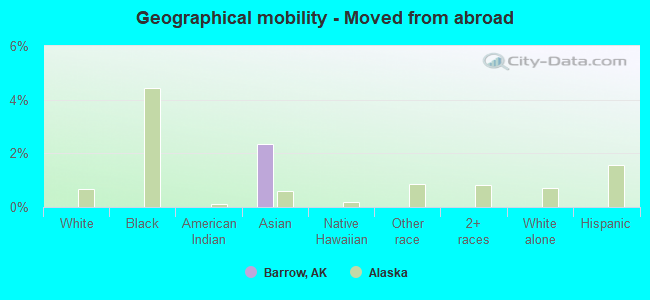
According to 2022 data, the most numerous races in Barrow, AK are White alone (448 residents), American Indian alone (2,820 residents), and Two or more races (386 residents). 54.9% of Barrow residents speak English at home. 9.7% of Barrow, AK residents are foreign-born (8.0% born in Asia), which is 28.1% greater than the foreign-born rate of 7.0% across the entire state of Alaska.
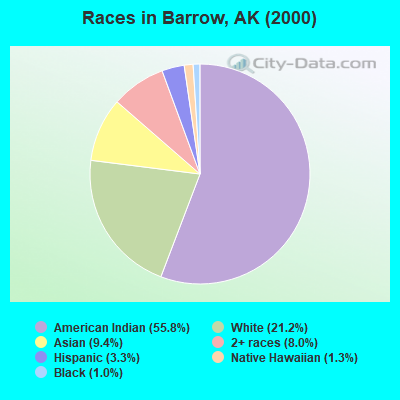
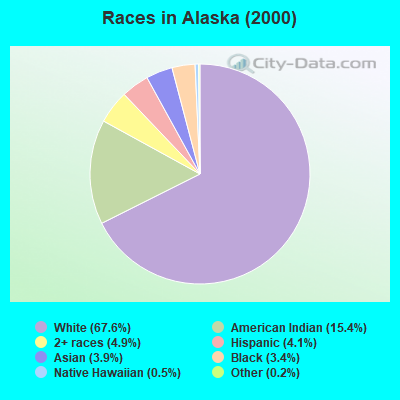
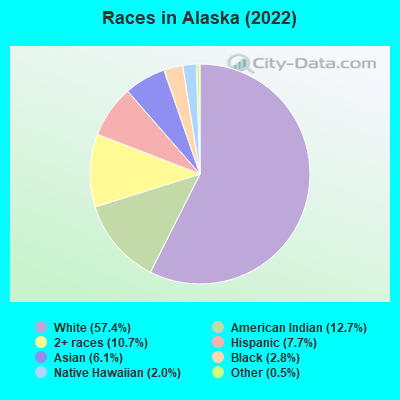
Race distribution in Barrow
2000 2022
423,788 67.6% White alone 96,505 15.4% American Indian alone 30,454 4.9% Two or more races 25,852 4.1% Hispanic 24,741 3.9% Asian alone 21,073 3.4% Black alone 3,181 0.5% Native Hawaiian and Other 1,338 0.2% Other race alone
421,104 57.4% White alone 93,294 12.7% American Indian alone 78,552 10.7% Two or more races 56,491 7.7% Hispanic 44,905 6.1% Asian alone 20,664 2.8% Black alone 14,539 2.0% Native Hawaiian and Other 4,034 0.5% Other race alone
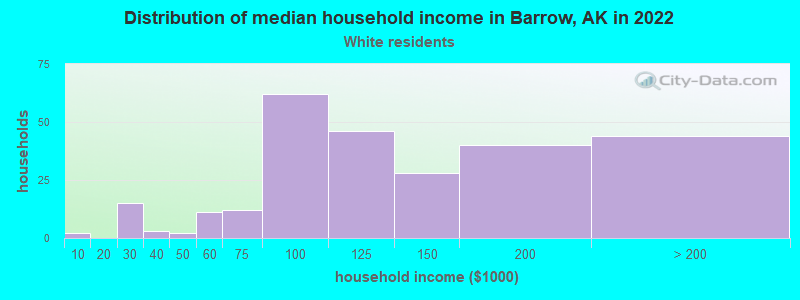
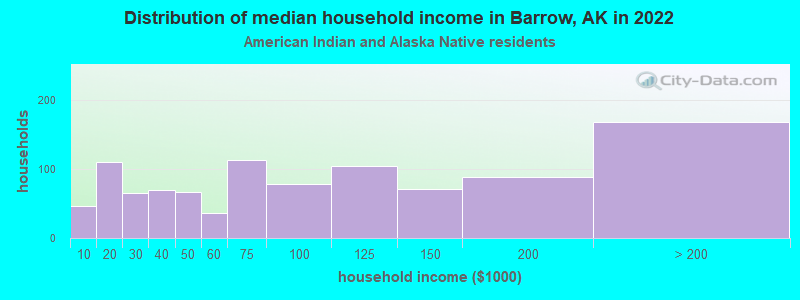
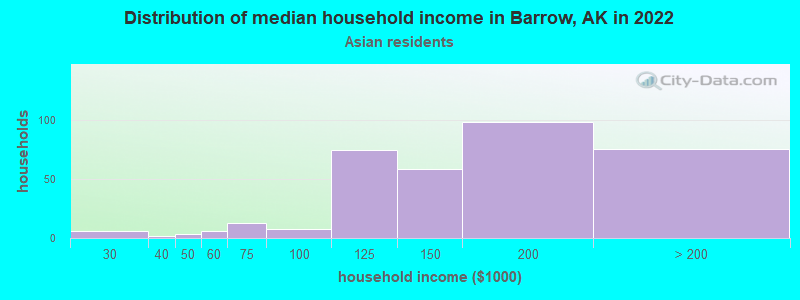
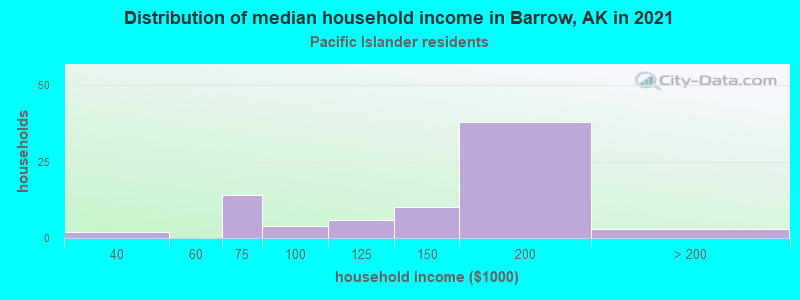
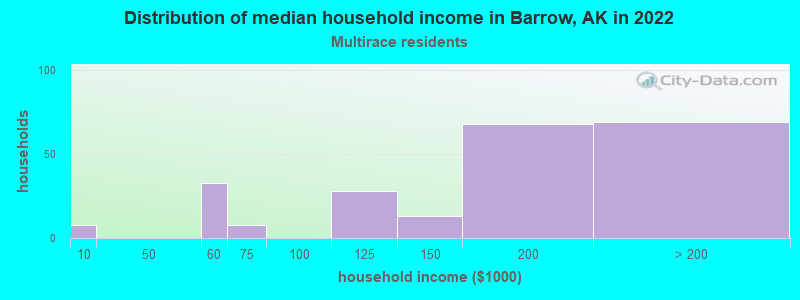
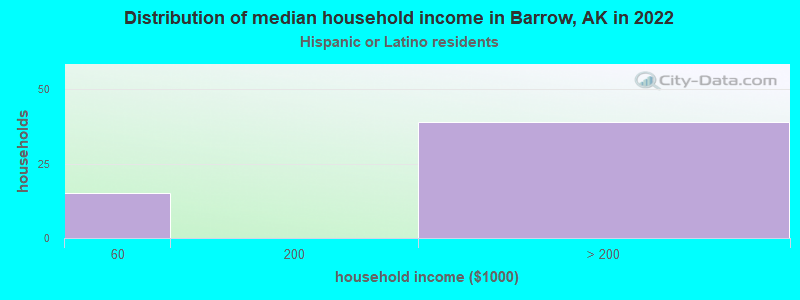
Income and house value in Barrow Median household income in 2022 $124,213 White non-Hispanic householders$54,695 Black householders$68,566 American Indian and Alaska Native householders$196,070 Asian householders$174,142 Native Hawaiian and other Pacific Islander householders$106,558 Some other race householders$179,055 Two or more races householders$85,887 Hispanic or Latino race householdersMedian 2022 house value $437,185 White Non-Hispanic householders$459,743 Black or African American householders$313,851 American Indian or Alaska Native householders $398,444 Asian householders$551,692 Native Hawaiian and other Pacific Islander householders$438,411 Two or more races householders$459,743 Hispanic or Latino householders
Median age by race in Barrow
31.1 Median age for White residents34.7 27.9 56.2 Median age for Black or African American residents26.8 Median age for American Indian / Alaska Native residents25.1 28.2 41.4 Median age for Asian residents43.3 40.2 27.5 Median age for Native Hawaiian / Pacific Islander residents22.7 28.7 23.7 Median age for Other race residents18.3 Median age for Two or more races residents19.9 18.3 33.5 Median age for White alone residents36.0 30.0 18.4 Median age for Hispanic or Latino residents19.1 17.1
Owner/renter occupied households by race in Barrow
House owners and renters - White residents 59 26.3% Owner occupied164 73.7% Renter occupiedHouse owners and renters - Black or African American residents 4 100.0% Renter occupiedHouse owners and renters - American Indian / Alaska Native residents 505 55.9% Owner occupied399 44.1% Renter occupiedHouse owners and renters - Asian residents 62 27.3% Owner occupied164 72.7% Renter occupiedHouse owners and renters - Native Hawaiian / Pacific Islander residents 15 28.7% Owner occupied38 71.3% Renter occupiedHouse owners and renters - Two or more races residents 93 58.8% Owner occupied65 41.2% Renter occupiedHouse owners and renters - White alone residents 59 26.2% Owner occupied165 73.8% Renter occupiedHouse owners and renters - Hispanic or Latino residents 16 56.9% Owner occupied12 43.1% Renter occupied
Language usage in Barrow
English speakers - Total 54.9% of residents of Barrow speak English at home.
1.4% of residents speak Spanish at home 55 100.0% Speak English very well43.9% of residents speak other language at home 1,256 72.0% Speak English very well488 28.0% Speak English less than very well
English speakers - Born in the United States 82.2% of residents of Barrow speak English at home.
3.4% of residents speak Spanish at home 21 100.0% Speak English very well13.1% of residents speak other language at home 69 84.1% Speak English very well13 15.9% Speak English less than very well
English speakers - Native, born elsewhere 38.1% of residents of Barrow speak English at home.
1.4% of residents speak Spanish at home 2 100.0% Speak English very well49.6% of residents speak other language at home 45 65.2% Speak English very well24 34.8% Speak English less than very well
English speakers - Foreign-born 10.9% of residents of Barrow speak English at home.
3.0% of residents speak Spanish at home 13 100.0% Speak English very well90.2% of residents speak other language at home 244 62.9% Speak English very well144 37.1% Speak English less than very well
White (Caucasian) - Speak only English Native:
89.7% (368)Foreign-born:
13.8% (2)
White (Caucasian) - Speak another language Native:
10.1% (42)Foreign-born:
76.2% (11)
Asian - Speak only English Native:
64.7% (102)Foreign-born:
14.5% (54)
Asian - Speak another language Native:
34.0% (54)Foreign-born:
85.8% (319)
Native Hawaiian / Pacific Islander - Speak another language Native:
59.5% (92)Foreign-born:
100.0% (39)
Other race - Speak another language Native:
29.2% (17)Foreign-born:
93.4% (14)
Two or more races - Speak another language Native:
19.2% (74)Foreign-born:
95.7% (31)
White alone - Speak only English Native:
89.5% (357)Foreign-born:
12.0% (2)
White alone - Speak another language Native:
10.1% (40)Foreign-born:
79.4% (14)
Hispanic or Latino - Speak another language Native:
19.5% (43)Foreign-born:
95.1% (13)
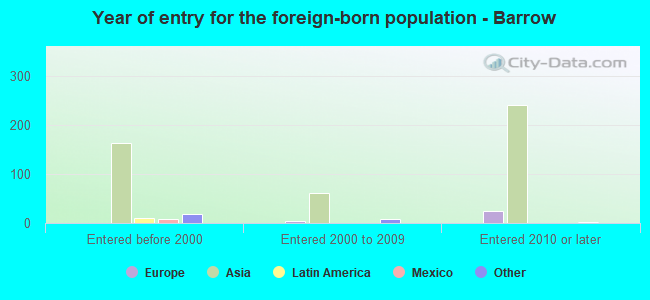
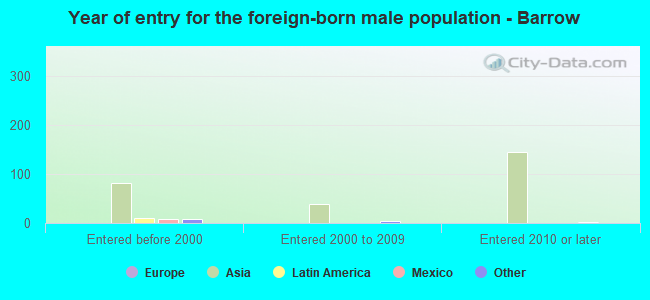
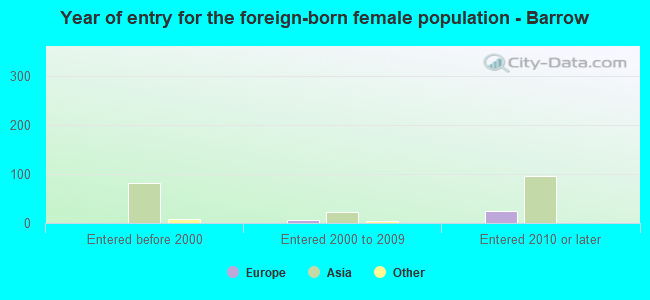
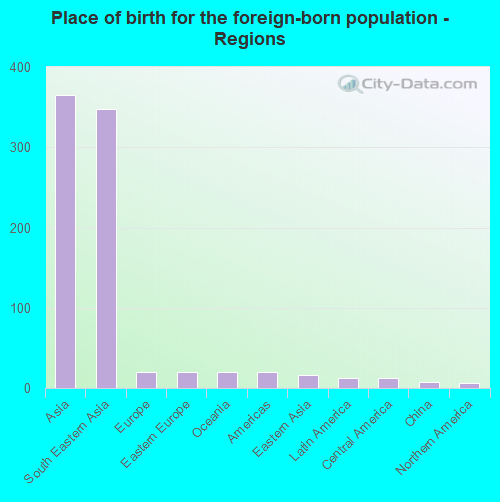
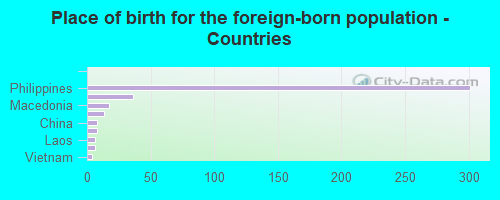
Foreign-born residents in Barrow 427 residents are foreign born (8.0% Asia ).
This city:
9.7%Alaska:
100.0%
Marital status for residents in Barrow Marital status - White (Caucasian) population 15 years and over
Males 20.9% Never married66.7% Now married1.1% Separated0.0% Widowed11.3% DivorcedFemales 21.6% Never married64.0% Now married0.0% Separated0.9% Widowed13.5% DivorcedWomen who gave birth in the past 12 months Now married:
100.0% (4)Unmarried:
0.0% (0)
Women who did not give birth in the past 12 months Now married:
62.2% (40)Unmarried:
37.8% (25)
Marital status - Black or African American population 15 years and over
Males 25.0% Never married75.0% Now married0.0% Separated0.0% Widowed0.0% DivorcedFemales 100.0% Never married0.0% Now married0.0% Separated0.0% Widowed0.0% DivorcedMarital status - American Indian / Alaska Native population 15 years and over
Males 54.0% Never married33.2% Now married2.9% Separated2.8% Widowed7.1% DivorcedFemales 44.7% Never married36.7% Now married2.4% Separated5.8% Widowed10.4% DivorcedWomen who gave birth in the past 12 months Now married:
52.6% (31)Unmarried:
47.4% (27)
Women who did not give birth in the past 12 months Now married:
33.0% (206)Unmarried:
67.0% (417)
Marital status - Asian population 15 years and over
Males 19.0% Never married71.3% Now married2.1% Separated0.0% Widowed7.7% DivorcedFemales 19.3% Never married61.5% Now married5.9% Separated5.9% Widowed7.5% DivorcedWomen who gave birth in the past 12 months Now married:
85.0% (20)Unmarried:
15.0% (3)
Women who did not give birth in the past 12 months Now married:
46.3% (44)Unmarried:
53.7% (51)
Marital status - Native Hawaiian / Pacific Islander population 15 years and over
Males 49.1% Never married50.9% Now married0.0% Separated0.0% Widowed0.0% DivorcedFemales 35.0% Never married60.0% Now married0.0% Separated0.0% Widowed5.0% DivorcedWomen who gave birth in the past 12 months Now married:
100.0% (12)Unmarried:
0.0% (0)
Women who did not give birth in the past 12 months Now married:
48.4% (20)Unmarried:
51.6% (22)
Marital status - Other race population 15 years and over
Males 18.5% Never married81.5% Now married0.0% Separated0.0% Widowed0.0% DivorcedFemales 100.0% Never married0.0% Now married0.0% Separated0.0% Widowed0.0% DivorcedWomen who did not give birth in the past 12 months Now married:
0.0% (0)Unmarried:
100.0% (35)
Marital status - Two or more races population 15 years and over
Males 47.2% Never married32.6% Now married0.0% Separated3.4% Widowed16.9% DivorcedFemales 54.2% Never married32.3% Now married0.0% Separated0.0% Widowed13.5% DivorcedWomen who gave birth in the past 12 months Now married:
81.5% (31)Unmarried:
18.5% (7)
Women who did not give birth in the past 12 months Now married:
18.0% (13)Unmarried:
82.0% (57)
Marital status - White alone, not Hispanic / Latino population 15 years and over
Males 21.6% Never married65.4% Now married1.1% Separated0.0% Widowed11.9% DivorcedFemales 21.6% Never married64.0% Now married0.0% Separated0.9% Widowed13.5% DivorcedWomen who gave birth in the past 12 months Now married:
100.0% (4)Unmarried:
0.0% (0)
Women who did not give birth in the past 12 months Now married:
62.2% (40)Unmarried:
37.8% (25)
Marital status - Hispanic or Latino population 15 years and over
Males 67.3% Never married32.7% Now married0.0% Separated0.0% Widowed0.0% DivorcedFemales 43.2% Never married56.8% Now married0.0% Separated0.0% Widowed0.0% DivorcedWomen who gave birth in the past 12 months Now married:
100.0% (15)Unmarried:
0.0% (0)
Women who did not give birth in the past 12 months Now married:
0.0% (0)Unmarried:
100.0% (23)
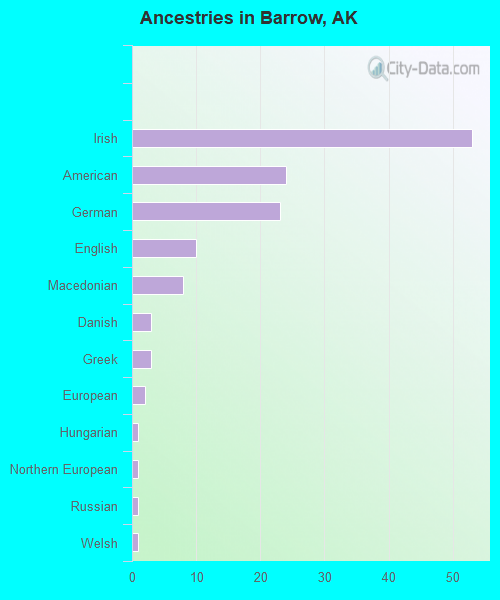
Ancestries in Barrow
53 1.8% Irish24 0.8% American23 0.8% German10 0.3% English8 0.3% Macedonian3 0.1% Danish3 0.1% Greek2 0.07% European1 0.03% Hungarian1 0.03% Northern European1 0.03% Russian1 0.03% Welsh
Children Nativity (place of birth) in Barrow
Children under 6 years - Living with two parents Both parents native 188 100.0% NativeBoth parents foreign-born 26 73.0% Native10 27.0% Foreign-bornOne native, one foreign-born parent 10 100.0% NativeChildren under 6 years - Living with one parent Native parent 217 100.0% NativeForeign-born parent 13 100.0% NativeChildren 6 to 17 years - Living with two parents Both parents native 454 100.0% NativeBoth parents foreign-born 42 81.6% Native9 18.4% Foreign-bornOne native, one foreign-born parent 6 100.0% NativeChildren 6 to 17 years - Living with one parent Native parent 413 98.2% Native7 1.8% Foreign-bornForeign-born parent 40 78.5% Native11 21.5% Foreign-born
Grandparents responsible for own grandchildren in Barrow
Grandparents (30 to 59 years) White / Caucasian 2 100.0% Not responsible for grandchildrenAmerican Indian / Alaska Native 37 51.8% Responsible for grandchildren34 48.2% Not responsible for grandchildrenAsian 13 32.4% Responsible for grandchildren27 67.6% Not responsible for grandchildrenNative Hawaiian / Pacific Islander 36 100.0% Responsible for grandchildrenWhite alone, not Hispanic / Latino 2 100.0% Not responsible for grandchildrenHispanic or Latino 12 100.0% Responsible for grandchildrenGrandparents (60 years and over) White / Caucasian 1 100.0% Responsible for grandchildrenAmerican Indian / Alaska Native 55 41.4% Responsible for grandchildren78 58.6% Not responsible for grandchildrenAsian 54 100.0% Not responsible for grandchildrenWhite alone, not Hispanic / Latino 1 100.0% Responsible for grandchildren