Races in Beach Park, Illinois (IL) Detailed Stats
Data:
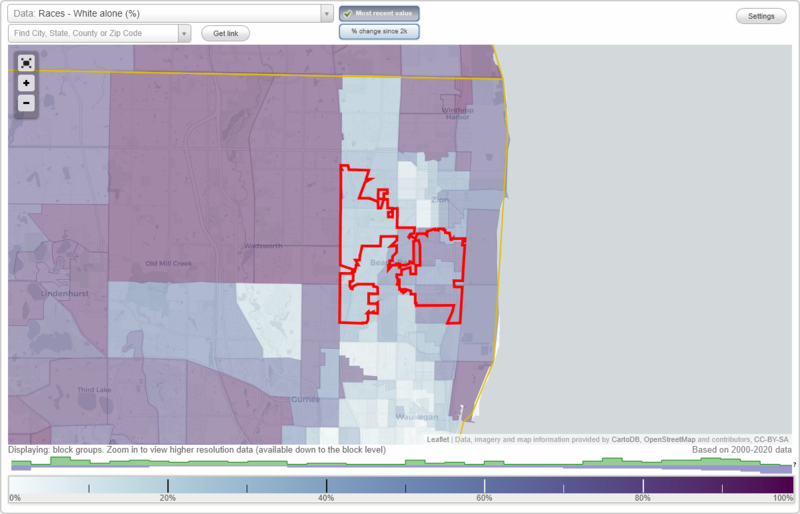
Races - White alone (%)
Races - White alone (% change since 2000)
Races - Black alone (%)
Races - Black alone (% change since 2000)
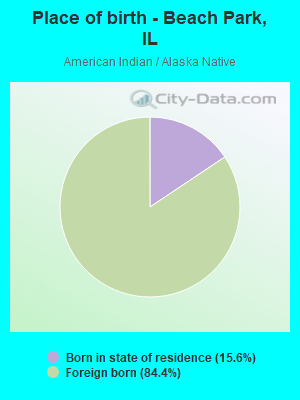
Races - American Indian alone (%)
Races - American Indian alone (% change since 2000)
Races - Asian alone (%)
Races - Asian alone (% change since 2000)
Races - Hispanic (%)
Races - Hispanic (% change since 2000)
Races - Native Hawaiian and Other Pacific Islander alone (%)
Races - Native Hawaiian and Other Pacific Islander alone (% change since 2000)
Races - Two or more races(%)
Races - Two or more races(% change since 2000)
Races - Other race alone (%)
Races - Other race alone (% change since 2000)
Racial diversity
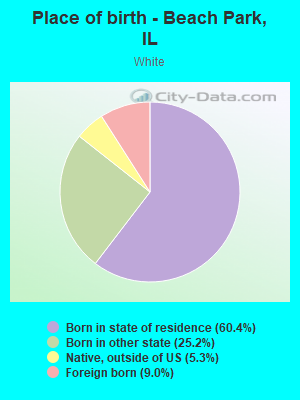
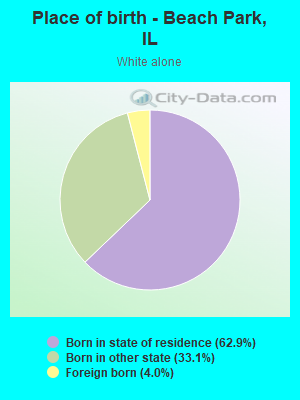
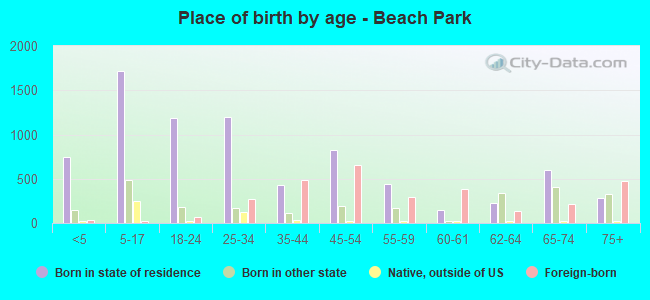
Place of birth - Born in state of residence (%)
Place of birth - Born in state of residence (%) - White
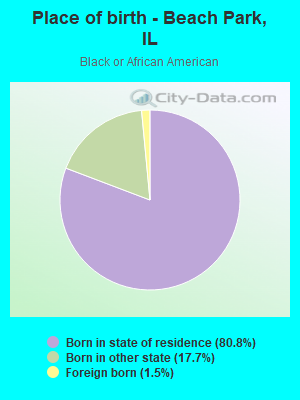
Place of birth - Born in state of residence (%) - Black or African American
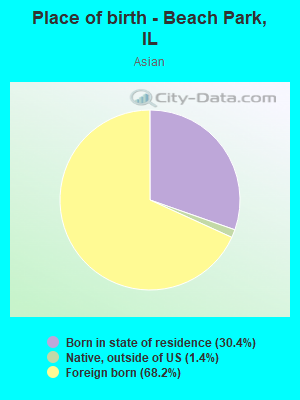
Place of birth - Born in state of residence (%) - Asian
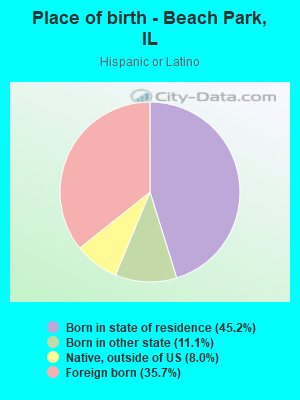
Place of birth - Born in state of residence (%) - Hispanic or Latino
Place of birth - Born in state of residence (%) - American Indian and Alaska Native
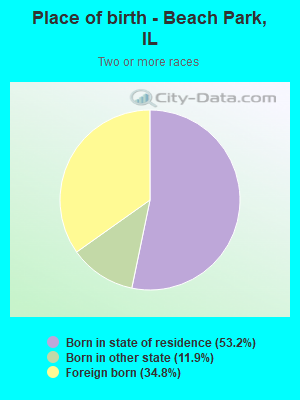
Place of birth - Born in state of residence (%) - Multirace
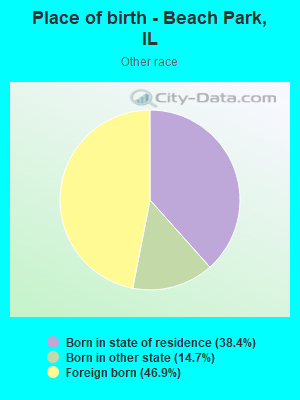
Place of birth - Born in state of residence (%) - Other Race
Place of birth - Born in other state (%)
Place of birth - Born in other state (%) - White
Place of birth - Born in other state (%) - Black or African American
Place of birth - Born in other state (%) - Asian
Place of birth - Born in other state (%) - Hispanic or Latino
Place of birth - Born in other state (%) - American Indian and Alaska Native
Place of birth - Born in other state (%) - Multirace
Place of birth - Born in other state (%) - Other Race
Place of birth - Native, outside of US (%)
Place of birth - Native, outside of US (%) - White
Place of birth - Native, outside of US (%) - Black or African American
Place of birth - Native, outside of US (%) - Asian
Place of birth - Native, outside of US (%) - Hispanic or Latino
Place of birth - Native, outside of US (%) - American Indian and Alaska Native
Place of birth - Native, outside of US (%) - Multirace
Place of birth - Native, outside of US (%) - Other Race
Place of birth - Foreign born (%)
Place of birth - Foreign born (%) - White
Place of birth - Foreign born (%) - Black or African American
Place of birth - Foreign born (%) - Asian
Place of birth - Foreign born (%) - Hispanic or Latino
Place of birth - Foreign born (%) - American Indian and Alaska Native
Place of birth - Foreign born (%) - Multirace
Place of birth - Foreign born (%) - Other Race
Residents speaking English at home (%)
Residents speaking English at home - Born in the United States (%)
Residents speaking English at home - Native, born elsewhere (%)
Residents speaking English at home - Foreign born (%)
Residents speaking Spanish at home (%)
Residents speaking Spanish at home - Born in the United States (%)
Residents speaking Spanish at home - Native, born elsewhere (%)
Residents speaking Spanish at home - Foreign born (%)
Residents speaking other language at home (%)
Residents speaking other language at home - Born in the United States (%)
Residents speaking other language at home - Native, born elsewhere (%)
Residents speaking other language at home - Foreign born (%)
Marital status - Never married (%)
Marital status - Now married (%)
Marital status - Separated (%)
Marital status - Widowed (%)
Marital status - Divorced (%)
Ancestries Reported - Arab (%)
Ancestries Reported - Czech (%)
Ancestries Reported - Danish (%)
Ancestries Reported - Dutch (%)
Ancestries Reported - English (%)
Ancestries Reported - French (%)
Ancestries Reported - French Canadian (%)
Ancestries Reported - German (%)
Ancestries Reported - Greek (%)
Ancestries Reported - Hungarian (%)
Ancestries Reported - Irish (%)
Ancestries Reported - Italian (%)
Ancestries Reported - Lithuanian (%)
Ancestries Reported - Norwegian (%)
Ancestries Reported - Polish (%)
Ancestries Reported - Portuguese (%)
Ancestries Reported - Russian (%)
Ancestries Reported - Scotch-Irish (%)
Ancestries Reported - Scottish (%)
Ancestries Reported - Slovak (%)
Ancestries Reported - Subsaharan African (%)
Ancestries Reported - Swedish (%)
Ancestries Reported - Swiss (%)
Ancestries Reported - Ukrainian (%)
Ancestries Reported - United States (%)
Ancestries Reported - Welsh (%)
Ancestries Reported - West Indian (%)
Ancestries Reported - Other (%)
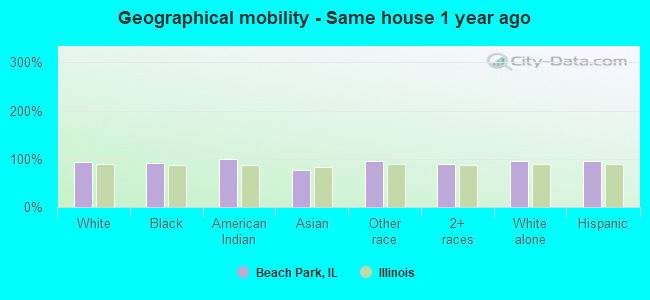
Geographical mobility - Same house 1 year ago (%)
Geographical mobility - Same house 1 year ago (%) - White
Geographical mobility - Same house 1 year ago (%) - Black or African American
Geographical mobility - Same house 1 year ago (%) - Asian
Geographical mobility - Same house 1 year ago (%) - Hispanic or Latino
Geographical mobility - Same house 1 year ago (%) - American Indian and Alaska Native
Geographical mobility - Same house 1 year ago (%) - Multirace
Geographical mobility - Same house 1 year ago (%) - Other Race
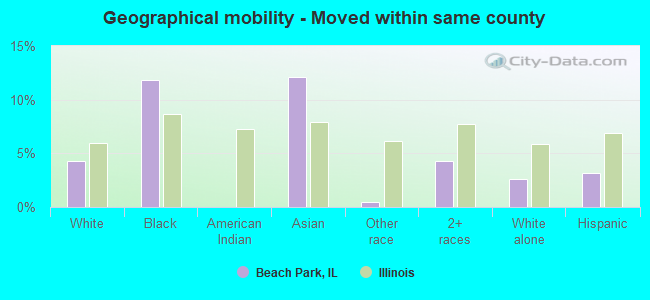
Geographical mobility - Moved within same county (%)
Geographical mobility - Moved within same county (%) - White
Geographical mobility - Moved within same county (%) - Black or African American
Geographical mobility - Moved within same county (%) - Asian
Geographical mobility - Moved within same county (%) - Hispanic or Latino
Geographical mobility - Moved within same county (%) - American Indian and Alaska Native
Geographical mobility - Moved within same county (%) - Multirace
Geographical mobility - Moved within same county (%) - Other Race
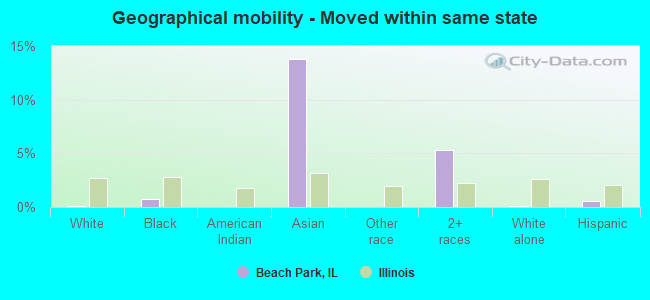
Geographical mobility - Moved from different county within same state (%)
Geographical mobility - Moved from different county within same state (%) - White
Geographical mobility - Moved from different county within same state (%) - Black or African American
Geographical mobility - Moved from different county within same state (%) - Asian
Geographical mobility - Moved from different county within same state (%) - Hispanic or Latino
Geographical mobility - Moved from different county within same state (%) - American Indian and Alaska Native
Geographical mobility - Moved from different county within same state (%) - Multirace
Geographical mobility - Moved from different county within same state (%) - Other Race
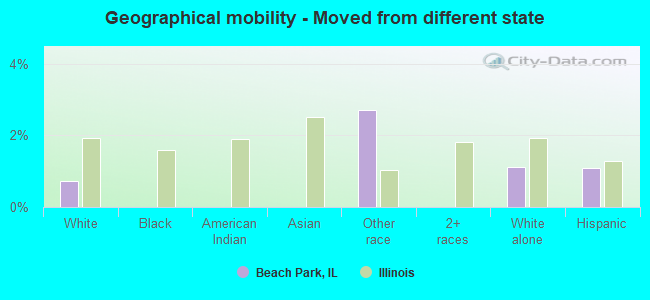
Geographical mobility - Moved from different state (%)
Geographical mobility - Moved from different state (%) - White
Geographical mobility - Moved from different state (%) - Black or African American
Geographical mobility - Moved from different state (%) - Asian
Geographical mobility - Moved from different state (%) - Hispanic or Latino
Geographical mobility - Moved from different state (%) - American Indian and Alaska Native
Geographical mobility - Moved from different state (%) - Multirace
Geographical mobility - Moved from different state (%) - Other Race
Geographical mobility - Moved from abroad (%)
Geographical mobility - Moved from abroad (%) - White
Geographical mobility - Moved from abroad (%) - Black or African American
Geographical mobility - Moved from abroad (%) - Asian
Geographical mobility - Moved from abroad (%) - Hispanic or Latino
Geographical mobility - Moved from abroad (%) - American Indian and Alaska Native
Geographical mobility - Moved from abroad (%) - Multirace
Geographical mobility - Moved from abroad (%) - Other Race
Place of birth for the foreign-born population - Ireland (%)
Place of birth for the foreign-born population - Denmark (%)
Place of birth for the foreign-born population - Norway (%)
Place of birth for the foreign-born population - Sweden (%)
Place of birth for the foreign-born population - United Kingdom (%)
Place of birth for the foreign-born population - England (%)
Place of birth for the foreign-born population - Scotland (%)
Place of birth for the foreign-born population - Other Northern Europe (%)
Place of birth for the foreign-born population - Austria (%)
Place of birth for the foreign-born population - Belgium (%)
Place of birth for the foreign-born population - France (%)
Place of birth for the foreign-born population - Germany (%)
Place of birth for the foreign-born population - Netherlands (%)
Place of birth for the foreign-born population - Switzerland (%)
Place of birth for the foreign-born population - Other Western Europe (%)
Place of birth for the foreign-born population - Greece (%)
Place of birth for the foreign-born population - Italy (%)
Place of birth for the foreign-born population - Portugal (%)
Place of birth for the foreign-born population - Spain (%)
Place of birth for the foreign-born population - Other Southern Europe (%)
Place of birth for the foreign-born population - Albania (%)
Place of birth for the foreign-born population - Belarus (%)
Place of birth for the foreign-born population - Bosnia and Herzegovina (%)
Place of birth for the foreign-born population - Bulgaria (%)
Place of birth for the foreign-born population - Croatia (%)
Place of birth for the foreign-born population - Czechoslovakia (%)
Place of birth for the foreign-born population - Hungary (%)
Place of birth for the foreign-born population - Latvia (%)
Place of birth for the foreign-born population - Lithuania (%)
Place of birth for the foreign-born population - North Macedonia (Macedonia) (%)
Place of birth for the foreign-born population - Moldova (%)
Place of birth for the foreign-born population - Poland (%)
Place of birth for the foreign-born population - Romania (%)
Place of birth for the foreign-born population - Russia (%)
Place of birth for the foreign-born population - Serbia (%)
Place of birth for the foreign-born population - Ukraine (%)
Place of birth for the foreign-born population - Other Eastern Europe (%)
Place of birth for the foreign-born population - China (%)
Place of birth for the foreign-born population - Hong Kong (%)
Place of birth for the foreign-born population - Taiwan (%)
Place of birth for the foreign-born population - Japan (%)
Place of birth for the foreign-born population - Korea (%)
Place of birth for the foreign-born population - Other Eastern Asia (%)
Place of birth for the foreign-born population - Afghanistan (%)
Place of birth for the foreign-born population - Bangladesh (%)
Place of birth for the foreign-born population - India (%)
Place of birth for the foreign-born population - Iran (%)
Place of birth for the foreign-born population - Kazakhstan (%)
Place of birth for the foreign-born population - Nepal (%)
Place of birth for the foreign-born population - Pakistan (%)
Place of birth for the foreign-born population - Sri Lanka (%)
Place of birth for the foreign-born population - Uzbekistan (%)
Place of birth for the foreign-born population - Other South Central Asia (%)
Place of birth for the foreign-born population - Burma (%)
Place of birth for the foreign-born population - Cambodia (%)
Place of birth for the foreign-born population - Indonesia (%)
Place of birth for the foreign-born population - Laos (%)
Place of birth for the foreign-born population - Malaysia (%)
Place of birth for the foreign-born population - Philippines (%)
Place of birth for the foreign-born population - Singapore (%)
Place of birth for the foreign-born population - Thailand (%)
Place of birth for the foreign-born population - Vietnam (%)
Place of birth for the foreign-born population - Other South Eastern Asia (%)
Place of birth for the foreign-born population - Armenia (%)
Place of birth for the foreign-born population - Iraq (%)
Place of birth for the foreign-born population - Israel (%)
Place of birth for the foreign-born population - Jordan (%)
Place of birth for the foreign-born population - Kuwait (%)
Place of birth for the foreign-born population - Lebanon (%)
Place of birth for the foreign-born population - Saudi Arabia (%)
Place of birth for the foreign-born population - Syria (%)
Place of birth for the foreign-born population - Turkey (%)
Place of birth for the foreign-born population - Yemen (%)
Place of birth for the foreign-born population - Other Western Asia (%)
Place of birth for the foreign-born population - Eritrea (%)
Place of birth for the foreign-born population - Ethiopia (%)
Place of birth for the foreign-born population - Kenya (%)
Place of birth for the foreign-born population - Somalia (%)
Place of birth for the foreign-born population - Uganda (%)
Place of birth for the foreign-born population - Zimbabwe (%)
Place of birth for the foreign-born population - Other Eastern Africa (%)
Place of birth for the foreign-born population - Cameroon (%)
Place of birth for the foreign-born population - Congo (%)
Place of birth for the foreign-born population - Democratic Republic of Congo (Zaire) (%)
Place of birth for the foreign-born population - Other Middle Africa (%)
Place of birth for the foreign-born population - Egypt (%)
Place of birth for the foreign-born population - Morocco (%)
Place of birth for the foreign-born population - Sudan (%)
Place of birth for the foreign-born population - Other Northern Africa (%)
Place of birth for the foreign-born population - South Africa (%)
Place of birth for the foreign-born population - Other Southern Africa (%)
Place of birth for the foreign-born population - Cabo Verde (%)
Place of birth for the foreign-born population - Ghana (%)
Place of birth for the foreign-born population - Liberia (%)
Place of birth for the foreign-born population - Nigeria (%)
Place of birth for the foreign-born population - Senegal (%)
Place of birth for the foreign-born population - Sierra Leone (%)
Place of birth for the foreign-born population - Other Western Africa (%)
Place of birth for the foreign-born population - Australia (%)
Place of birth for the foreign-born population - New Zealand (%)
Place of birth for the foreign-born population - Fiji (%)
Place of birth for the foreign-born population - Micronesia (%)
Place of birth for the foreign-born population - Bahamas (%)
Place of birth for the foreign-born population - Barbados (%)
Place of birth for the foreign-born population - Cuba (%)
Place of birth for the foreign-born population - Dominica (%)
Place of birth for the foreign-born population - Dominican Republic (%)
Place of birth for the foreign-born population - Grenada (%)
Place of birth for the foreign-born population - Haiti (%)
Place of birth for the foreign-born population - Jamaica (%)
Place of birth for the foreign-born population - St. Vincent and the Grenadines (%)
Place of birth for the foreign-born population - Trinidad and Tobago (%)
Place of birth for the foreign-born population - West Indies (%)
Place of birth for the foreign-born population - Other Caribbean (%)
Place of birth for the foreign-born population - Belize (%)
Place of birth for the foreign-born population - Costa Rica (%)
Place of birth for the foreign-born population - El Salvador (%)
Place of birth for the foreign-born population - Guatemala (%)
Place of birth for the foreign-born population - Honduras (%)
Place of birth for the foreign-born population - Mexico (%)
Place of birth for the foreign-born population - Nicaragua (%)
Place of birth for the foreign-born population - Panama (%)
Place of birth for the foreign-born population - Other Central America (%)
Place of birth for the foreign-born population - Argentina (%)
Place of birth for the foreign-born population - Bolivia (%)
Place of birth for the foreign-born population - Brazil (%)
Place of birth for the foreign-born population - Chile (%)
Place of birth for the foreign-born population - Colombia (%)
Place of birth for the foreign-born population - Ecuador (%)
Place of birth for the foreign-born population - Guyana (%)
Place of birth for the foreign-born population - Peru (%)
Place of birth for the foreign-born population - Uruguay (%)
Place of birth for the foreign-born population - Venezuela (%)
Place of birth for the foreign-born population - Other South America (%)
Place of birth for the foreign-born population - Canada (%)
Place of birth for the foreign-born population - Other Northern America (%)
Place of birth for the foreign-born population - Other (%)
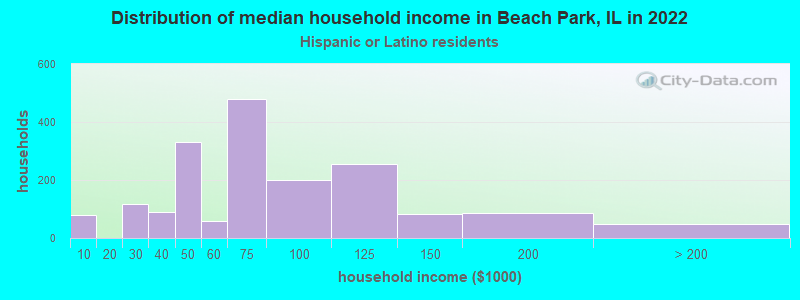
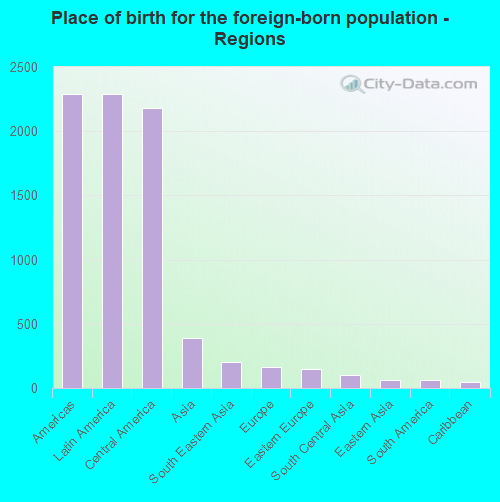
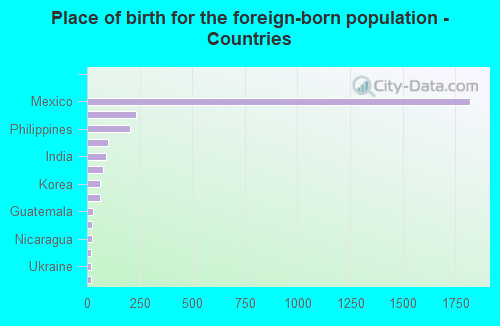
According to 2022 data, the most numerous races in Beach Park, IL are White alone (4,777 residents), Hispanic (6,658 residents), and Black alone (1,766 residents). 54.4% of Beach Park residents speak English at home. 20.4% of Beach Park, IL residents are foreign-born (16.3% born in Latin America, 2.8% born in Asia), which is 31.4% greater than the foreign-born rate of 14.0% across the entire state of Illinois.
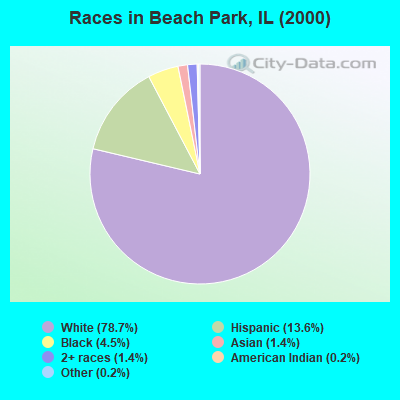
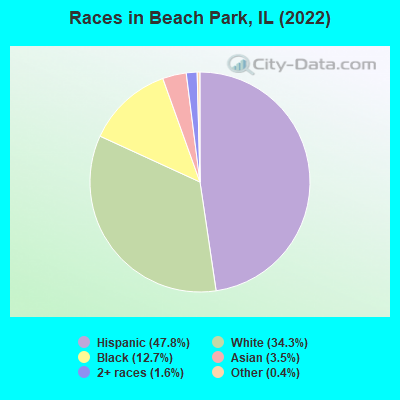
Race distribution in Beach Park
2000 2022
8,424,140 67.8% White alone 1,856,152 14.9% Black alone 1,530,262 12.3% Hispanic 419,916 3.4% Asian alone 153,996 1.2% Two or more races 13,479 0.1% Other race alone 18,232 0.1% American Indian alone 3,116 0.03% Native Hawaiian and Other
7,356,301 58.5% White alone 2,299,726 18.3% Hispanic 1,660,423 13.2% Black alone 747,296 5.9% Asian alone 458,599 3.6% Two or more races 45,386 0.4% Other race alone 10,405 0.08% American Indian alone 3,896 0.03% Native Hawaiian and Other
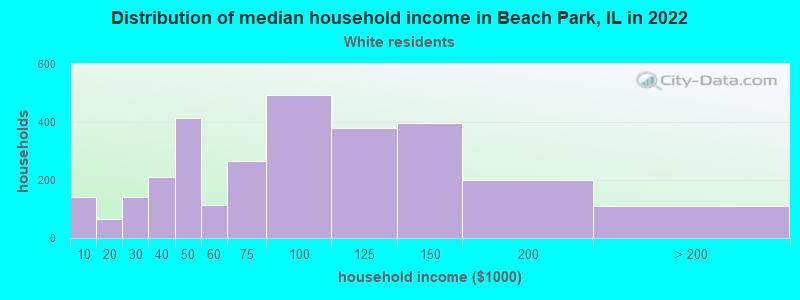
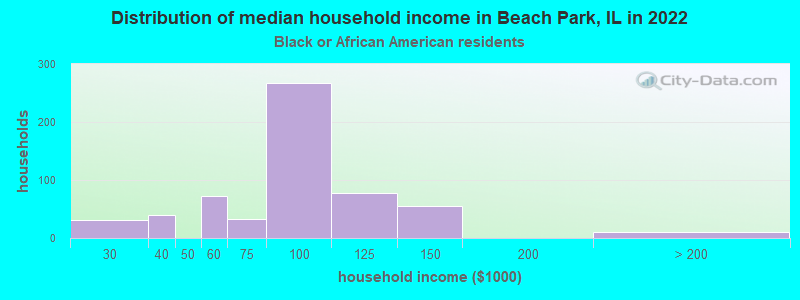
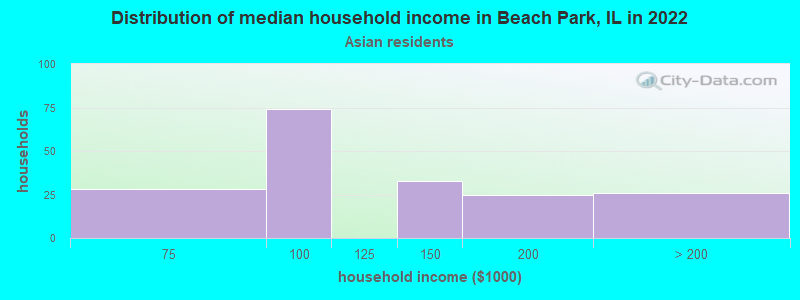
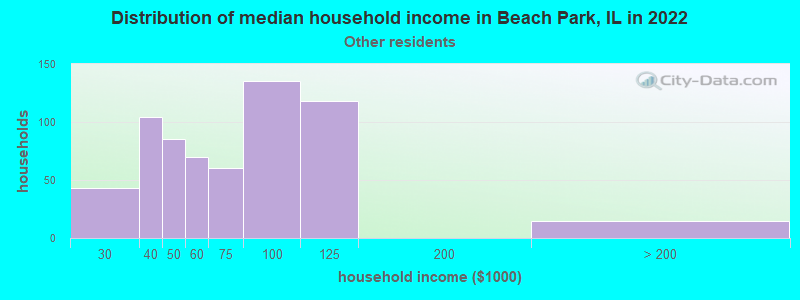
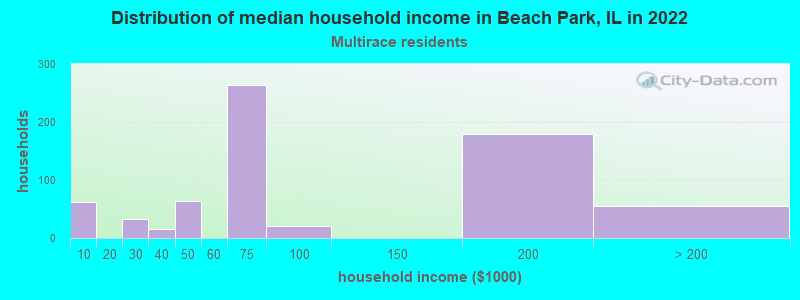
Income and house value in Beach Park Median household income in 2022 $82,389 White non-Hispanic householders$93,538 Black householders$119,184 Asian householders$59,692 Some other race householders$67,826 Two or more races householders$62,641 Hispanic or Latino race householdersMedian 2022 house value $226,226 White Non-Hispanic householders$267,962 Black or African American householders $227,332 Asian householders$227,965 Some other race householders$205,516 Two or more races householders$231,443 Hispanic or Latino householders
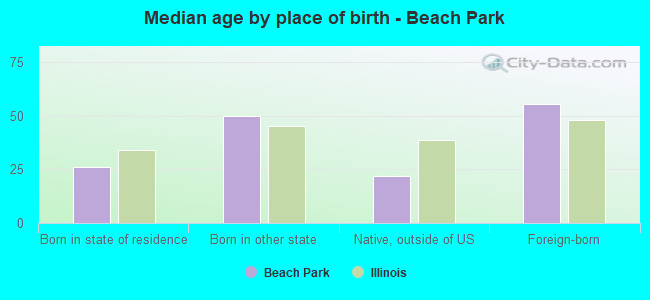
Median age by race in Beach Park
41.8 Median age for White residents42.9 41.5 35.7 Median age for Black or African American residents34.7 52.6 56.1 Median age for American Indian / Alaska Native residents-671,532,846.0 -638,251,365.5 57.0 Median age for Asian residents41.8 57.3 -593,236,714.4 Median age for Native Hawaiian / Pacific Islander residents-658,536,584.7 -576,015,108.0 33.2 Median age for Other race residents32.6 35.1 27.3 Median age for Two or more races residents33.3 26.4 51.3 Median age for White alone residents48.9 53.7 29.7 Median age for Hispanic or Latino residents31.9 28.1
Owner/renter occupied households by race in Beach Park
House owners and renters - White residents 2,283 79.7% Owner occupied582 20.3% Renter occupiedHouse owners and renters - Black or African American residents 391 75.7% Owner occupied125 24.3% Renter occupiedHouse owners and renters - American Indian / Alaska Native residents 63 100.0% Owner occupiedHouse owners and renters - Asian residents 184 100.0% Owner occupiedHouse owners and renters - Other race residents 544 89.1% Owner occupied66 10.9% Renter occupiedHouse owners and renters - Two or more races residents 539 81.3% Owner occupied124 18.7% Renter occupiedHouse owners and renters - White alone residents 1,894 82.8% Owner occupied394 17.2% Renter occupiedHouse owners and renters - Hispanic or Latino residents 1,428 78.3% Owner occupied396 21.7% Renter occupied
Language usage in Beach Park
English speakers - Total 54.4% of residents of Beach Park speak English at home.
41.9% of residents speak Spanish at home 2,639 48.6% Speak English very well2,789 51.4% Speak English less than very well4.5% of residents speak other language at home 461 78.8% Speak English very well124 21.2% Speak English less than very well
English speakers - Born in the United States 72.0% of residents of Beach Park speak English at home.
31.6% of residents speak Spanish at home 660 85.7% Speak English very well110 14.3% Speak English less than very well
English speakers - Native, born elsewhere 0.8% of residents of Beach Park speak English at home.
91.1% of residents speak Spanish at home 67 14.6% Speak English very well392 85.4% Speak English less than very well
English speakers - Foreign-born 3.0% of residents of Beach Park speak English at home.
81.0% of residents speak Spanish at home 407 17.1% Speak English very well1,967 82.9% Speak English less than very well17.4% of residents speak other language at home 386 75.5% Speak English very well125 24.5% Speak English less than very well
White (Caucasian) - Speak only English Native:
74.9% (4,344)Foreign-born:
6.4% (39)
White (Caucasian) - Speak another language Native:
18.4% (1,068)Foreign-born:
86.3% (528)
Black or African American - Speak only English Native:
99.6% (1,680)Foreign-born:
99.6% (27)
Asian - Speak another language Native:
52.1% (71)Foreign-born:
100.0% (343)
Other race - Speak only English Native:
39.1% (479)Foreign-born:
2.3% (26)
Other race - Speak another language Native:
62.3% (764)Foreign-born:
93.5% (1,086)
Two or more races - Speak another language Native:
72.3% (988)Foreign-born:
100.0% (880)
White alone - Speak only English Native:
94.3% (4,106)Foreign-born:
11.9% (23)
White alone - Speak another language Native:
5.5% (239)Foreign-born:
87.1% (168)
Hispanic or Latino - Speak only English Native:
24.0% (887)Foreign-born:
2.0% (47)
Hispanic or Latino - Speak another language Native:
75.2% (2,782)Foreign-born:
96.0% (2,260)
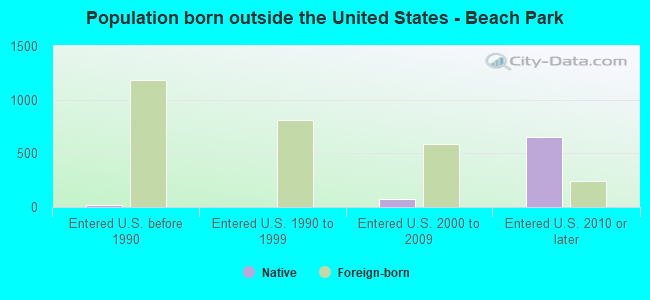
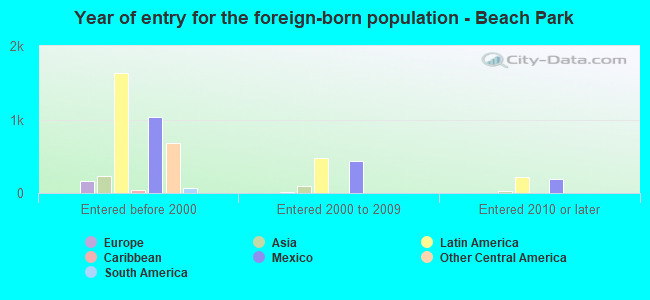
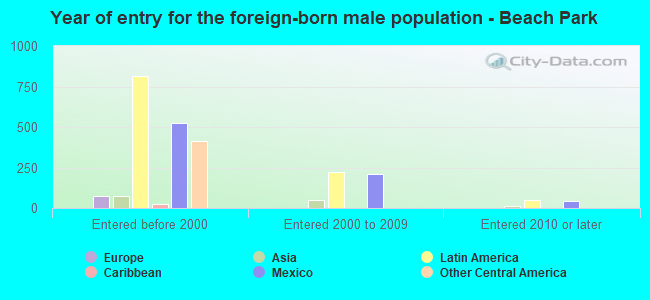
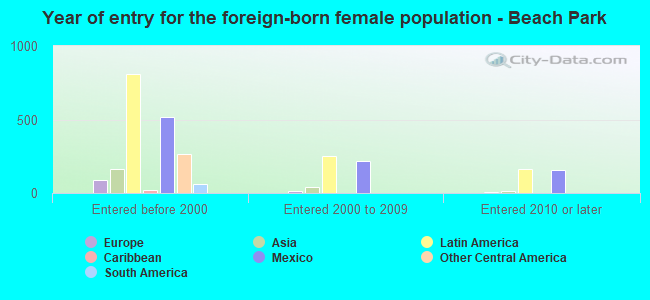
Foreign-born residents in Beach Park 2,839 residents are foreign born (16.3% Latin America , 2.8% Asia ).
This city:
20.4%Illinois:
14.1%
Marital status for residents in Beach Park Marital status - White (Caucasian) population 15 years and over
Males 20.6% Never married63.9% Now married2.3% Separated3.0% Widowed10.3% DivorcedFemales 21.6% Never married54.7% Now married3.0% Separated13.1% Widowed7.6% DivorcedWomen who gave birth in the past 12 months Now married:
100.0% (117)Unmarried:
0.0% (0)
Women who did not give birth in the past 12 months Now married:
56.8% (773)Unmarried:
43.2% (587)
Marital status - Black or African American population 15 years and over
Males 60.0% Never married32.4% Now married0.0% Separated0.0% Widowed7.7% DivorcedFemales 34.3% Never married23.5% Now married0.0% Separated6.6% Widowed35.6% DivorcedWomen who gave birth in the past 12 months Now married:
100.0% (12)Unmarried:
0.0% (0)
Women who did not give birth in the past 12 months Now married:
23.4% (86)Unmarried:
76.6% (283)
Marital status - American Indian / Alaska Native population 15 years and over
Males 0.0% Never married100.0% Now married0.0% Separated0.0% Widowed0.0% DivorcedFemales 0.0% Never married100.0% Now married0.0% Separated0.0% Widowed0.0% DivorcedMarital status - Asian population 15 years and over
Males 20.1% Never married79.9% Now married0.0% Separated0.0% Widowed0.0% DivorcedFemales 13.9% Never married65.2% Now married0.0% Separated9.4% Widowed11.5% DivorcedWomen who did not give birth in the past 12 months Now married:
42.9% (41)Unmarried:
57.1% (55)
Marital status - Other race population 15 years and over
Males 34.2% Never married61.2% Now married1.5% Separated3.1% Widowed0.0% DivorcedFemales 25.6% Never married65.0% Now married0.0% Separated7.5% Widowed1.8% DivorcedWomen who gave birth in the past 12 months Now married:
100.0% (20)Unmarried:
0.0% (0)
Women who did not give birth in the past 12 months Now married:
47.7% (181)Unmarried:
52.3% (198)
Marital status - Two or more races population 15 years and over
Males 24.1% Never married70.0% Now married5.9% Separated0.0% Widowed0.0% DivorcedFemales 65.4% Never married28.5% Now married0.0% Separated1.9% Widowed4.2% DivorcedWomen who gave birth in the past 12 months Now married:
52.1% (54)Unmarried:
47.9% (50)
Women who did not give birth in the past 12 months Now married:
13.5% (129)Unmarried:
86.5% (824)
Marital status - White alone, not Hispanic / Latino population 15 years and over
Males 18.7% Never married63.2% Now married2.2% Separated4.1% Widowed11.9% DivorcedFemales 16.0% Never married57.6% Now married1.7% Separated14.5% Widowed10.1% DivorcedWomen who did not give birth in the past 12 months Now married:
61.3% (523)Unmarried:
38.7% (330)
Marital status - Hispanic or Latino population 15 years and over
Males 28.9% Never married64.8% Now married2.8% Separated1.3% Widowed2.2% DivorcedFemales 39.3% Never married49.1% Now married2.3% Separated6.6% Widowed2.8% DivorcedWomen who gave birth in the past 12 months Now married:
84.8% (194)Unmarried:
15.2% (35)
Women who did not give birth in the past 12 months Now married:
38.9% (602)Unmarried:
61.1% (947)
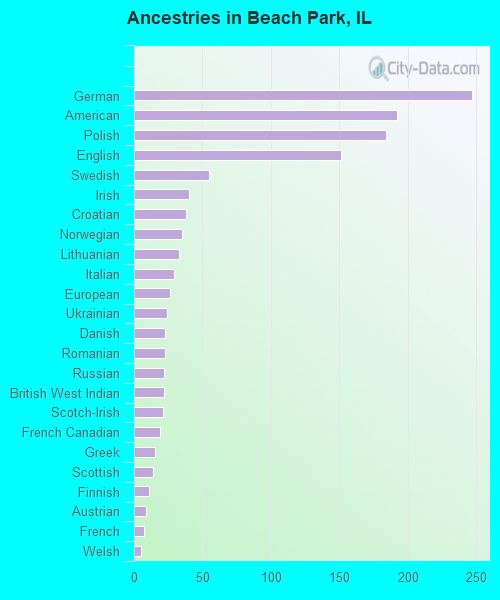
Ancestries in Beach Park
247 3.5% German192 2.7% American184 2.6% Polish151 2.2% English55 0.8% Swedish40 0.6% Irish38 0.5% Croatian35 0.5% Norwegian33 0.5% Lithuanian29 0.4% Italian26 0.4% European24 0.3% Ukrainian23 0.3% Danish23 0.3% Romanian22 0.3% Russian22 0.3% British West Indian21 0.3% Scotch-Irish19 0.3% French Canadian15 0.2% Greek14 0.2% Scottish11 0.2% Finnish9 0.1% Austrian7 0.1% French5 0.07% Welsh
Geographical mobility in Beach Park Same house 1 year ago 6,270 94.2% White (Caucasian)1,661 92.4% Black or African American140 99.7% American Indian / Alaska Native379 76.8% Asian2,432 95.4% Other race2,171 89.9% Two or more races4,568 95.5% White alone, not Hispanic / Latino6,089 95.2% Hispanic or LatinoMoved within same county 285 4.3% White / Caucasian212 11.8% Black or African American60 12.1% Asian12 0.5% Other race104 4.3% Two or more races123 2.6% White alone, not Hispanic / Latino201 3.1% Hispanic or LatinoMoved within same state 5 0.1% White / Caucasian13 0.7% Black or African American68 13.7% Asian127 5.3% Two or more races5 0.1% White alone, not Hispanic / Latino37 0.6% Hispanic or LatinoMoved from different state 49 0.7% White / Caucasian69 2.7% Other race54 1.1% White alone, not Hispanic / Latino70 1.1% Hispanic or Latino
Children Nativity (place of birth) in Beach Park
Children under 6 years - Living with two parents Both parents native 403 100.0% NativeBoth parents foreign-born 108 100.0% NativeOne native, one foreign-born parent 105 100.0% NativeChildren under 6 years - Living with one parent Native parent 240 100.0% NativeForeign-born parent 105 69.5% Native46 30.5% Foreign-bornChildren 6 to 17 years - Living with two parents Both parents native 925 100.0% NativeBoth parents foreign-born 577 100.0% NativeOne native, one foreign-born parent 230 100.0% NativeChildren 6 to 17 years - Living with one parent Native parent 432 100.0% NativeForeign-born parent 202 51.8% Native188 48.2% Foreign-born
Grandparents responsible for own grandchildren in Beach Park
Grandparents (30 to 59 years) White / Caucasian 70 100.0% Not responsible for grandchildrenBlack or African American 81 100.0% Responsible for grandchildrenWhite alone, not Hispanic / Latino 61 100.0% Not responsible for grandchildrenHispanic or Latino 17 100.0% Not responsible for grandchildren
Grandparents (60 years and over) White / Caucasian 10 100.0% Responsible for grandchildrenWhite alone, not Hispanic / Latino 13 100.0% Responsible for grandchildrenHispanic or Latino 164 100.0% Not responsible for grandchildren