Races in Bonadelle Ranchos-Madera Ranchos, California (CA) Detailed Stats
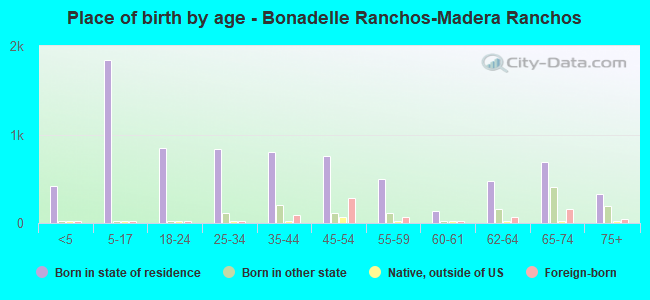
Ancestries, Foreign-born residents, place of birth
Settings
X


Discuss Bonadelle Ranchos-Madera Ranchos, California races on our local forum with over 2,400,000 registered users
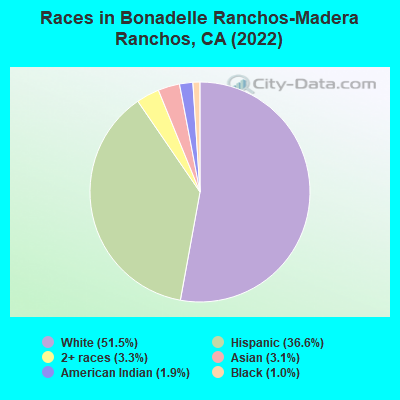
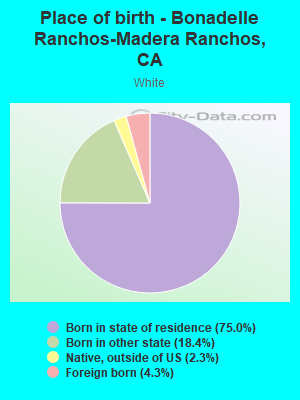
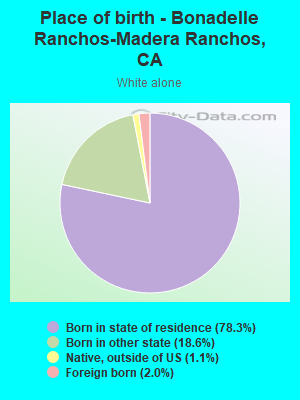
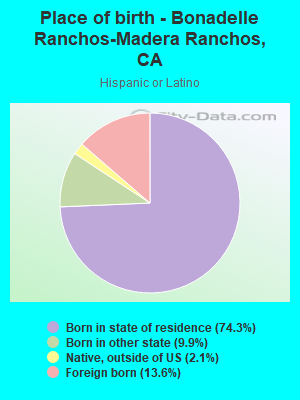
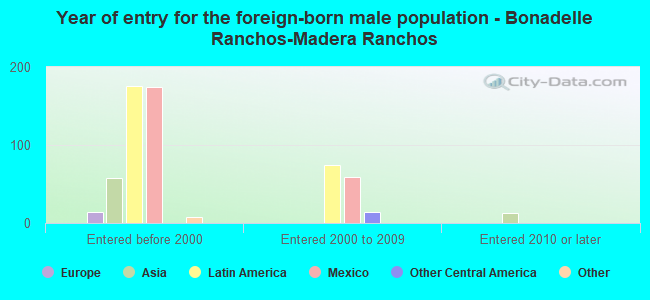
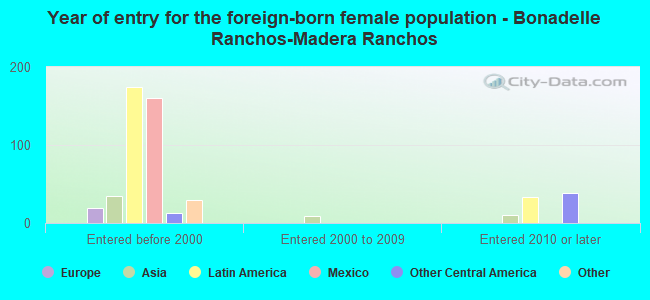
According to 2022 data, the most numerous races in Bonadelle Ranchos-Madera Ranchos, CA are Hispanic (3,526 residents), White alone (4,952 residents), and Asian alone (299 residents). 80.3% of Bonadelle Ranchos-Madera Ranchos residents speak English at home. 7.3% of Bonadelle Ranchos-Madera Ranchos, CA residents are foreign-born (5.2% born in Latin America, 1.3% born in Asia), which is 255.2% less than the foreign-born rate of 26.0% across the entire state of California.
Race distribution in Bonadelle Ranchos-Madera Ranchos
2000
2022

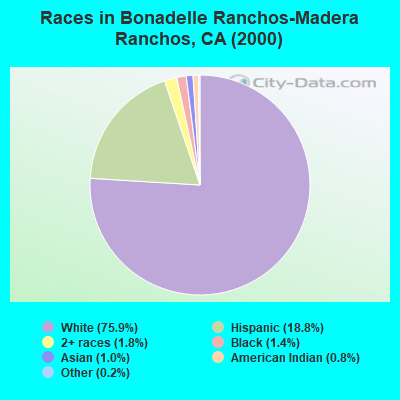
- 5,53875.9%White alone
- 1,37618.8%Hispanic
- 1301.8%Two or more races
- 1001.4%Black alone
- 751.0%Asian alone
- 580.8%American Indian alone
- 170.2%Other race alone
- 60.08%Native Hawaiian and Other
Pacific Islander alone
-
- 4,95251.5%White alone
- 3,52636.6%Hispanic
- 3183.3%Two or more races
- 2993.1%Asian alone
- 1821.9%American Indian alone
- 921.0%Black alone
2000
2022
-
- 15,816,79046.7%White alone
- 10,966,55632.4%Hispanic
- 3,648,86010.8%Asian alone
- 2,181,9266.4%Black alone
- 903,1152.7%Two or more races
- 178,9840.5%American Indian alone
- 103,7360.3%Native Hawaiian and Other
Pacific Islander alone - 71,6810.2%Other race alone

-
- 15,732,18440.3%Hispanic
- 13,160,42633.7%White alone
- 5,957,86715.3%Asian alone
- 2,025,2185.2%Black alone
- 1,663,2224.3%Two or more races
- 251,6180.6%Other race alone
- 135,7770.3%Native Hawaiian and Other
Pacific Islander alone - 103,0300.3%American Indian alone

Income and house value in Bonadelle Ranchos-Madera Ranchos
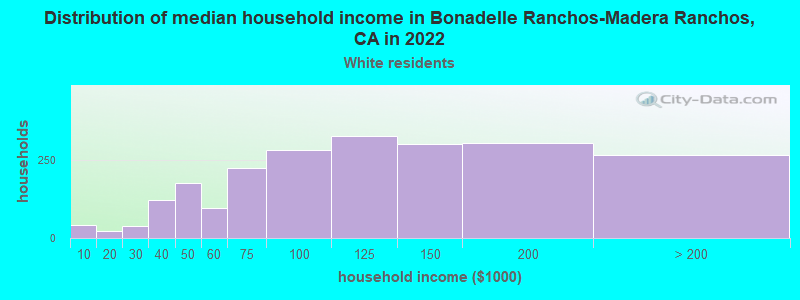
- Median household income in 2022
- $125,837White non-Hispanic householders
- $117,278Black householders
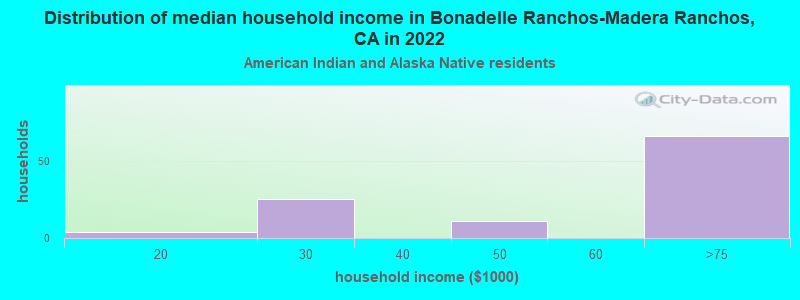
- $83,914American Indian and Alaska Native householders
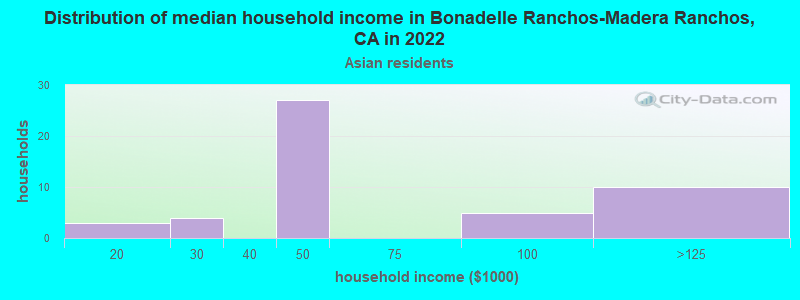
- $55,110Asian householders
- $191,279Native Hawaiian and other Pacific Islander householders
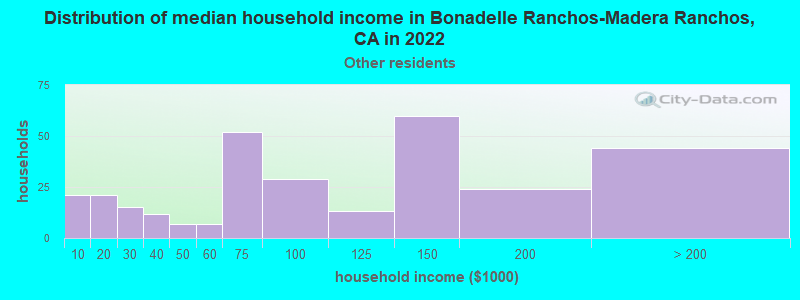
- $102,745Some other race householders
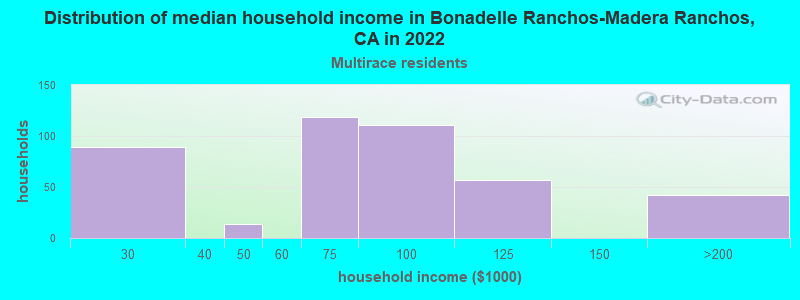
- $92,577Two or more races householders
- $96,740Hispanic or Latino race householders
- Median 2022 house value
- $488,424White Non-Hispanic householders
- $584,885Black or African American householders
- over $1,000,000American Indian or Alaska Native householders
- $551,052Asian householders
- $674,868Native Hawaiian and other Pacific Islander householders
- $504,981Some other race householders
- $404,920Two or more races householders
- $484,105Hispanic or Latino householders
Household income for White non-Hispanic householders
Household income for American Indian and Alaska Native householders
Household income for Asian householders
Household income for Some other race householders
Household income for Two or more races householders
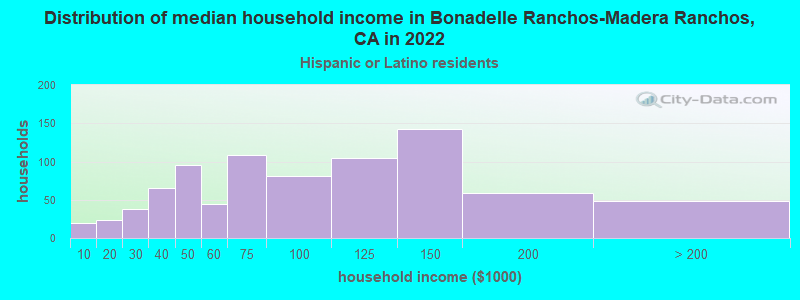
Household income for Hispanic or Latino race householders
Median age by race in Bonadelle Ranchos-Madera Ranchos
- 46.9Median age for White residents
- 44.6Males
- 47.7Females
- 43.5Median age for Black or African American residents
- 48.0Males
- 40.9Females
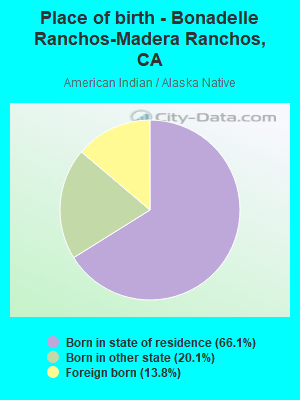
- 28.2Median age for American Indian / Alaska Native residents
- 17.9Males
- 31.3Females
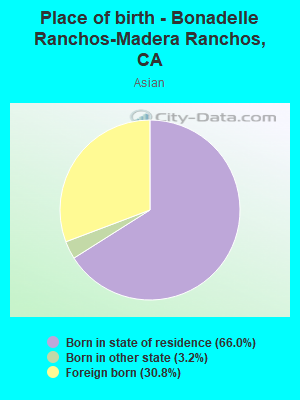
- 23.0Median age for Asian residents
- 16.8Males
- 38.5Females
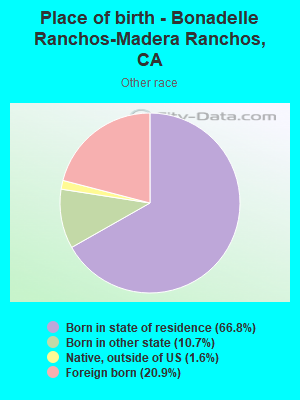
- 51.7Median age for Other race residents
- 43.8Males
- 56.0Females
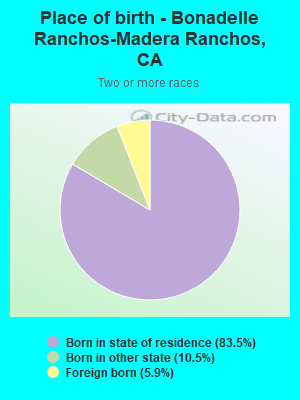
- 49.9Median age for Two or more races residents
- 73.5Males
- 56.5Females
- 49.2Median age for White alone residents
- 50.4Males
- 47.9Females
- 30.3Median age for Hispanic or Latino residents
- 29.4Males
- 33.6Females
Owner/renter occupied households by race in Bonadelle Ranchos-Madera Ranchos
- House owners and renters - White residents
- 1,89988.8%Owner occupied
- 24111.2%Renter occupied
- House owners and renters - Black or African American residents
- 8100.0%Owner occupied
- House owners and renters - American Indian / Alaska Native residents
- 120100.0%Owner occupied
- House owners and renters - Asian residents
- 7091.3%Owner occupied
- 78.7%Renter occupied
- House owners and renters - Other race residents
- 28287.1%Owner occupied
- 4212.9%Renter occupied
- House owners and renters - Two or more races residents
- 47296.8%Owner occupied
- 163.2%Renter occupied
- House owners and renters - White alone residents
- 1,63988.4%Owner occupied
- 21411.6%Renter occupied
- House owners and renters - Hispanic or Latino residents
- 69485.0%Owner occupied
- 12315.0%Renter occupied
Language usage in Bonadelle Ranchos-Madera Ranchos
- English speakers - Total
- 80.3% of residents of Bonadelle Ranchos-Madera Ranchos speak English at home.
- 17.2% of residents speak Spanish at home
- 1,12671.6%Speak English very well
- 44728.4%Speak English less than very well
- 2.8% of residents speak other language at home
- 21685.0%Speak English very well
- 3815.0%Speak English less than very well
- English speakers - Born in the United States
- 83.6% of residents of Bonadelle Ranchos-Madera Ranchos speak English at home.
- 14.8% of residents speak Spanish at home
- 18087.4%Speak English very well
- 2612.6%Speak English less than very well
- 1.4% of residents speak other language at home
- 1263.2%Speak English very well
- 736.8%Speak English less than very well
- English speakers - Native, born elsewhere
- 53.5% of residents of Bonadelle Ranchos-Madera Ranchos speak English at home.
- 46.5% of residents speak Spanish at home
- 915.3%Speak English very well
- 5084.7%Speak English less than very well
- English speakers - Foreign-born
- 15.4% of residents of Bonadelle Ranchos-Madera Ranchos speak English at home.
- 61.5% of residents speak Spanish at home
- 18443.2%Speak English very well
- 24256.8%Speak English less than very well
- 22.8% of residents speak other language at home
- 12780.4%Speak English very well
- 3119.6%Speak English less than very well
White (Caucasian) - Speak only English
| Native: | 95.6% (5,725) |
| Foreign-born: | 15.4% (43) |
White (Caucasian) - Speak another language
| Native: | 8.5% (511) |
| Foreign-born: | 80.6% (225) |
American Indian / Alaska Native - Speak another language
| Native: | 44.6% (124) |
| Foreign-born: | 100.0% (49) |
Asian - Speak another language
| Native: | 43.2% (79) |
| Foreign-born: | 98.4% (96) |
Other race - Speak only English
| Native: | 58.4% (431) |
| Foreign-born: | 26.7% (41) |
Other race - Speak another language
| Native: | 45.0% (332) |
| Foreign-born: | 81.4% (125) |
White alone - Speak only English
| Native: | 98.8% (4,589) |
| Foreign-born: | 45.7% (45) |
White alone - Speak another language
| Native: | 1.0% (47) |
| Foreign-born: | 53.5% (53) |
Hispanic or Latino - Speak only English
| Native: | 65.2% (1,961) |
| Foreign-born: | 13.9% (66) |
Hispanic or Latino - Speak another language
| Native: | 36.8% (1,107) |
| Foreign-born: | 88.5% (418) |
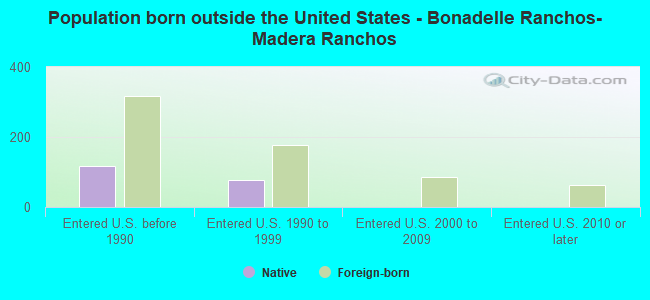
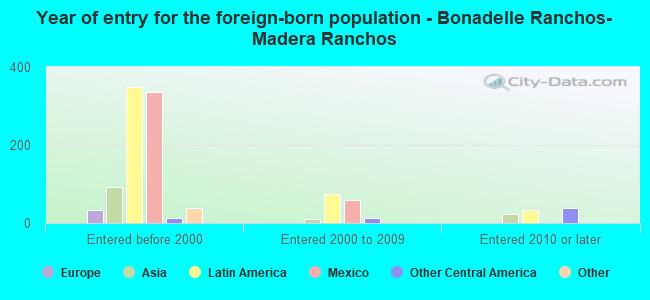
Foreign-born residents in Bonadelle Ranchos-Madera Ranchos
709 residents are foreign born (5.2% Latin America, 1.3% Asia).
| This city: | 7.3% |
| California: | 100.0% |
Marital status for residents in Bonadelle Ranchos-Madera Ranchos
Marital status - White (Caucasian) population 15 years and over
- Males
- 26.6%Never married
- 63.7%Now married
- 2.1%Separated
- 1.4%Widowed
- 6.2%Divorced
- Females
- 20.0%Never married
- 65.2%Now married
- 0.7%Separated
- 6.0%Widowed
- 8.0%Divorced
Women who gave birth in the past 12 months
| Now married: | 100.0% (20) |
| Unmarried: | 0.0% (0) |
Women who did not give birth in the past 12 months
| Now married: | 52.3% (668) |
| Unmarried: | 47.7% (609) |
Marital status - Black or African American population 15 years and over
- Males
- 37.0%Never married
- 33.3%Now married
- 0.0%Separated
- 0.0%Widowed
- 29.6%Divorced
- Females
- 0.0%Never married
- 88.2%Now married
- 0.0%Separated
- 0.0%Widowed
- 11.8%Divorced
Women who did not give birth in the past 12 months
| Now married: | 100.0% (56) |
| Unmarried: | 0.0% (0) |
Marital status - American Indian / Alaska Native population 15 years and over
- Males
- 58.2%Never married
- 28.6%Now married
- 0.0%Separated
- 13.2%Widowed
- 0.0%Divorced
- Females
- 64.3%Never married
- 5.2%Now married
- 14.9%Separated
- 5.8%Widowed
- 9.7%Divorced
Women who did not give birth in the past 12 months
| Now married: | 0.0% (0) |
| Unmarried: | 100.0% (144) |
Marital status - Asian population 15 years and over
- Males
- 35.5%Never married
- 57.3%Now married
- 0.0%Separated
- 0.0%Widowed
- 7.3%Divorced
- Females
- 21.7%Never married
- 68.3%Now married
- 0.0%Separated
- 3.3%Widowed
- 6.7%Divorced
Women who did not give birth in the past 12 months
| Now married: | 70.7% (42) |
| Unmarried: | 29.3% (18) |
Marital status - Other race population 15 years and over
- Males
- 35.4%Never married
- 62.3%Now married
- 2.3%Separated
- 0.0%Widowed
- 0.0%Divorced
- Females
- 17.8%Never married
- 67.8%Now married
- 14.3%Separated
- 0.0%Widowed
- 0.0%Divorced
Women who did not give birth in the past 12 months
| Now married: | 60.5% (98) |
| Unmarried: | 39.5% (64) |
Marital status - Two or more races population 15 years and over
- Males
- 6.1%Never married
- 54.4%Now married
- 0.0%Separated
- 30.7%Widowed
- 8.8%Divorced
- Females
- 12.0%Never married
- 48.2%Now married
- 0.0%Separated
- 0.0%Widowed
- 39.8%Divorced
Women who did not give birth in the past 12 months
| Now married: | 0.0% (0) |
| Unmarried: | 100.0% (91) |
Marital status - White alone, not Hispanic / Latino population 15 years and over
- Males
- 18.2%Never married
- 68.2%Now married
- 3.1%Separated
- 2.1%Widowed
- 8.4%Divorced
- Females
- 12.9%Never married
- 72.2%Now married
- 0.3%Separated
- 5.0%Widowed
- 9.6%Divorced
Women who gave birth in the past 12 months
| Now married: | 100.0% (11) |
| Unmarried: | 0.0% (0) |
Women who did not give birth in the past 12 months
| Now married: | 62.2% (593) |
| Unmarried: | 37.8% (361) |
Marital status - Hispanic or Latino population 15 years and over
- Males
- 41.8%Never married
- 56.4%Now married
- 0.5%Separated
- 0.0%Widowed
- 1.3%Divorced
- Females
- 33.1%Never married
- 50.9%Now married
- 4.6%Separated
- 6.8%Widowed
- 4.6%Divorced
Women who gave birth in the past 12 months
| Now married: | 100.0% (14) |
| Unmarried: | 0.0% (0) |
Women who did not give birth in the past 12 months
| Now married: | 37.0% (290) |
| Unmarried: | 63.0% (492) |
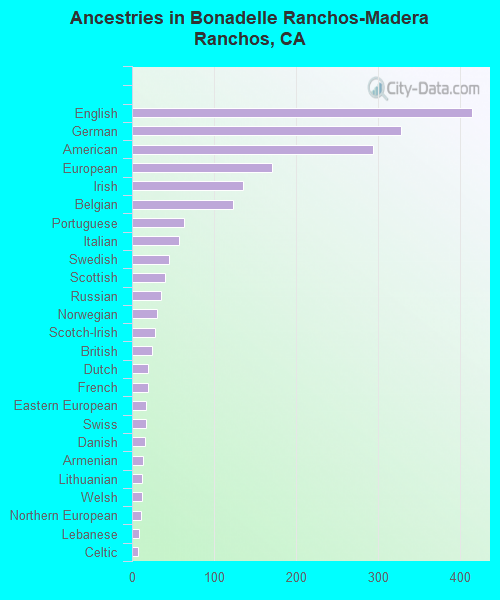
Ancestries in Bonadelle Ranchos-Madera Ranchos

- 4158.1%English
- 3286.4%German
- 2945.7%American
- 1713.3%European
- 1352.6%Irish
- 1232.4%Belgian
- 641.2%Portuguese
- 571.1%Italian
- 450.9%Swedish
- 400.8%Scottish
- 350.7%Russian
- 300.6%Norwegian
- 280.5%Scotch-Irish
- 250.5%British
- 190.4%Dutch
- 190.4%French
- 170.3%Eastern European
- 170.3%Swiss
- 160.3%Danish
- 130.3%Armenian
- 120.2%Lithuanian
- 120.2%Welsh
- 110.2%Northern European
- 80.2%Lebanese
- 70.1%Celtic
- 70.1%Hungarian
- 50.10%Slovene
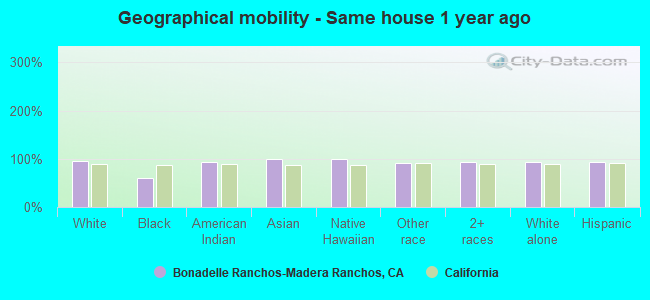
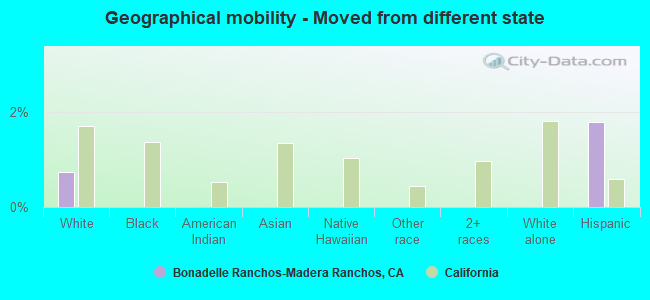
Geographical mobility in Bonadelle Ranchos-Madera Ranchos

- Same house 1 year ago
- 6,06094.7%White (Caucasian)
- 6161.3%Black or African American
- 31593.3%American Indian / Alaska Native
- 31199.5%Asian
- 36100.0%Native Hawaiian / Pacific Islander
- 65591.2%Other race
- 86993.7%Two or more races
- 4,74994.3%White alone, not Hispanic / Latino
- 3,21493.1%Hispanic or Latino
-
- Moved within same county
- 1502.4%White / Caucasian
- 87.7%Black or African American
- 257.5%American Indian / Alaska Native
- 101.4%Other race
- 1242.5%White alone, not Hispanic / Latino
- 972.8%Hispanic or Latino
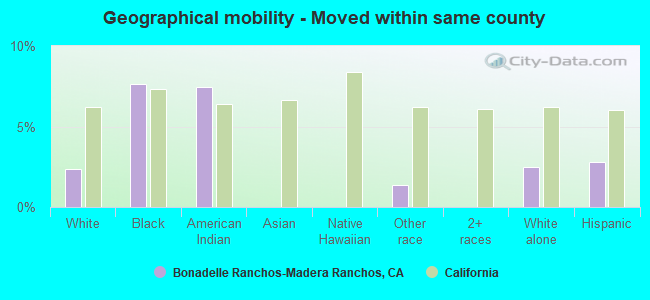
-
- Moved within same state
- 2213.5%White / Caucasian
- 3131.4%Black or African American
- 82.7%Asian
- 608.3%Other race
- 768.2%Two or more races
- 2114.2%White alone, not Hispanic / Latino
- 1043.0%Hispanic or Latino
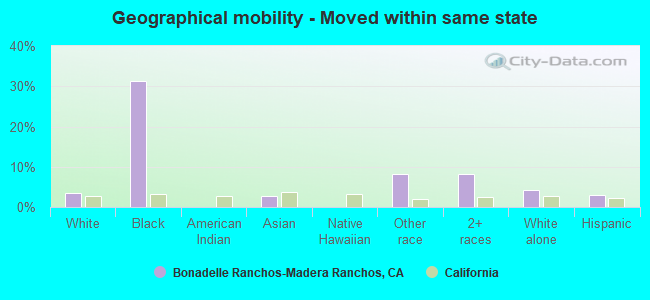
-
- Moved from different state
- 480.7%White / Caucasian
- 621.8%Hispanic or Latino
Children Nativity (place of birth) in Bonadelle Ranchos-Madera Ranchos
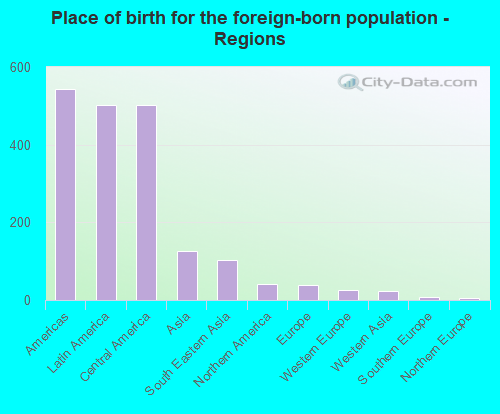
Place of birth for residents in Bonadelle Ranchos-Madera Ranchos
![Place of birth for the foreign-born population - Regions]()
- 543Americas
- 502Latin America
- 502Central America
- 126Asia
- 102South Eastern Asia
- 41Northern America
- 38Europe
- 25Western Europe
- 24Western Asia
- 8Southern Europe
- 5Northern Europe
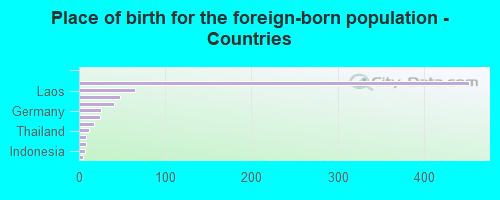
![Place of birth for the foreign-born population - Countries]()
- 453Mexico
- 65Laos
- 48El Salvador
- 41Canada
- 25Germany
- 24Lebanon
- 17Cambodia
- 12Thailand
- 8Portugal
- 8Azores Islands
- 7Indonesia
- 5Sweden
Grandparents responsible for own grandchildren in Bonadelle Ranchos-Madera Ranchos
Zip codes: 93636.