Races in Bonita, California (CA) Detailed Stats
Data:
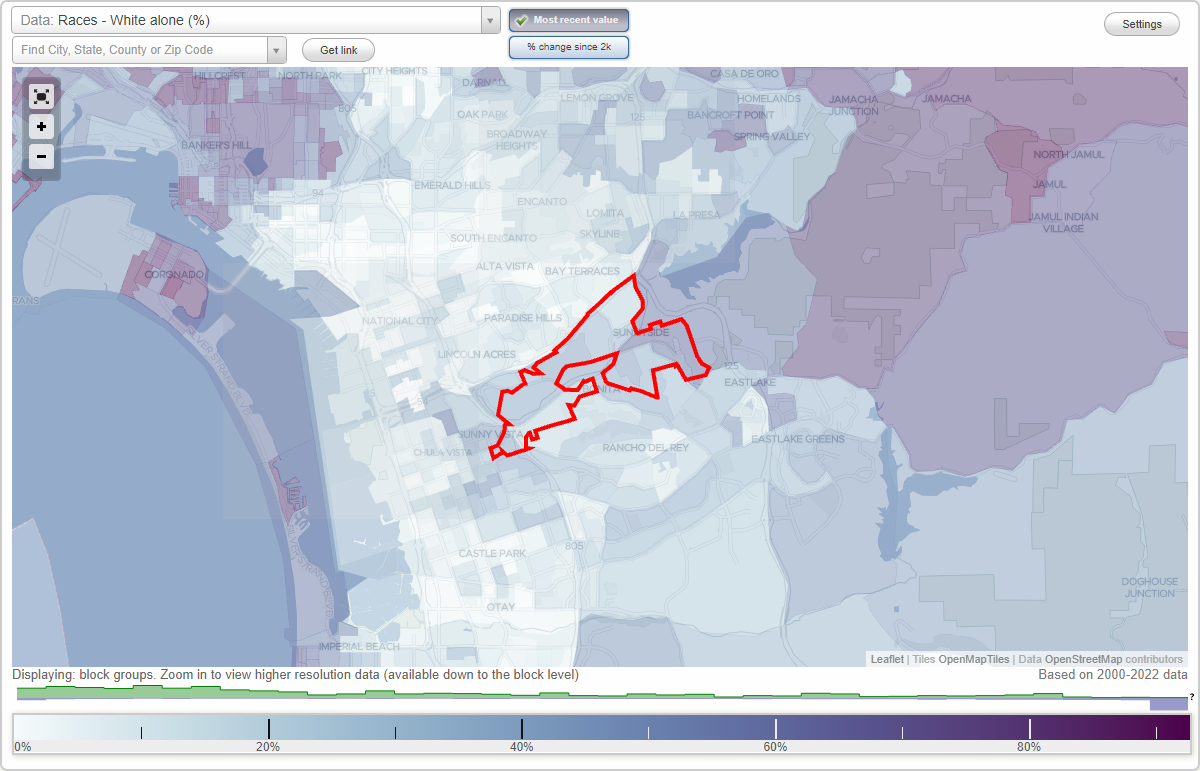
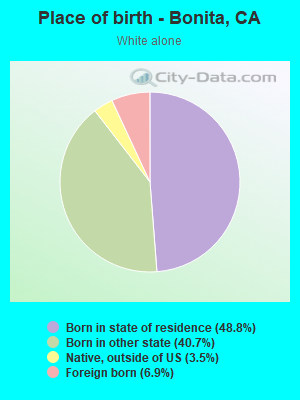
Races - White alone (%)
Races - White alone (% change since 2000)
Races - Black alone (%)
Races - Black alone (% change since 2000)
Races - American Indian alone (%)
Races - American Indian alone (% change since 2000)
Races - Asian alone (%)
Races - Asian alone (% change since 2000)
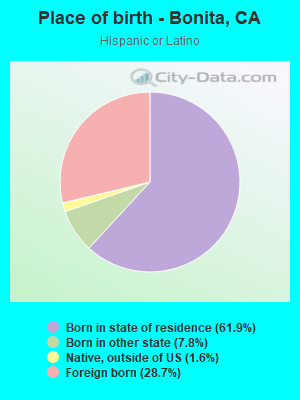
Races - Hispanic (%)
Races - Hispanic (% change since 2000)
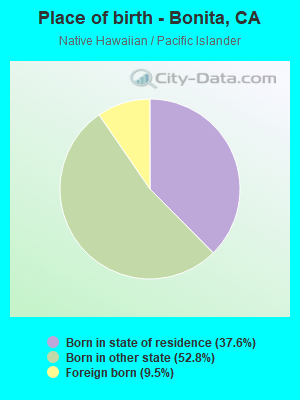
Races - Native Hawaiian and Other Pacific Islander alone (%)
Races - Native Hawaiian and Other Pacific Islander alone (% change since 2000)
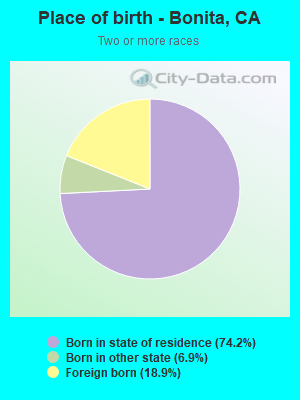
Races - Two or more races(%)
Races - Two or more races(% change since 2000)
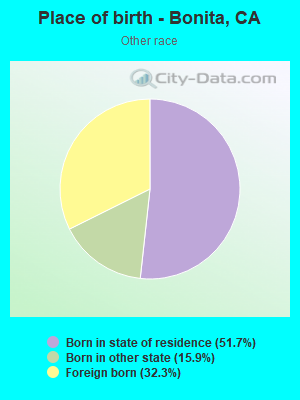
Races - Other race alone (%)
Races - Other race alone (% change since 2000)
Racial diversity
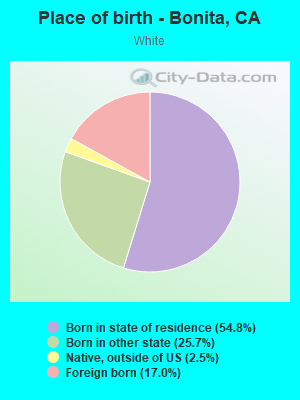
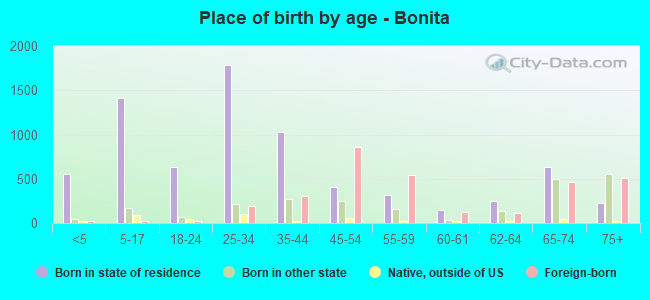
Place of birth - Born in state of residence (%)
Place of birth - Born in state of residence (%) - White
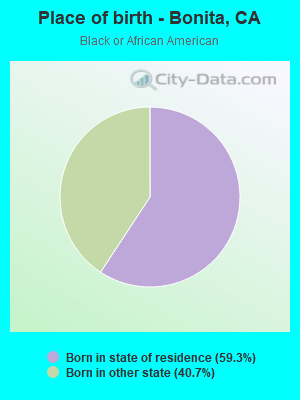
Place of birth - Born in state of residence (%) - Black or African American
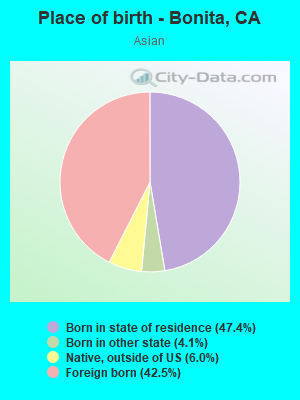
Place of birth - Born in state of residence (%) - Asian
Place of birth - Born in state of residence (%) - Hispanic or Latino
Place of birth - Born in state of residence (%) - American Indian and Alaska Native
Place of birth - Born in state of residence (%) - Multirace
Place of birth - Born in state of residence (%) - Other Race
Place of birth - Born in other state (%)
Place of birth - Born in other state (%) - White
Place of birth - Born in other state (%) - Black or African American
Place of birth - Born in other state (%) - Asian
Place of birth - Born in other state (%) - Hispanic or Latino
Place of birth - Born in other state (%) - American Indian and Alaska Native
Place of birth - Born in other state (%) - Multirace
Place of birth - Born in other state (%) - Other Race
Place of birth - Native, outside of US (%)
Place of birth - Native, outside of US (%) - White
Place of birth - Native, outside of US (%) - Black or African American
Place of birth - Native, outside of US (%) - Asian
Place of birth - Native, outside of US (%) - Hispanic or Latino
Place of birth - Native, outside of US (%) - American Indian and Alaska Native
Place of birth - Native, outside of US (%) - Multirace
Place of birth - Native, outside of US (%) - Other Race
Place of birth - Foreign born (%)
Place of birth - Foreign born (%) - White
Place of birth - Foreign born (%) - Black or African American
Place of birth - Foreign born (%) - Asian
Place of birth - Foreign born (%) - Hispanic or Latino
Place of birth - Foreign born (%) - American Indian and Alaska Native
Place of birth - Foreign born (%) - Multirace
Place of birth - Foreign born (%) - Other Race
Residents speaking English at home (%)
Residents speaking English at home - Born in the United States (%)
Residents speaking English at home - Native, born elsewhere (%)
Residents speaking English at home - Foreign born (%)
Residents speaking Spanish at home (%)
Residents speaking Spanish at home - Born in the United States (%)
Residents speaking Spanish at home - Native, born elsewhere (%)
Residents speaking Spanish at home - Foreign born (%)
Residents speaking other language at home (%)
Residents speaking other language at home - Born in the United States (%)
Residents speaking other language at home - Native, born elsewhere (%)
Residents speaking other language at home - Foreign born (%)
Marital status - Never married (%)
Marital status - Now married (%)
Marital status - Separated (%)
Marital status - Widowed (%)
Marital status - Divorced (%)
Ancestries Reported - Arab (%)
Ancestries Reported - Czech (%)
Ancestries Reported - Danish (%)
Ancestries Reported - Dutch (%)
Ancestries Reported - English (%)
Ancestries Reported - French (%)
Ancestries Reported - French Canadian (%)
Ancestries Reported - German (%)
Ancestries Reported - Greek (%)
Ancestries Reported - Hungarian (%)
Ancestries Reported - Irish (%)
Ancestries Reported - Italian (%)
Ancestries Reported - Lithuanian (%)
Ancestries Reported - Norwegian (%)
Ancestries Reported - Polish (%)
Ancestries Reported - Portuguese (%)
Ancestries Reported - Russian (%)
Ancestries Reported - Scotch-Irish (%)
Ancestries Reported - Scottish (%)
Ancestries Reported - Slovak (%)
Ancestries Reported - Subsaharan African (%)
Ancestries Reported - Swedish (%)
Ancestries Reported - Swiss (%)
Ancestries Reported - Ukrainian (%)
Ancestries Reported - United States (%)
Ancestries Reported - Welsh (%)
Ancestries Reported - West Indian (%)
Ancestries Reported - Other (%)
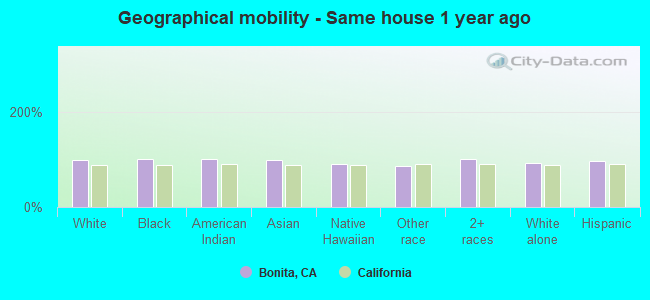
Geographical mobility - Same house 1 year ago (%)
Geographical mobility - Same house 1 year ago (%) - White
Geographical mobility - Same house 1 year ago (%) - Black or African American
Geographical mobility - Same house 1 year ago (%) - Asian
Geographical mobility - Same house 1 year ago (%) - Hispanic or Latino
Geographical mobility - Same house 1 year ago (%) - American Indian and Alaska Native
Geographical mobility - Same house 1 year ago (%) - Multirace
Geographical mobility - Same house 1 year ago (%) - Other Race
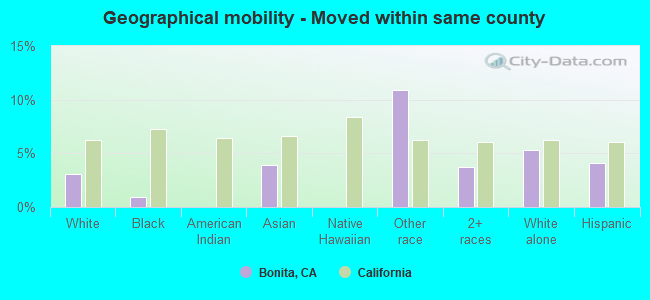
Geographical mobility - Moved within same county (%)
Geographical mobility - Moved within same county (%) - White
Geographical mobility - Moved within same county (%) - Black or African American
Geographical mobility - Moved within same county (%) - Asian
Geographical mobility - Moved within same county (%) - Hispanic or Latino
Geographical mobility - Moved within same county (%) - American Indian and Alaska Native
Geographical mobility - Moved within same county (%) - Multirace
Geographical mobility - Moved within same county (%) - Other Race
Geographical mobility - Moved from different county within same state (%)
Geographical mobility - Moved from different county within same state (%) - White
Geographical mobility - Moved from different county within same state (%) - Black or African American
Geographical mobility - Moved from different county within same state (%) - Asian
Geographical mobility - Moved from different county within same state (%) - Hispanic or Latino
Geographical mobility - Moved from different county within same state (%) - American Indian and Alaska Native
Geographical mobility - Moved from different county within same state (%) - Multirace
Geographical mobility - Moved from different county within same state (%) - Other Race
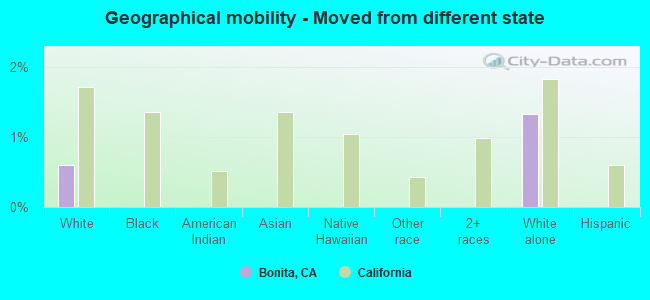
Geographical mobility - Moved from different state (%)
Geographical mobility - Moved from different state (%) - White
Geographical mobility - Moved from different state (%) - Black or African American
Geographical mobility - Moved from different state (%) - Asian
Geographical mobility - Moved from different state (%) - Hispanic or Latino
Geographical mobility - Moved from different state (%) - American Indian and Alaska Native
Geographical mobility - Moved from different state (%) - Multirace
Geographical mobility - Moved from different state (%) - Other Race
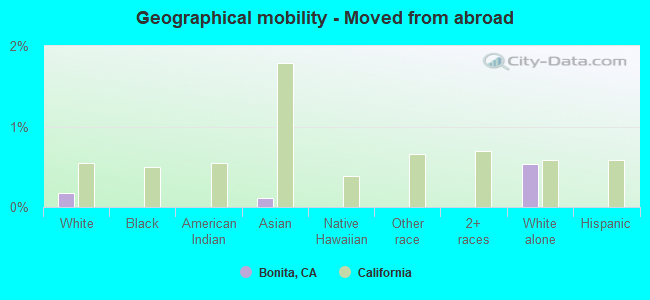
Geographical mobility - Moved from abroad (%)
Geographical mobility - Moved from abroad (%) - White
Geographical mobility - Moved from abroad (%) - Black or African American
Geographical mobility - Moved from abroad (%) - Asian
Geographical mobility - Moved from abroad (%) - Hispanic or Latino
Geographical mobility - Moved from abroad (%) - American Indian and Alaska Native
Geographical mobility - Moved from abroad (%) - Multirace
Geographical mobility - Moved from abroad (%) - Other Race
Place of birth for the foreign-born population - Ireland (%)
Place of birth for the foreign-born population - Denmark (%)
Place of birth for the foreign-born population - Norway (%)
Place of birth for the foreign-born population - Sweden (%)
Place of birth for the foreign-born population - United Kingdom (%)
Place of birth for the foreign-born population - England (%)
Place of birth for the foreign-born population - Scotland (%)
Place of birth for the foreign-born population - Other Northern Europe (%)
Place of birth for the foreign-born population - Austria (%)
Place of birth for the foreign-born population - Belgium (%)
Place of birth for the foreign-born population - France (%)
Place of birth for the foreign-born population - Germany (%)
Place of birth for the foreign-born population - Netherlands (%)
Place of birth for the foreign-born population - Switzerland (%)
Place of birth for the foreign-born population - Other Western Europe (%)
Place of birth for the foreign-born population - Greece (%)
Place of birth for the foreign-born population - Italy (%)
Place of birth for the foreign-born population - Portugal (%)
Place of birth for the foreign-born population - Spain (%)
Place of birth for the foreign-born population - Other Southern Europe (%)
Place of birth for the foreign-born population - Albania (%)
Place of birth for the foreign-born population - Belarus (%)
Place of birth for the foreign-born population - Bosnia and Herzegovina (%)
Place of birth for the foreign-born population - Bulgaria (%)
Place of birth for the foreign-born population - Croatia (%)
Place of birth for the foreign-born population - Czechoslovakia (%)
Place of birth for the foreign-born population - Hungary (%)
Place of birth for the foreign-born population - Latvia (%)
Place of birth for the foreign-born population - Lithuania (%)
Place of birth for the foreign-born population - North Macedonia (Macedonia) (%)
Place of birth for the foreign-born population - Moldova (%)
Place of birth for the foreign-born population - Poland (%)
Place of birth for the foreign-born population - Romania (%)
Place of birth for the foreign-born population - Russia (%)
Place of birth for the foreign-born population - Serbia (%)
Place of birth for the foreign-born population - Ukraine (%)
Place of birth for the foreign-born population - Other Eastern Europe (%)
Place of birth for the foreign-born population - China (%)
Place of birth for the foreign-born population - Hong Kong (%)
Place of birth for the foreign-born population - Taiwan (%)
Place of birth for the foreign-born population - Japan (%)
Place of birth for the foreign-born population - Korea (%)
Place of birth for the foreign-born population - Other Eastern Asia (%)
Place of birth for the foreign-born population - Afghanistan (%)
Place of birth for the foreign-born population - Bangladesh (%)
Place of birth for the foreign-born population - India (%)
Place of birth for the foreign-born population - Iran (%)
Place of birth for the foreign-born population - Kazakhstan (%)
Place of birth for the foreign-born population - Nepal (%)
Place of birth for the foreign-born population - Pakistan (%)
Place of birth for the foreign-born population - Sri Lanka (%)
Place of birth for the foreign-born population - Uzbekistan (%)
Place of birth for the foreign-born population - Other South Central Asia (%)
Place of birth for the foreign-born population - Burma (%)
Place of birth for the foreign-born population - Cambodia (%)
Place of birth for the foreign-born population - Indonesia (%)
Place of birth for the foreign-born population - Laos (%)
Place of birth for the foreign-born population - Malaysia (%)
Place of birth for the foreign-born population - Philippines (%)
Place of birth for the foreign-born population - Singapore (%)
Place of birth for the foreign-born population - Thailand (%)
Place of birth for the foreign-born population - Vietnam (%)
Place of birth for the foreign-born population - Other South Eastern Asia (%)
Place of birth for the foreign-born population - Armenia (%)
Place of birth for the foreign-born population - Iraq (%)
Place of birth for the foreign-born population - Israel (%)
Place of birth for the foreign-born population - Jordan (%)
Place of birth for the foreign-born population - Kuwait (%)
Place of birth for the foreign-born population - Lebanon (%)
Place of birth for the foreign-born population - Saudi Arabia (%)
Place of birth for the foreign-born population - Syria (%)
Place of birth for the foreign-born population - Turkey (%)
Place of birth for the foreign-born population - Yemen (%)
Place of birth for the foreign-born population - Other Western Asia (%)
Place of birth for the foreign-born population - Eritrea (%)
Place of birth for the foreign-born population - Ethiopia (%)
Place of birth for the foreign-born population - Kenya (%)
Place of birth for the foreign-born population - Somalia (%)
Place of birth for the foreign-born population - Uganda (%)
Place of birth for the foreign-born population - Zimbabwe (%)
Place of birth for the foreign-born population - Other Eastern Africa (%)
Place of birth for the foreign-born population - Cameroon (%)
Place of birth for the foreign-born population - Congo (%)
Place of birth for the foreign-born population - Democratic Republic of Congo (Zaire) (%)
Place of birth for the foreign-born population - Other Middle Africa (%)
Place of birth for the foreign-born population - Egypt (%)
Place of birth for the foreign-born population - Morocco (%)
Place of birth for the foreign-born population - Sudan (%)
Place of birth for the foreign-born population - Other Northern Africa (%)
Place of birth for the foreign-born population - South Africa (%)
Place of birth for the foreign-born population - Other Southern Africa (%)
Place of birth for the foreign-born population - Cabo Verde (%)
Place of birth for the foreign-born population - Ghana (%)
Place of birth for the foreign-born population - Liberia (%)
Place of birth for the foreign-born population - Nigeria (%)
Place of birth for the foreign-born population - Senegal (%)
Place of birth for the foreign-born population - Sierra Leone (%)
Place of birth for the foreign-born population - Other Western Africa (%)
Place of birth for the foreign-born population - Australia (%)
Place of birth for the foreign-born population - New Zealand (%)
Place of birth for the foreign-born population - Fiji (%)
Place of birth for the foreign-born population - Micronesia (%)
Place of birth for the foreign-born population - Bahamas (%)
Place of birth for the foreign-born population - Barbados (%)
Place of birth for the foreign-born population - Cuba (%)
Place of birth for the foreign-born population - Dominica (%)
Place of birth for the foreign-born population - Dominican Republic (%)
Place of birth for the foreign-born population - Grenada (%)
Place of birth for the foreign-born population - Haiti (%)
Place of birth for the foreign-born population - Jamaica (%)
Place of birth for the foreign-born population - St. Vincent and the Grenadines (%)
Place of birth for the foreign-born population - Trinidad and Tobago (%)
Place of birth for the foreign-born population - West Indies (%)
Place of birth for the foreign-born population - Other Caribbean (%)
Place of birth for the foreign-born population - Belize (%)
Place of birth for the foreign-born population - Costa Rica (%)
Place of birth for the foreign-born population - El Salvador (%)
Place of birth for the foreign-born population - Guatemala (%)
Place of birth for the foreign-born population - Honduras (%)
Place of birth for the foreign-born population - Mexico (%)
Place of birth for the foreign-born population - Nicaragua (%)
Place of birth for the foreign-born population - Panama (%)
Place of birth for the foreign-born population - Other Central America (%)
Place of birth for the foreign-born population - Argentina (%)
Place of birth for the foreign-born population - Bolivia (%)
Place of birth for the foreign-born population - Brazil (%)
Place of birth for the foreign-born population - Chile (%)
Place of birth for the foreign-born population - Colombia (%)
Place of birth for the foreign-born population - Ecuador (%)
Place of birth for the foreign-born population - Guyana (%)
Place of birth for the foreign-born population - Peru (%)
Place of birth for the foreign-born population - Uruguay (%)
Place of birth for the foreign-born population - Venezuela (%)
Place of birth for the foreign-born population - Other South America (%)
Place of birth for the foreign-born population - Canada (%)
Place of birth for the foreign-born population - Other Northern America (%)
Place of birth for the foreign-born population - Other (%)
Latest news about races in Bonita, CA collected exclusively by city-data.com from local newspapers, TV, and radio stations
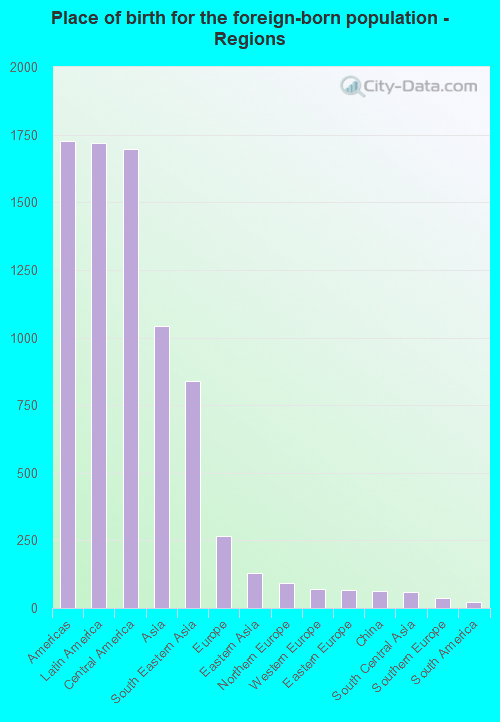
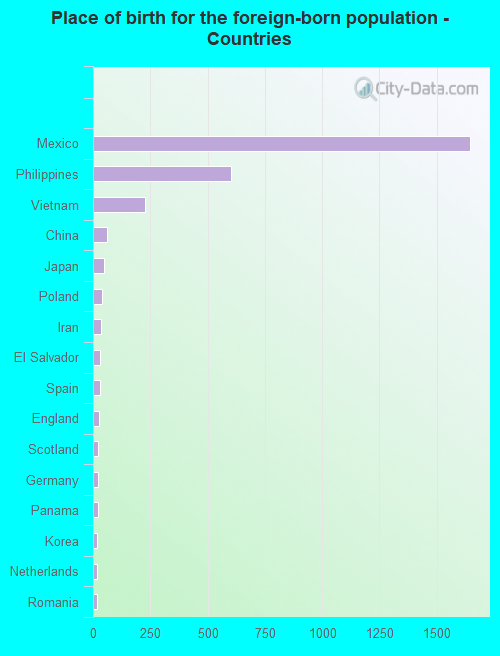
According to 2022 data, the most numerous races in Bonita, CA are Hispanic (6,063 residents), White alone (3,935 residents), and Asian alone (1,899 residents). 54.1% of Bonita residents speak English at home. 23.7% of Bonita, CA residents are foreign-born (13.4% born in Latin America, 8.1% born in Asia), which is 9.6% less than the foreign-born rate of 26.0% across the entire state of California.
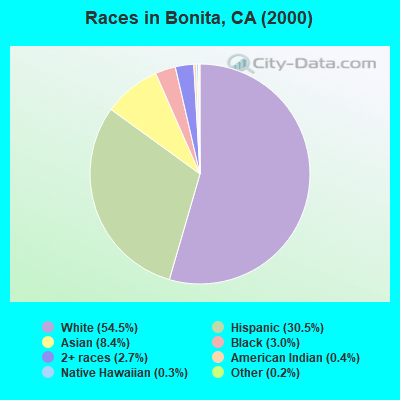
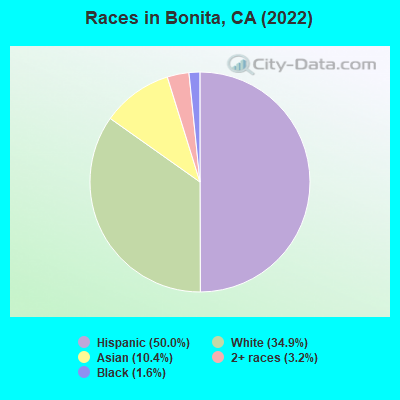
Race distribution in Bonita
2000 2022
15,816,790 46.7% White alone 10,966,556 32.4% Hispanic 3,648,860 10.8% Asian alone 2,181,926 6.4% Black alone 903,115 2.7% Two or more races 178,984 0.5% American Indian alone 103,736 0.3% Native Hawaiian and Other 71,681 0.2% Other race alone
15,732,184 40.3% Hispanic 13,160,426 33.7% White alone 5,957,867 15.3% Asian alone 2,025,218 5.2% Black alone 1,663,222 4.3% Two or more races 251,618 0.6% Other race alone 135,777 0.3% Native Hawaiian and Other 103,030 0.3% American Indian alone
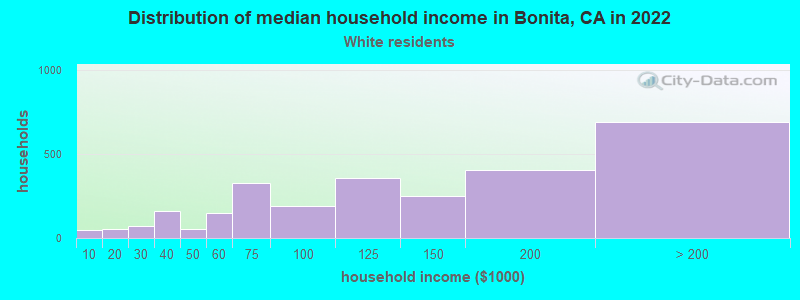
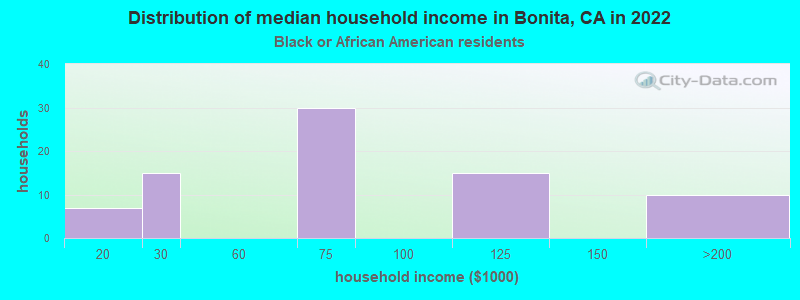
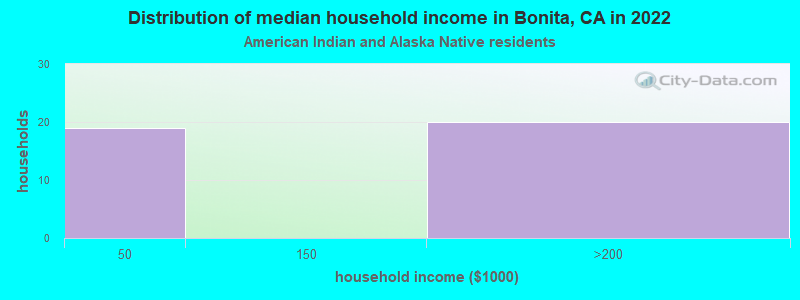
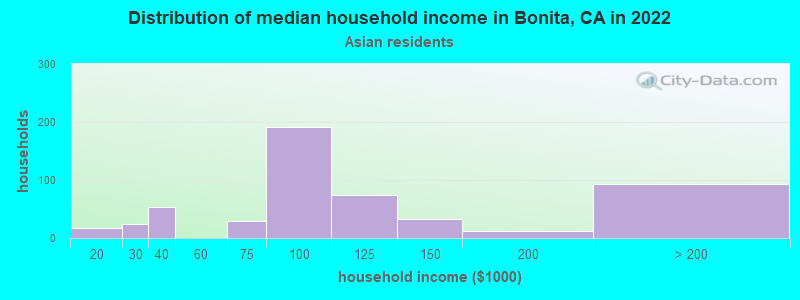
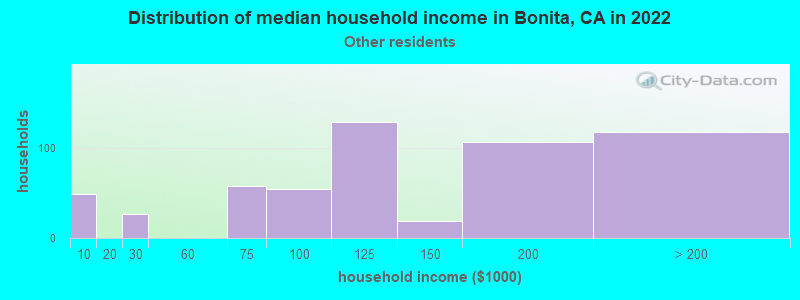
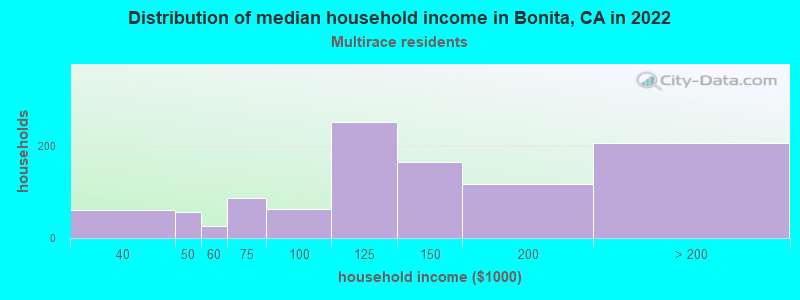
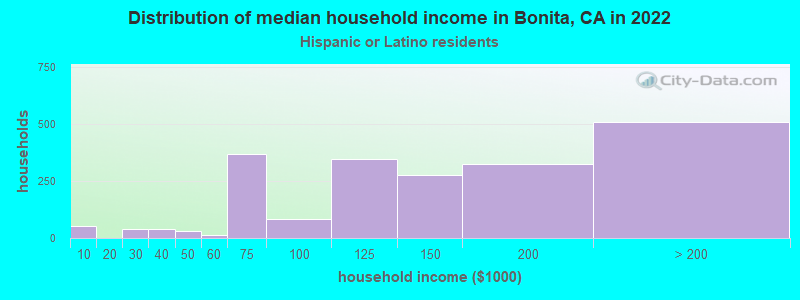
Income and house value in Bonita Median household income in 2022 $124,400 White non-Hispanic householders$85,122 Black householders$74,598 American Indian and Alaska Native householders$154,280 Asian householders$149,179 Native Hawaiian and other Pacific Islander householders$127,430 Some other race householders$136,606 Two or more races householders$131,200 Hispanic or Latino race householdersMedian 2022 house value over $1,000,000 White Non-Hispanic householders$989,806 Black or African American householders$444,153 American Indian or Alaska Native householders over $1,000,000 Asian householders$494,903 Native Hawaiian and other Pacific Islander householdersover $1,000,000 Some other race householders$989,806 Two or more races householdersover $1,000,000 Hispanic or Latino householders
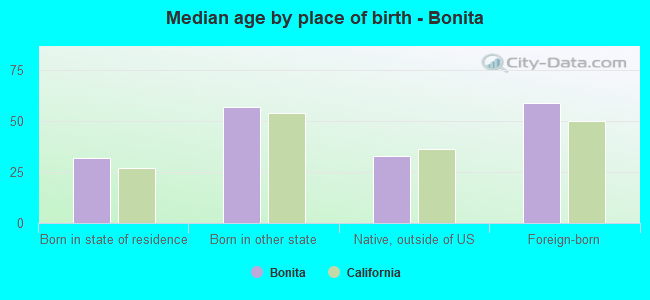
Median age by race in Bonita
49.7 Median age for White residents48.3 54.2 45.5 Median age for Black or African American residents44.8 66.5 22.7 Median age for American Indian / Alaska Native residents43.4 Median age for Asian residents34.4 45.7 39.0 Median age for Native Hawaiian / Pacific Islander residents46.4 Median age for Other race residents37.7 51.2 16.4 Median age for Two or more races residents28.5 12.0 58.3 Median age for White alone residents57.3 61.8 36.1 Median age for Hispanic or Latino residents35.9 36.5
Owner/renter occupied households by race in Bonita
House owners and renters - White residents 2,171 78.6% Owner occupied590 21.4% Renter occupiedHouse owners and renters - Black or African American residents 54 52.1% Owner occupied49 47.9% Renter occupiedHouse owners and renters - American Indian / Alaska Native residents 40 100.0% Owner occupiedHouse owners and renters - Asian residents 313 57.1% Owner occupied235 42.9% Renter occupiedHouse owners and renters - Native Hawaiian / Pacific Islander residents 27 100.0% Renter occupiedHouse owners and renters - Other race residents 121 52.2% Owner occupied110 47.8% Renter occupiedHouse owners and renters - Two or more races residents 368 84.9% Owner occupied65 15.1% Renter occupiedHouse owners and renters - White alone residents 1,493 83.1% Owner occupied303 16.9% Renter occupiedHouse owners and renters - Hispanic or Latino residents 1,162 67.7% Owner occupied555 32.3% Renter occupied
Language usage in Bonita
English speakers - Total 54.1% of residents of Bonita speak English at home.
33.7% of residents speak Spanish at home 3,147 77.0% Speak English very well941 23.0% Speak English less than very well12.4% of residents speak other language at home 1,119 74.4% Speak English very well385 25.6% Speak English less than very well
English speakers - Born in the United States 83.4% of residents of Bonita speak English at home.
11.7% of residents speak Spanish at home 242 89.0% Speak English very well30 11.0% Speak English less than very well5.0% of residents speak other language at home 85 73.3% Speak English very well31 26.7% Speak English less than very well
English speakers - Native, born elsewhere 38.2% of residents of Bonita speak English at home.
28.5% of residents speak Spanish at home 103 100.0% Speak English very well32.1% of residents speak other language at home 116 100.0% Speak English very well
English speakers - Foreign-born 17.5% of residents of Bonita speak English at home.
51.6% of residents speak Spanish at home 831 54.1% Speak English very well705 45.9% Speak English less than very well31.8% of residents speak other language at home 635 67.1% Speak English very well311 32.9% Speak English less than very well
White (Caucasian) - Speak only English Native:
71.2% (4,010)Foreign-born:
25.8% (309)
White (Caucasian) - Speak another language Native:
25.0% (1,409)Foreign-born:
76.8% (918)
Asian - Speak only English Native:
69.7% (854)Foreign-born:
15.5% (141)
Asian - Speak another language Native:
30.5% (374)Foreign-born:
84.9% (771)
Native Hawaiian / Pacific Islander - Speak another language Native:
81.6% (32)Foreign-born:
96.4% (5)
Other race - Speak another language Native:
70.7% (273)Foreign-born:
96.6% (155)
Two or more races - Speak only English Native:
57.6% (1,205)Foreign-born:
22.8% (131)
Two or more races - Speak another language Native:
54.0% (1,130)Foreign-born:
68.0% (390)
White alone - Speak only English Native:
95.2% (3,416)Foreign-born:
49.0% (135)
White alone - Speak another language Native:
4.8% (173)Foreign-born:
50.8% (140)
Hispanic or Latino - Speak only English Native:
40.0% (1,696)Foreign-born:
18.5% (300)
Hispanic or Latino - Speak another language Native:
59.1% (2,503)Foreign-born:
86.2% (1,400)
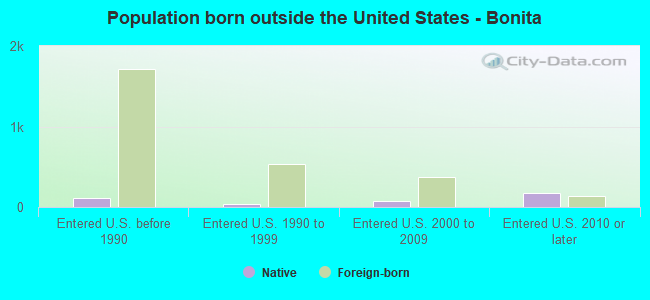
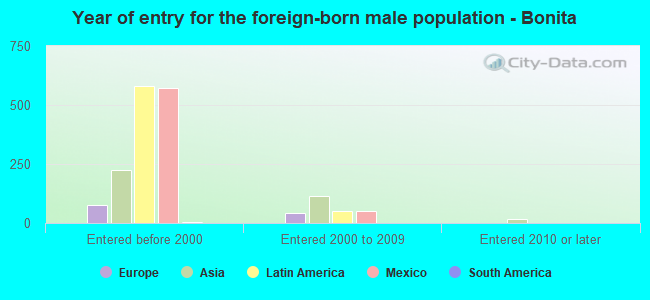
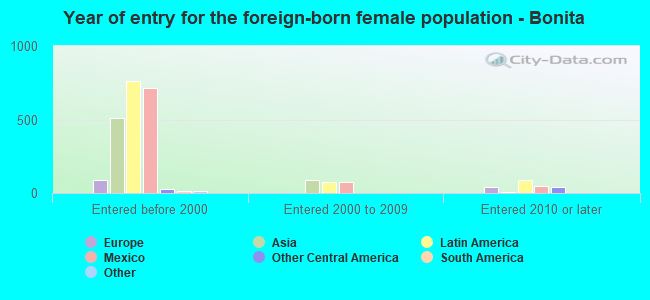
Foreign-born residents in Bonita 3,041 residents are foreign born (13.4% Latin America , 8.1% Asia ).
This city:
23.7%California:
100.0%
Marital status for residents in Bonita Marital status - White (Caucasian) population 15 years and over
Males 34.7% Never married51.9% Now married0.6% Separated2.1% Widowed10.7% DivorcedFemales 24.4% Never married48.1% Now married0.5% Separated13.4% Widowed13.5% DivorcedWomen who gave birth in the past 12 months Now married:
92.5% (68)Unmarried:
7.5% (6)
Women who did not give birth in the past 12 months Now married:
38.0% (501)Unmarried:
62.0% (816)
Marital status - Black or African American population 15 years and over
Males 23.2% Never married59.2% Now married0.0% Separated0.0% Widowed17.6% DivorcedFemales 5.4% Never married89.2% Now married0.0% Separated5.4% Widowed0.0% DivorcedWomen who did not give birth in the past 12 months Now married:
81.0% (15)Unmarried:
19.0% (4)
Marital status - Asian population 15 years and over
Males 36.5% Never married59.8% Now married0.0% Separated3.7% Widowed0.0% DivorcedFemales 19.4% Never married55.8% Now married1.0% Separated17.2% Widowed6.6% DivorcedWomen who gave birth in the past 12 months Now married:
100.0% (5)Unmarried:
0.0% (0)
Women who did not give birth in the past 12 months Now married:
54.7% (281)Unmarried:
45.3% (233)
Marital status - Native Hawaiian / Pacific Islander population 15 years and over
Males 37.2% Never married62.8% Now married0.0% Separated0.0% Widowed0.0% DivorcedFemales 100.0% Never married0.0% Now married0.0% Separated0.0% Widowed0.0% DivorcedWomen who did not give birth in the past 12 months Now married:
0.0% (0)Unmarried:
100.0% (4)
Marital status - Other race population 15 years and over
Males 46.7% Never married41.3% Now married0.0% Separated0.0% Widowed12.0% DivorcedFemales 19.6% Never married46.2% Now married4.9% Separated15.6% Widowed13.8% DivorcedWomen who gave birth in the past 12 months Now married:
0.0% (0)Unmarried:
100.0% (11)
Women who did not give birth in the past 12 months Now married:
67.0% (66)Unmarried:
33.0% (33)
Marital status - Two or more races population 15 years and over
Males 42.8% Never married48.2% Now married0.0% Separated0.0% Widowed9.0% DivorcedFemales 51.6% Never married36.1% Now married0.0% Separated0.0% Widowed12.3% DivorcedWomen who did not give birth in the past 12 months Now married:
28.7% (149)Unmarried:
71.3% (370)
Marital status - White alone, not Hispanic / Latino population 15 years and over
Males 30.7% Never married53.6% Now married1.1% Separated2.9% Widowed11.7% DivorcedFemales 14.4% Never married50.3% Now married1.1% Separated17.4% Widowed16.8% DivorcedWomen who gave birth in the past 12 months Now married:
91.3% (67)Unmarried:
8.8% (6)
Women who did not give birth in the past 12 months Now married:
48.0% (240)Unmarried:
52.0% (260)
Marital status - Hispanic or Latino population 15 years and over
Males 41.5% Never married48.4% Now married0.0% Separated1.0% Widowed9.1% DivorcedFemales 33.8% Never married45.6% Now married0.5% Separated9.8% Widowed10.3% DivorcedWomen who gave birth in the past 12 months Now married:
54.2% (13)Unmarried:
45.8% (11)
Women who did not give birth in the past 12 months Now married:
35.5% (503)Unmarried:
64.5% (914)
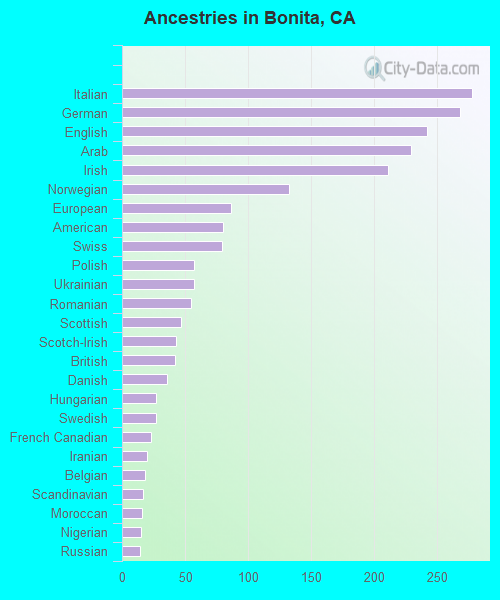
Ancestries in Bonita
331 4.2% English212 2.7% German180 2.3% Irish122 1.6% European107 1.4% Italian106 1.3% American98 1.2% British97 1.2% Northern European89 1.1% Norwegian58 0.7% Scottish57 0.7% Scotch-Irish55 0.7% Polish48 0.6% Dutch44 0.6% Romanian40 0.5% French Canadian36 0.5% Ukrainian34 0.4% Eastern European31 0.4% Danish18 0.2% Hungarian18 0.2% Iranian12 0.2% Russian12 0.2% Swedish9 0.1% Czech8 0.1% Lebanese8 0.1% Lithuanian8 0.1% Scandinavian7 0.09% Canadian7 0.09% French7 0.09% Greek7 0.09% African7 0.09% Swiss3 0.04% Czechoslovakian
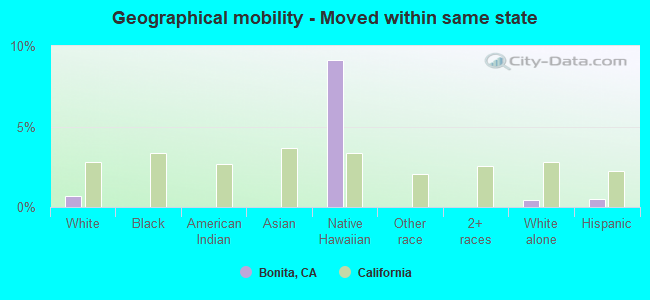
Geographical mobility in Bonita Same house 1 year ago 6,876 97.7% White (Caucasian)312 100.0% Black or African American43 100.0% American Indian / Alaska Native2,102 98.5% Asian44 91.5% Native Hawaiian / Pacific Islander474 86.2% Other race2,877 100.0% Two or more races3,667 92.7% White alone, not Hispanic / Latino5,677 96.0% Hispanic or LatinoMoved within same county 217 3.1% White / Caucasian3 0.9% Black or African American83 3.9% Asian60 10.9% Other race106 3.7% Two or more races210 5.3% White alone, not Hispanic / Latino243 4.1% Hispanic or LatinoMoved within same state 47 0.7% White / Caucasian4 9.1% Native Hawaiian / Pacific Islander18 0.5% White alone, not Hispanic / Latino29 0.5% Hispanic or LatinoMoved from different state 43 0.6% White / Caucasian53 1.3% White alone, not Hispanic / LatinoMoved from abroad 12 0.2% White2 0.1% Asian21 0.5% White alone, not Hispanic / Latino
Children Nativity (place of birth) in Bonita
Children under 6 years - Living with two parents Both parents native 357 100.0% NativeOne native, one foreign-born parent 59 100.0% NativeChildren under 6 years - Living with one parent Native parent 180 100.0% NativeForeign-born parent 16 100.0% NativeChildren 6 to 17 years - Living with two parents Both parents native 635 100.0% NativeBoth parents foreign-born 144 100.0% NativeOne native, one foreign-born parent 426 100.0% NativeChildren 6 to 17 years - Living with one parent Native parent 190 100.0% NativeForeign-born parent 126 52.2% Native116 47.8% Foreign-born
Grandparents responsible for own grandchildren in Bonita
Grandparents (30 to 59 years) White / Caucasian 41 100.0% Not responsible for grandchildrenAsian 48 100.0% Not responsible for grandchildrenWhite alone, not Hispanic / Latino 11 100.0% Not responsible for grandchildrenHispanic or Latino 54 100.0% Not responsible for grandchildrenGrandparents (60 years and over) White / Caucasian 36 68.8% Responsible for grandchildren16 31.2% Not responsible for grandchildrenAsian 70 50.5% Responsible for grandchildren69 49.5% Not responsible for grandchildrenWhite alone, not Hispanic / Latino 42 100.0% Responsible for grandchildrenHispanic or Latino 50 100.0% Not responsible for grandchildren