Races in Bryantsville, Kentucky (KY) Detailed Stats
Ancestries, Foreign-born residents, place of birth
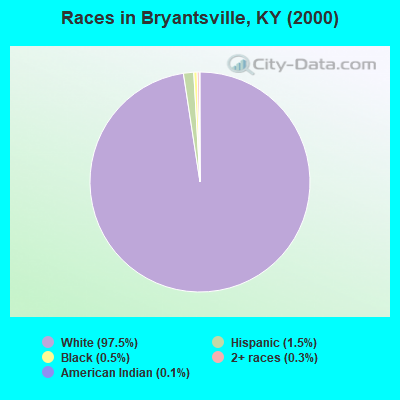
Race distribution in Bryantsville

- 4,27897.5%White alone
- 671.5%Hispanic
- 210.5%Black alone
- 140.3%Two or more races
- 50.1%American Indian alone
- 40.09%Asian alone
2000
2022
-
- 3,608,01389.3%White alone
- 293,6397.3%Black alone
- 59,9391.5%Hispanic
- 37,7500.9%Two or more races
- 29,3680.7%Asian alone
- 7,9390.2%American Indian alone
- 3,8460.10%Other race alone
- 1,2750.03%Native Hawaiian and Other
Pacific Islander alone

-
- 3,710,99882.2%White alone
- 343,1947.6%Black alone
- 187,4834.2%Hispanic
- 187,3944.2%Two or more races
- 62,2401.4%Asian alone
- 13,5290.3%Other race alone
- 4,3020.10%American Indian alone
- 3,1700.07%Native Hawaiian and Other
Pacific Islander alone

Income and house value in Bryantsville
- Median household income in 2022
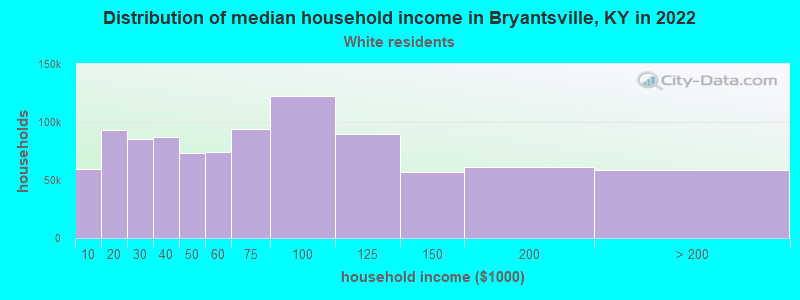
- $78,019White non-Hispanic householders
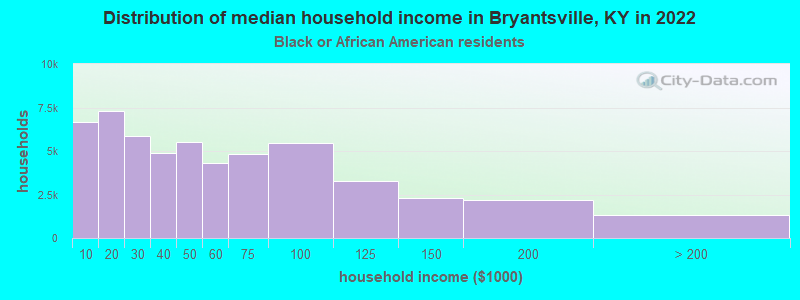
- $34,884Black householders
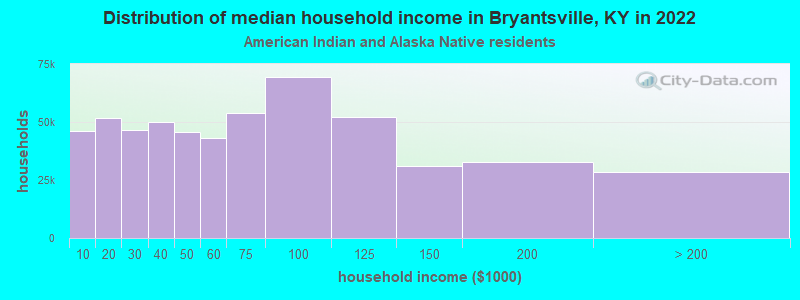
- $29,666American Indian and Alaska Native householders
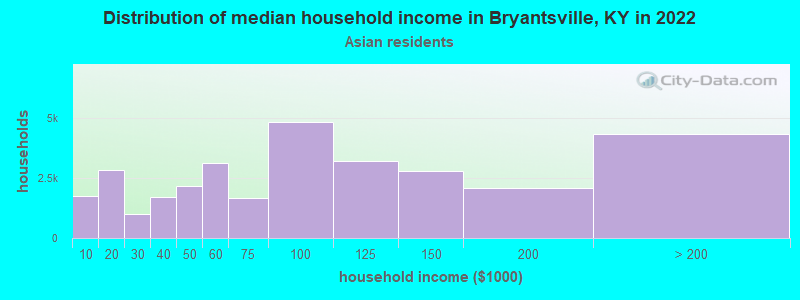
- $144,439Asian householders
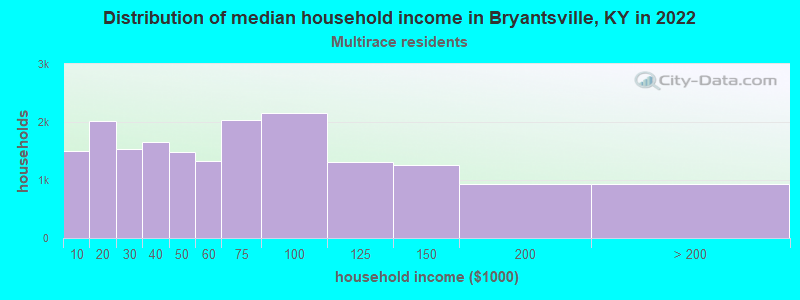
- $26,332Two or more races householders
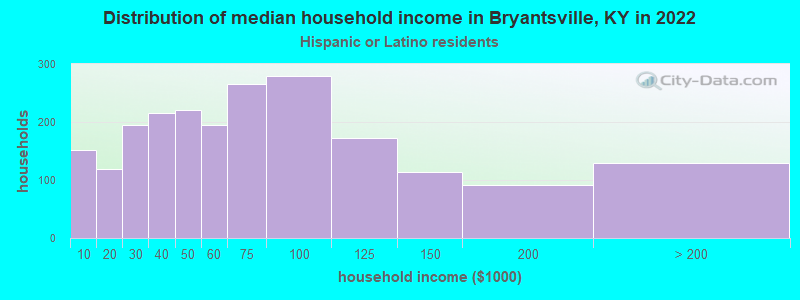
- $6,182Hispanic or Latino race householders
- Median 2022 house value
- $228,955White Non-Hispanic householders
- $223,543Black or African American householders
- $223,543Asian householders
- $416,026Two or more races householders
- $76,475Hispanic or Latino householders
Household income for White non-Hispanic householders
Household income for Black householders
Household income for American Indian and Alaska Native householders
Household income for Asian householders
Household income for Two or more races householders
Household income for Hispanic or Latino race householders
Zip code: 40444