Races in Calistoga, California (CA) Detailed Stats
Data:
Races - White alone (%)
Races - White alone (% change since 2000)
Races - Black alone (%)
Races - Black alone (% change since 2000)
Races - American Indian alone (%)
Races - American Indian alone (% change since 2000)
Races - Asian alone (%)
Races - Asian alone (% change since 2000)
Races - Hispanic (%)
Races - Hispanic (% change since 2000)
Races - Native Hawaiian and Other Pacific Islander alone (%)
Races - Native Hawaiian and Other Pacific Islander alone (% change since 2000)
Races - Two or more races(%)
Races - Two or more races(% change since 2000)
Races - Other race alone (%)
Races - Other race alone (% change since 2000)
Racial diversity
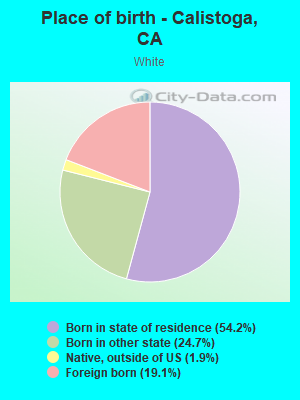
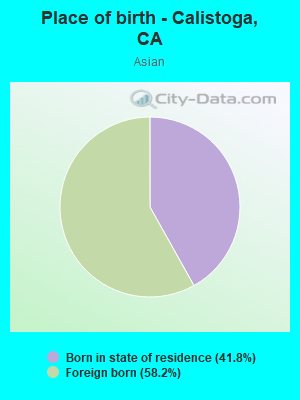
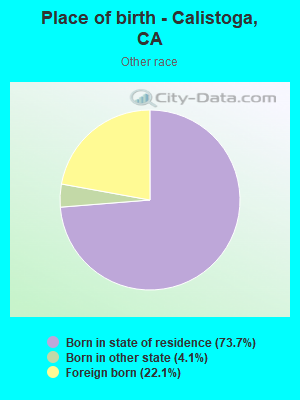
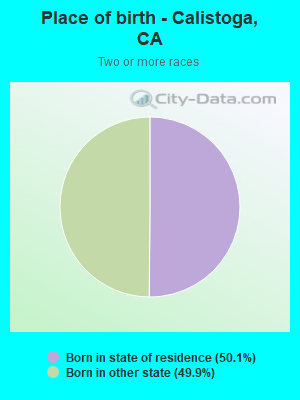
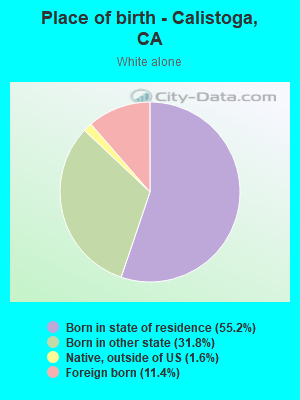
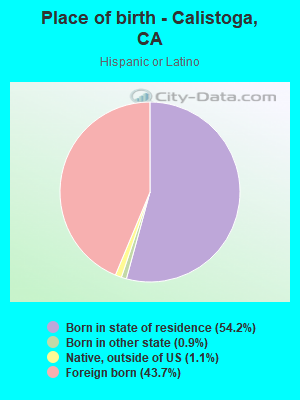
Place of birth - Born in state of residence (%)
Place of birth - Born in state of residence (%) - White
Place of birth - Born in state of residence (%) - Black or African American
Place of birth - Born in state of residence (%) - Asian
Place of birth - Born in state of residence (%) - Hispanic or Latino
Place of birth - Born in state of residence (%) - American Indian and Alaska Native
Place of birth - Born in state of residence (%) - Multirace
Place of birth - Born in state of residence (%) - Other Race
Place of birth - Born in other state (%)
Place of birth - Born in other state (%) - White
Place of birth - Born in other state (%) - Black or African American
Place of birth - Born in other state (%) - Asian
Place of birth - Born in other state (%) - Hispanic or Latino
Place of birth - Born in other state (%) - American Indian and Alaska Native
Place of birth - Born in other state (%) - Multirace
Place of birth - Born in other state (%) - Other Race
Place of birth - Native, outside of US (%)
Place of birth - Native, outside of US (%) - White
Place of birth - Native, outside of US (%) - Black or African American
Place of birth - Native, outside of US (%) - Asian
Place of birth - Native, outside of US (%) - Hispanic or Latino
Place of birth - Native, outside of US (%) - American Indian and Alaska Native
Place of birth - Native, outside of US (%) - Multirace
Place of birth - Native, outside of US (%) - Other Race
Place of birth - Foreign born (%)
Place of birth - Foreign born (%) - White
Place of birth - Foreign born (%) - Black or African American
Place of birth - Foreign born (%) - Asian
Place of birth - Foreign born (%) - Hispanic or Latino
Place of birth - Foreign born (%) - American Indian and Alaska Native
Place of birth - Foreign born (%) - Multirace
Place of birth - Foreign born (%) - Other Race
Residents speaking English at home (%)
Residents speaking English at home - Born in the United States (%)
Residents speaking English at home - Native, born elsewhere (%)
Residents speaking English at home - Foreign born (%)
Residents speaking Spanish at home (%)
Residents speaking Spanish at home - Born in the United States (%)
Residents speaking Spanish at home - Native, born elsewhere (%)
Residents speaking Spanish at home - Foreign born (%)
Residents speaking other language at home (%)
Residents speaking other language at home - Born in the United States (%)
Residents speaking other language at home - Native, born elsewhere (%)
Residents speaking other language at home - Foreign born (%)
Marital status - Never married (%)
Marital status - Now married (%)
Marital status - Separated (%)
Marital status - Widowed (%)
Marital status - Divorced (%)
Ancestries Reported - Arab (%)
Ancestries Reported - Czech (%)
Ancestries Reported - Danish (%)
Ancestries Reported - Dutch (%)
Ancestries Reported - English (%)
Ancestries Reported - French (%)
Ancestries Reported - French Canadian (%)
Ancestries Reported - German (%)
Ancestries Reported - Greek (%)
Ancestries Reported - Hungarian (%)
Ancestries Reported - Irish (%)
Ancestries Reported - Italian (%)
Ancestries Reported - Lithuanian (%)
Ancestries Reported - Norwegian (%)
Ancestries Reported - Polish (%)
Ancestries Reported - Portuguese (%)
Ancestries Reported - Russian (%)
Ancestries Reported - Scotch-Irish (%)
Ancestries Reported - Scottish (%)
Ancestries Reported - Slovak (%)
Ancestries Reported - Subsaharan African (%)
Ancestries Reported - Swedish (%)
Ancestries Reported - Swiss (%)
Ancestries Reported - Ukrainian (%)
Ancestries Reported - United States (%)
Ancestries Reported - Welsh (%)
Ancestries Reported - West Indian (%)
Ancestries Reported - Other (%)
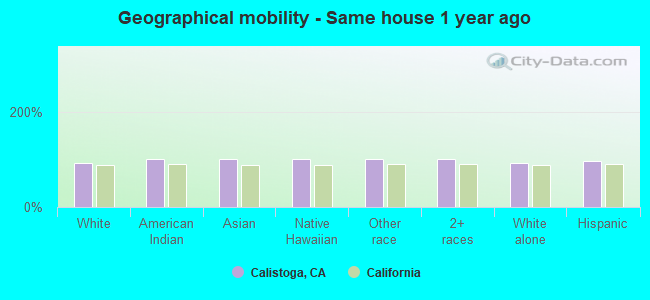
Geographical mobility - Same house 1 year ago (%)
Geographical mobility - Same house 1 year ago (%) - White
Geographical mobility - Same house 1 year ago (%) - Black or African American
Geographical mobility - Same house 1 year ago (%) - Asian
Geographical mobility - Same house 1 year ago (%) - Hispanic or Latino
Geographical mobility - Same house 1 year ago (%) - American Indian and Alaska Native
Geographical mobility - Same house 1 year ago (%) - Multirace
Geographical mobility - Same house 1 year ago (%) - Other Race
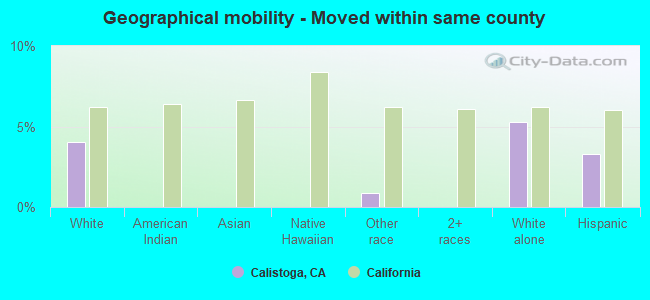
Geographical mobility - Moved within same county (%)
Geographical mobility - Moved within same county (%) - White
Geographical mobility - Moved within same county (%) - Black or African American
Geographical mobility - Moved within same county (%) - Asian
Geographical mobility - Moved within same county (%) - Hispanic or Latino
Geographical mobility - Moved within same county (%) - American Indian and Alaska Native
Geographical mobility - Moved within same county (%) - Multirace
Geographical mobility - Moved within same county (%) - Other Race
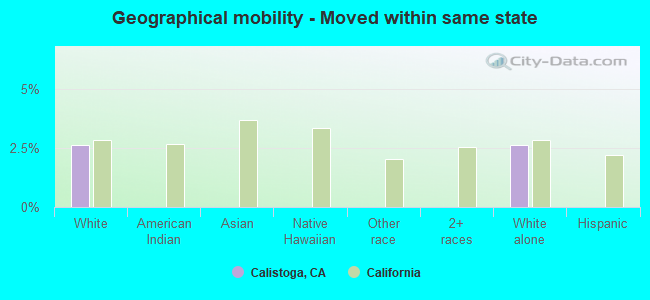
Geographical mobility - Moved from different county within same state (%)
Geographical mobility - Moved from different county within same state (%) - White
Geographical mobility - Moved from different county within same state (%) - Black or African American
Geographical mobility - Moved from different county within same state (%) - Asian
Geographical mobility - Moved from different county within same state (%) - Hispanic or Latino
Geographical mobility - Moved from different county within same state (%) - American Indian and Alaska Native
Geographical mobility - Moved from different county within same state (%) - Multirace
Geographical mobility - Moved from different county within same state (%) - Other Race
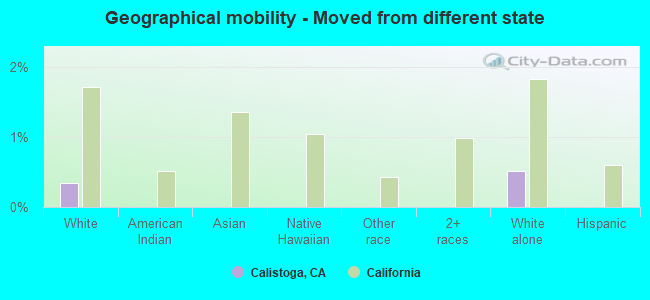
Geographical mobility - Moved from different state (%)
Geographical mobility - Moved from different state (%) - White
Geographical mobility - Moved from different state (%) - Black or African American
Geographical mobility - Moved from different state (%) - Asian
Geographical mobility - Moved from different state (%) - Hispanic or Latino
Geographical mobility - Moved from different state (%) - American Indian and Alaska Native
Geographical mobility - Moved from different state (%) - Multirace
Geographical mobility - Moved from different state (%) - Other Race
Geographical mobility - Moved from abroad (%)
Geographical mobility - Moved from abroad (%) - White
Geographical mobility - Moved from abroad (%) - Black or African American
Geographical mobility - Moved from abroad (%) - Asian
Geographical mobility - Moved from abroad (%) - Hispanic or Latino
Geographical mobility - Moved from abroad (%) - American Indian and Alaska Native
Geographical mobility - Moved from abroad (%) - Multirace
Geographical mobility - Moved from abroad (%) - Other Race
Place of birth for the foreign-born population - Ireland (%)
Place of birth for the foreign-born population - Denmark (%)
Place of birth for the foreign-born population - Norway (%)
Place of birth for the foreign-born population - Sweden (%)
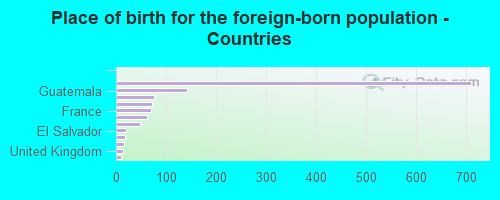
Place of birth for the foreign-born population - United Kingdom (%)
Place of birth for the foreign-born population - England (%)
Place of birth for the foreign-born population - Scotland (%)
Place of birth for the foreign-born population - Other Northern Europe (%)
Place of birth for the foreign-born population - Austria (%)
Place of birth for the foreign-born population - Belgium (%)
Place of birth for the foreign-born population - France (%)
Place of birth for the foreign-born population - Germany (%)
Place of birth for the foreign-born population - Netherlands (%)
Place of birth for the foreign-born population - Switzerland (%)
Place of birth for the foreign-born population - Other Western Europe (%)
Place of birth for the foreign-born population - Greece (%)
Place of birth for the foreign-born population - Italy (%)
Place of birth for the foreign-born population - Portugal (%)
Place of birth for the foreign-born population - Spain (%)
Place of birth for the foreign-born population - Other Southern Europe (%)
Place of birth for the foreign-born population - Albania (%)
Place of birth for the foreign-born population - Belarus (%)
Place of birth for the foreign-born population - Bosnia and Herzegovina (%)
Place of birth for the foreign-born population - Bulgaria (%)
Place of birth for the foreign-born population - Croatia (%)
Place of birth for the foreign-born population - Czechoslovakia (%)
Place of birth for the foreign-born population - Hungary (%)
Place of birth for the foreign-born population - Latvia (%)
Place of birth for the foreign-born population - Lithuania (%)
Place of birth for the foreign-born population - North Macedonia (Macedonia) (%)
Place of birth for the foreign-born population - Moldova (%)
Place of birth for the foreign-born population - Poland (%)
Place of birth for the foreign-born population - Romania (%)
Place of birth for the foreign-born population - Russia (%)
Place of birth for the foreign-born population - Serbia (%)
Place of birth for the foreign-born population - Ukraine (%)
Place of birth for the foreign-born population - Other Eastern Europe (%)
Place of birth for the foreign-born population - China (%)
Place of birth for the foreign-born population - Hong Kong (%)
Place of birth for the foreign-born population - Taiwan (%)
Place of birth for the foreign-born population - Japan (%)
Place of birth for the foreign-born population - Korea (%)
Place of birth for the foreign-born population - Other Eastern Asia (%)
Place of birth for the foreign-born population - Afghanistan (%)
Place of birth for the foreign-born population - Bangladesh (%)
Place of birth for the foreign-born population - India (%)
Place of birth for the foreign-born population - Iran (%)
Place of birth for the foreign-born population - Kazakhstan (%)
Place of birth for the foreign-born population - Nepal (%)
Place of birth for the foreign-born population - Pakistan (%)
Place of birth for the foreign-born population - Sri Lanka (%)
Place of birth for the foreign-born population - Uzbekistan (%)
Place of birth for the foreign-born population - Other South Central Asia (%)
Place of birth for the foreign-born population - Burma (%)
Place of birth for the foreign-born population - Cambodia (%)
Place of birth for the foreign-born population - Indonesia (%)
Place of birth for the foreign-born population - Laos (%)
Place of birth for the foreign-born population - Malaysia (%)
Place of birth for the foreign-born population - Philippines (%)
Place of birth for the foreign-born population - Singapore (%)
Place of birth for the foreign-born population - Thailand (%)
Place of birth for the foreign-born population - Vietnam (%)
Place of birth for the foreign-born population - Other South Eastern Asia (%)
Place of birth for the foreign-born population - Armenia (%)
Place of birth for the foreign-born population - Iraq (%)
Place of birth for the foreign-born population - Israel (%)
Place of birth for the foreign-born population - Jordan (%)
Place of birth for the foreign-born population - Kuwait (%)
Place of birth for the foreign-born population - Lebanon (%)
Place of birth for the foreign-born population - Saudi Arabia (%)
Place of birth for the foreign-born population - Syria (%)
Place of birth for the foreign-born population - Turkey (%)
Place of birth for the foreign-born population - Yemen (%)
Place of birth for the foreign-born population - Other Western Asia (%)
Place of birth for the foreign-born population - Eritrea (%)
Place of birth for the foreign-born population - Ethiopia (%)
Place of birth for the foreign-born population - Kenya (%)
Place of birth for the foreign-born population - Somalia (%)
Place of birth for the foreign-born population - Uganda (%)
Place of birth for the foreign-born population - Zimbabwe (%)
Place of birth for the foreign-born population - Other Eastern Africa (%)
Place of birth for the foreign-born population - Cameroon (%)
Place of birth for the foreign-born population - Congo (%)
Place of birth for the foreign-born population - Democratic Republic of Congo (Zaire) (%)
Place of birth for the foreign-born population - Other Middle Africa (%)
Place of birth for the foreign-born population - Egypt (%)
Place of birth for the foreign-born population - Morocco (%)
Place of birth for the foreign-born population - Sudan (%)
Place of birth for the foreign-born population - Other Northern Africa (%)
Place of birth for the foreign-born population - South Africa (%)
Place of birth for the foreign-born population - Other Southern Africa (%)
Place of birth for the foreign-born population - Cabo Verde (%)
Place of birth for the foreign-born population - Ghana (%)
Place of birth for the foreign-born population - Liberia (%)
Place of birth for the foreign-born population - Nigeria (%)
Place of birth for the foreign-born population - Senegal (%)
Place of birth for the foreign-born population - Sierra Leone (%)
Place of birth for the foreign-born population - Other Western Africa (%)
Place of birth for the foreign-born population - Australia (%)
Place of birth for the foreign-born population - New Zealand (%)
Place of birth for the foreign-born population - Fiji (%)
Place of birth for the foreign-born population - Micronesia (%)
Place of birth for the foreign-born population - Bahamas (%)
Place of birth for the foreign-born population - Barbados (%)
Place of birth for the foreign-born population - Cuba (%)
Place of birth for the foreign-born population - Dominica (%)
Place of birth for the foreign-born population - Dominican Republic (%)
Place of birth for the foreign-born population - Grenada (%)
Place of birth for the foreign-born population - Haiti (%)
Place of birth for the foreign-born population - Jamaica (%)
Place of birth for the foreign-born population - St. Vincent and the Grenadines (%)
Place of birth for the foreign-born population - Trinidad and Tobago (%)
Place of birth for the foreign-born population - West Indies (%)
Place of birth for the foreign-born population - Other Caribbean (%)
Place of birth for the foreign-born population - Belize (%)
Place of birth for the foreign-born population - Costa Rica (%)
Place of birth for the foreign-born population - El Salvador (%)
Place of birth for the foreign-born population - Guatemala (%)
Place of birth for the foreign-born population - Honduras (%)
Place of birth for the foreign-born population - Mexico (%)
Place of birth for the foreign-born population - Nicaragua (%)
Place of birth for the foreign-born population - Panama (%)
Place of birth for the foreign-born population - Other Central America (%)
Place of birth for the foreign-born population - Argentina (%)
Place of birth for the foreign-born population - Bolivia (%)
Place of birth for the foreign-born population - Brazil (%)
Place of birth for the foreign-born population - Chile (%)
Place of birth for the foreign-born population - Colombia (%)
Place of birth for the foreign-born population - Ecuador (%)
Place of birth for the foreign-born population - Guyana (%)
Place of birth for the foreign-born population - Peru (%)
Place of birth for the foreign-born population - Uruguay (%)
Place of birth for the foreign-born population - Venezuela (%)
Place of birth for the foreign-born population - Other South America (%)
Place of birth for the foreign-born population - Canada (%)
Place of birth for the foreign-born population - Other Northern America (%)
Place of birth for the foreign-born population - Other (%)
Latest news about races in Calistoga, CA collected exclusively by city-data.com from local newspapers, TV, and radio stations
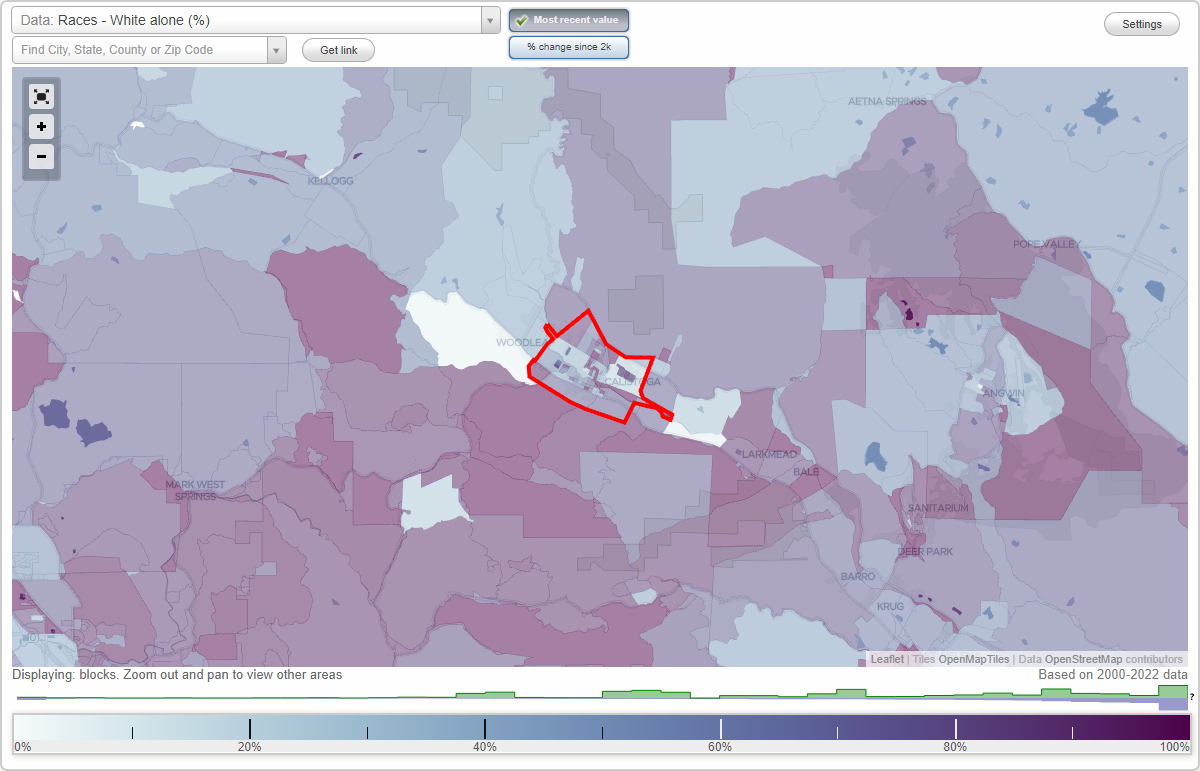
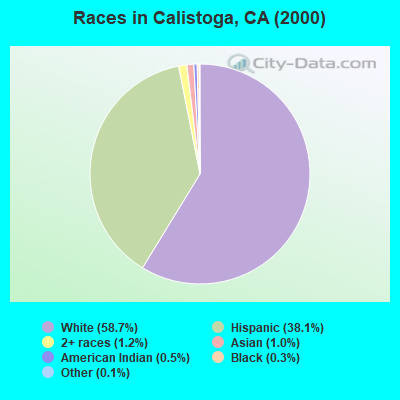
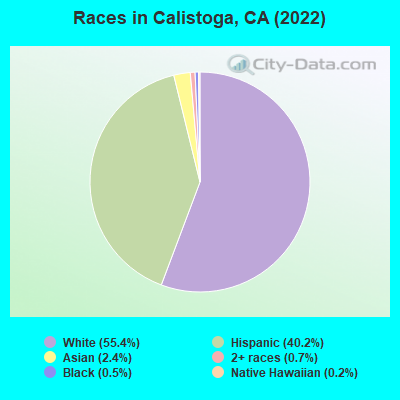
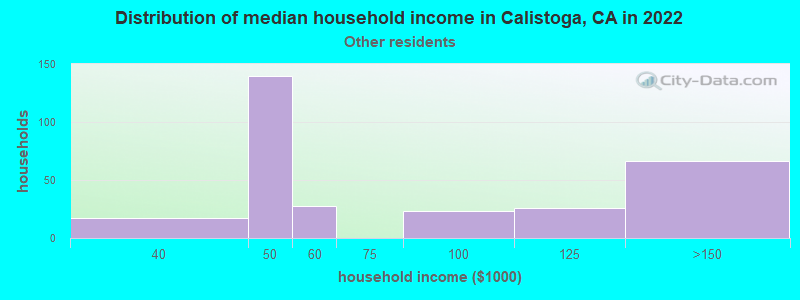
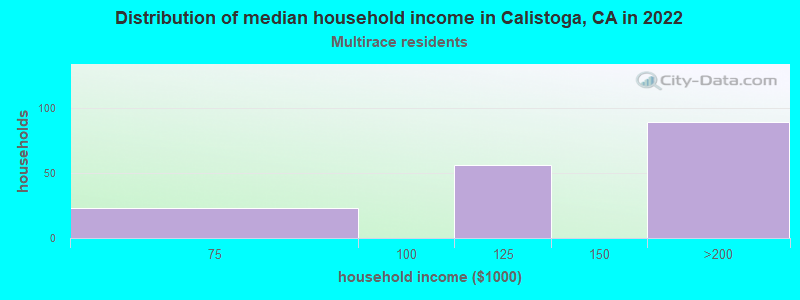
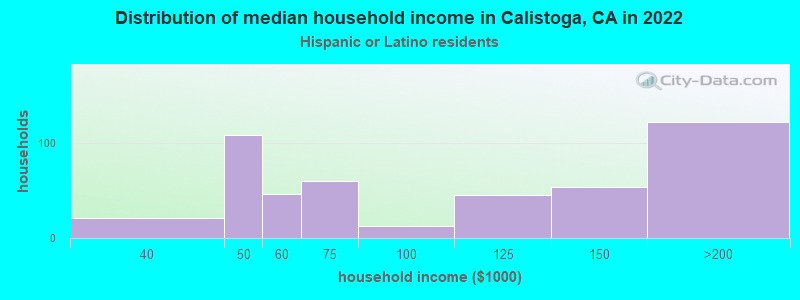
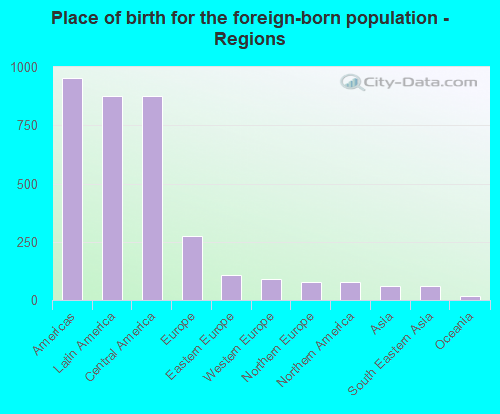
According to 2022 data, the most numerous races in Calistoga, CA are Hispanic (1,931 residents), White alone (2,985 residents), and Asian alone (84 residents). 60.9% of Calistoga residents speak English at home. 25.0% of Calistoga, CA residents are foreign-born (16.4% born in Latin America, 5.1% born in Europe), which is 4.0% less than the foreign-born rate of 26.0% across the entire state of California.
Race distribution in Calistoga
2000 2022
15,816,790 46.7% White alone 10,966,556 32.4% Hispanic 3,648,860 10.8% Asian alone 2,181,926 6.4% Black alone 903,115 2.7% Two or more races 178,984 0.5% American Indian alone 103,736 0.3% Native Hawaiian and Other 71,681 0.2% Other race alone
15,732,184 40.3% Hispanic 13,160,426 33.7% White alone 5,957,867 15.3% Asian alone 2,025,218 5.2% Black alone 1,663,222 4.3% Two or more races 251,618 0.6% Other race alone 135,777 0.3% Native Hawaiian and Other 103,030 0.3% American Indian alone
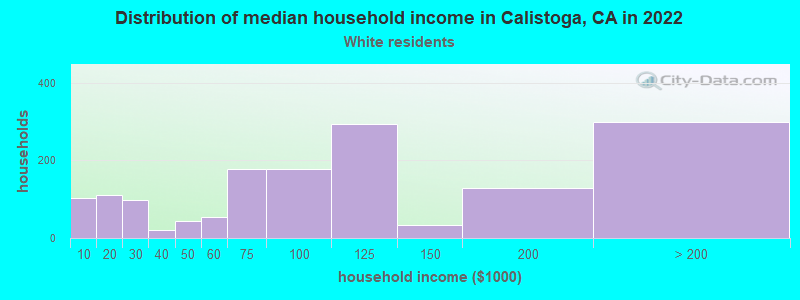
Income and house value in Calistoga Median household income in 2022 $102,652 White non-Hispanic householders$32,009 Black householders$120,042 American Indian and Alaska Native householders$135,482 Asian householders$48,295 Some other race householders$15,143 Two or more races householders$76,360 Hispanic or Latino race householdersMedian 2022 house value $997,364 White Non-Hispanic householders$404,920 Black or African American householders$989,806 American Indian or Alaska Native householders over $1,000,000 Asian householders$929,698 Some other race householders$985,487 Two or more races householders$895,864 Hispanic or Latino householders
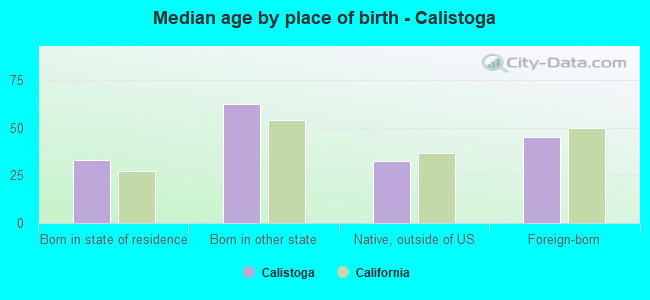
Median age by race in Calistoga
50.0 Median age for White residents51.5 46.2 33.2 Median age for Black or African American residents10.9 Median age for Asian residents34.4 Median age for Other race residents33.5 39.8 96.1 Median age for Two or more races residents55.5 Median age for White alone residents59.5 54.9 32.1 Median age for Hispanic or Latino residents31.8 36.8
Owner/renter occupied households by race in Calistoga
House owners and renters - White residents 1,134 70.7% Owner occupied470 29.3% Renter occupiedHouse owners and renters - American Indian / Alaska Native residents 119 100.0% Renter occupiedHouse owners and renters - Asian residents 19 100.0% Renter occupiedHouse owners and renters - Native Hawaiian / Pacific Islander residents 20 100.0% Renter occupiedHouse owners and renters - Other race residents 74 100.0% Renter occupiedHouse owners and renters - Two or more races residents 87 64.8% Owner occupied47 35.2% Renter occupiedHouse owners and renters - White alone residents 1,164 76.3% Owner occupied361 23.7% Renter occupiedHouse owners and renters - Hispanic or Latino residents 89 20.2% Owner occupied353 79.8% Renter occupied
Language usage in Calistoga
English speakers - Total 60.9% of residents of Calistoga speak English at home.
31.9% of residents speak Spanish at home 893 56.6% Speak English very well684 43.4% Speak English less than very well7.0% of residents speak other language at home 203 58.8% Speak English very well142 41.2% Speak English less than very well
English speakers - Born in the United States 86.5% of residents of Calistoga speak English at home.
9.6% of residents speak Spanish at home 101 100.0% Speak English very well4.0% of residents speak other language at home 42 100.0% Speak English very well
English speakers - Native, born elsewhere 74.0% of residents of Calistoga speak English at home.
27.4% of residents speak Spanish at home 20 100.0% Speak English very well
English speakers - Foreign-born 14.1% of residents of Calistoga speak English at home.
62.1% of residents speak Spanish at home 167 21.1% Speak English very well624 78.9% Speak English less than very well22.7% of residents speak other language at home 148 51.2% Speak English very well141 48.8% Speak English less than very well
White (Caucasian) - Speak only English Native:
83.4% (2,242)Foreign-born:
17.6% (122)
White (Caucasian) - Speak another language Native:
17.0% (457)Foreign-born:
82.5% (573)
Other race - Speak another language Native:
62.9% (259)Foreign-born:
99.3% (99)
White alone - Speak only English Native:
92.1% (2,316)Foreign-born:
25.5% (82)
White alone - Speak another language Native:
7.5% (189)Foreign-born:
81.8% (264)
Hispanic or Latino - Speak only English Native:
26.6% (264)Foreign-born:
8.2% (64)
Hispanic or Latino - Speak another language Native:
74.2% (735)Foreign-born:
92.6% (723)
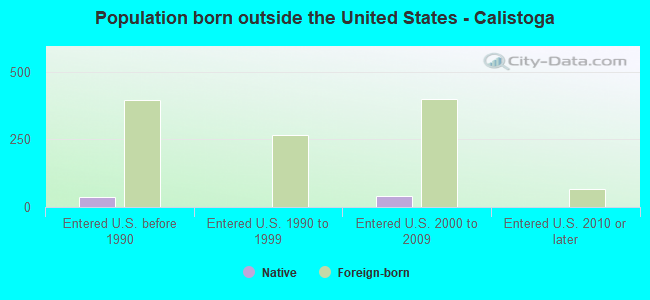
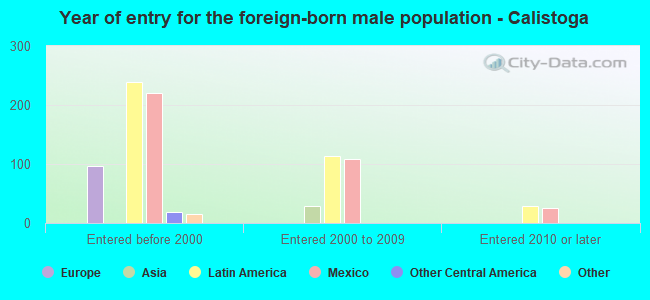
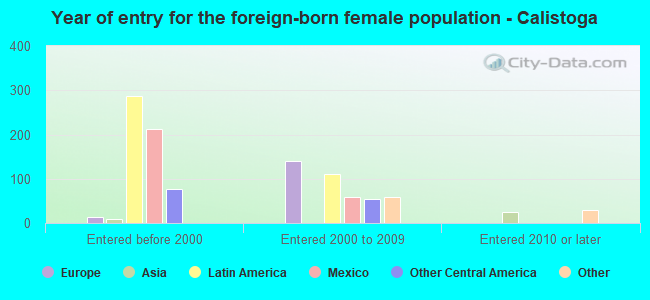
Foreign-born residents in Calistoga 1,303 residents are foreign born (16.4% Latin America , 5.1% Europe ).
This city:
25.0%California:
100.0%
Marital status for residents in Calistoga Marital status - White (Caucasian) population 15 years and over
Males 35.8% Never married46.8% Now married0.3% Separated4.6% Widowed12.4% DivorcedFemales 23.1% Never married54.7% Now married1.8% Separated5.0% Widowed15.4% DivorcedWomen who gave birth in the past 12 months Now married:
100.0% (13)Unmarried:
0.0% (0)
Women who did not give birth in the past 12 months Now married:
48.4% (292)Unmarried:
51.6% (311)
Marital status - Asian population 15 years and over
Males 0.0% Never married100.0% Now married0.0% Separated0.0% Widowed0.0% DivorcedFemales 0.0% Never married100.0% Now married0.0% Separated0.0% Widowed0.0% DivorcedWomen who did not give birth in the past 12 months Now married:
100.0% (18)Unmarried:
0.0% (0)
Marital status - Other race population 15 years and over
Males 84.4% Never married8.9% Now married0.0% Separated6.8% Widowed0.0% DivorcedFemales 48.2% Never married25.5% Now married0.0% Separated0.0% Widowed26.3% DivorcedWomen who did not give birth in the past 12 months Now married:
21.4% (20)Unmarried:
78.6% (74)
Marital status - White alone, not Hispanic / Latino population 15 years and over
Males 30.8% Never married47.8% Now married0.4% Separated5.8% Widowed15.3% DivorcedFemales 25.1% Never married51.5% Now married2.4% Separated6.7% Widowed14.3% DivorcedWomen who gave birth in the past 12 months Now married:
100.0% (14)Unmarried:
0.0% (0)
Women who did not give birth in the past 12 months Now married:
39.0% (184)Unmarried:
61.0% (287)
Marital status - Hispanic or Latino population 15 years and over
Males 70.0% Never married27.2% Now married0.0% Separated2.1% Widowed0.7% DivorcedFemales 24.3% Never married55.0% Now married0.0% Separated0.0% Widowed20.7% DivorcedWomen who did not give birth in the past 12 months Now married:
57.2% (181)Unmarried:
42.8% (135)
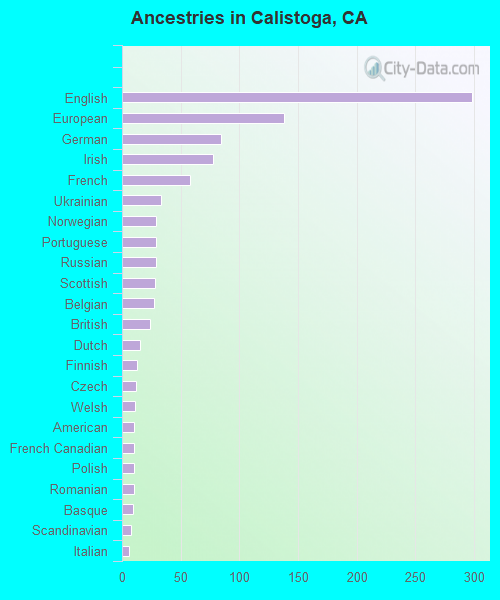
Ancestries in Calistoga
283 9.2% European169 5.5% Italian163 5.3% German132 4.3% Norwegian77 2.5% Irish56 1.8% French52 1.7% Scotch-Irish50 1.6% English40 1.3% British35 1.1% Northern European33 1.1% Scottish27 0.9% American20 0.6% Russian16 0.5% Swedish12 0.4% Finnish11 0.4% Belgian11 0.4% Welsh10 0.3% Czech10 0.3% Danish10 0.3% Scandinavian10 0.3% Slovak9 0.3% Dutch9 0.3% Maltese
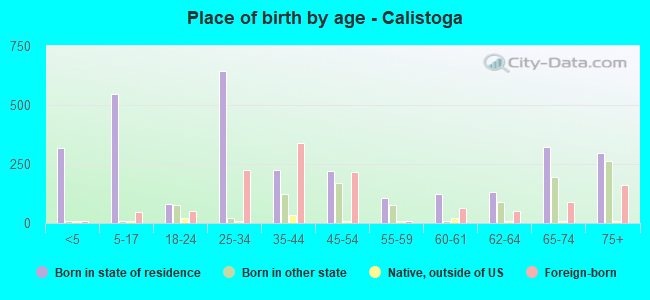
Children Nativity (place of birth) in Calistoga
Children under 6 years - Living with two parents Both parents native 13 100.0% NativeBoth parents foreign-born 67 100.0% NativeOne native, one foreign-born parent 191 100.0% NativeChildren under 6 years - Living with one parent Native parent 18 100.0% NativeForeign-born parent 94 100.0% NativeChildren 6 to 17 years - Living with two parents Both parents native 103 99.8% Native0 0.2% Foreign-bornBoth parents foreign-born 148 84.9% Native26 15.1% Foreign-bornOne native, one foreign-born parent 65 100.0% NativeChildren 6 to 17 years - Living with one parent Native parent 35 100.0% NativeForeign-born parent 117 54.4% Native98 45.6% Foreign-born