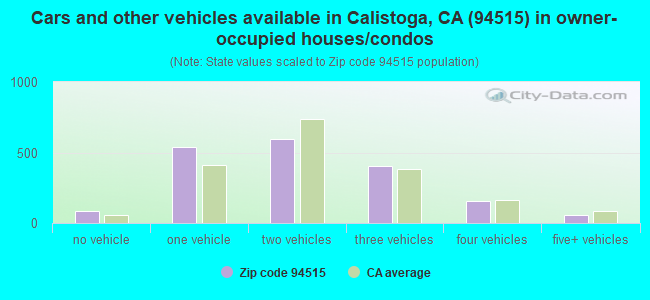
Estimated zip code population in 2022: 6,965 Zip code population in 2010: 7,050 Zip code population in 2000: 7,370
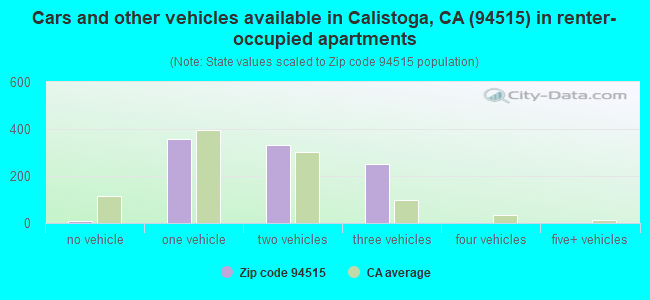
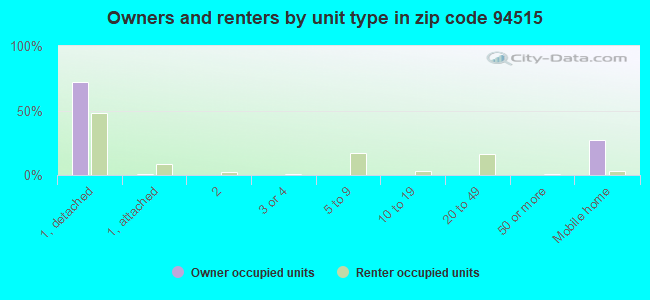
Houses and condos: 3,304 Renter-occupied apartments: 948
% of renters here:
34%
State:
44%
March 2022 cost of living index in zip code 94515: 118.3 (more than average, U.S. average is 100)
Land area: 105.7 sq. mi. Water area: 0.2 sq. mi.
Population density: 66 people per square mile
(very low).
OSM Map
General Map
Google Map
MSN Map
OSM Map
General Map
Google Map
MSN Map
OSM Map
General Map
Google Map
MSN Map
OSM Map
General Map
Google Map
MSN Map
Please wait while loading the map...
Real estate property taxes paid for housing units in 2022:
This zip code:
0.5% ($4,741)
California:
0.7% ($4,831)
Median real estate property taxes paid for housing units with mortgages in 2022: $7,032 (0.7%) Median real estate property taxes paid for housing units with no mortgage in 2022: $1,920 (0.6%)
Estimated median house/condo value in 2022: $892,133
94515:
$892,133
California:
$715,900
According to our research of California and other state lists, there was 1 registered sex offender living in 94515 zip code as of April 27, 2024. The ratio of all residents to sex offenders in zip code 94515 is 7,484 to 1. The ratio of registered sex offenders to all residents in this zip code is much lower than the state average.
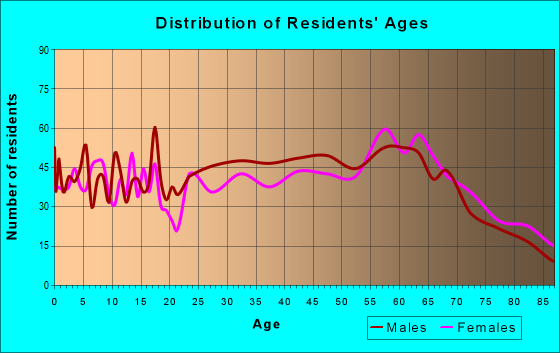
Median resident age:
This zip code:
50.5 years
California median age:
37.9 years
Average household size:
This zip code:
2.4 people
California:
2.8 people
Averages for the 2020 tax year for zip code 94515, filed in 2021:
Average Adjusted Gross Income (AGI) in 2020: $103,828 (Individual Income Tax Returns)
Here:
$103,828
State:
$95,910
Salary/wage: $69,479 (reported on 75.0% of returns)
Here:
$69,479
State:
$77,331
(% of AGI for various income ranges: 1653.6% for AGIs below $25k, 4593.3% for AGIs $25k-50k, 8541.4% for AGIs $50k-75k, 12304.0% for AGIs $75k-100k, 21729.4% for AGIs $100k-200k, 114375.0% for AGIs over 200k)
Taxable interest for individuals: $3,992 (reported on 36.9% of returns)
This zip code:
$3,992
California:
$2,294
(% of AGI for various income ranges: 49.5% for AGIs below $25k, 60.4% for AGIs $25k-50k, 75.4% for AGIs $50k-75k, 171.3% for AGIs $75k-100k, 588.8% for AGIs $100k-200k, 5053.3% for AGIs over 200k)
Ordinary dividends: $19,777 (reported on 22.9% of returns)
Here:
$19,777
State:
$10,949
(% of AGI for various income ranges: 102.0% for AGIs below $25k, 135.6% for AGIs $25k-50k, 190.7% for AGIs $50k-75k, 572.0% for AGIs $75k-100k, 1190.0% for AGIs $100k-200k, 18053.3% for AGIs over 200k)
Net capital gain/loss in AGI: +$59,958 (reported on 22.9% of returns)
Here:
+$59,958
State:
+$49,306
(% of AGI for various income ranges: 17.5% for AGIs below $25k, 75.6% for AGIs $25k-50k, 156.4% for AGIs $50k-75k, 505.3% for AGIs $75k-100k, 1365.0% for AGIs $100k-200k, 70580.0% for AGIs over 200k)
Profit/loss from business: +$23,148 (reported on 17.9% of returns)
Here:
+$23,148
State:
+$15,671
(% of AGI for various income ranges: 195.5% for AGIs below $25k, 337.5% for AGIs $25k-50k, 287.1% for AGIs $50k-75k, 681.3% for AGIs $75k-100k, 1123.8% for AGIs $100k-200k, 12975.0% for AGIs over 200k)
Taxable individual retirement arrangement distribution: $23,372 (reported on 10.7% of returns)
94515:
$23,372
California:
$23,505
(% of AGI for various income ranges: 132.5% for AGIs below $25k, 144.2% for AGIs $25k-50k, 296.1% for AGIs $50k-75k, 508.0% for AGIs $75k-100k, 1825.6% for AGIs $100k-200k, 4378.3% for AGIs over 200k)
Self-employed (Keogh) retirement plans: $42,550 (reported on 1.2% of returns)
94515:
$42,550
California:
$30,163
(% of AGI for various income ranges: 2836.7% for AGIs over 200k)
Total itemized deductions: $47,365 (reported on 12.8% of returns)
Here:
$47,365
State:
$39,517
(% of AGI for various income ranges: 248.0% for AGIs below $25k, 297.9% for AGIs $25k-50k, 351.4% for AGIs $50k-75k, 1038.0% for AGIs $75k-100k, 2633.1% for AGIs $100k-200k, 18486.7% for AGIs over 200k)
Charity contributions: $16,782 (reported on 9.8% of returns)
Here:
$16,782
State:
$12,598
(% of AGI for various income ranges: 45.8% for AGIs $25k-50k, 106.7% for AGIs $75k-100k, 341.2% for AGIs $100k-200k, 7686.7% for AGIs over 200k)
Taxes paid: $8,777 (reported on 12.8% of returns)
94515:
$8,777
State:
$8,807
(% of AGI for various income ranges: 30.9% for AGIs below $25k, 53.8% for AGIs $25k-50k, 84.6% for AGIs $50k-75k, 243.3% for AGIs $75k-100k, 697.5% for AGIs $100k-200k, 2770.0% for AGIs over 200k)
Earned income credit: $1,711 (reported on 8.3% of returns)
Here:
$1,711
State:
$2,074
(% of AGI for various income ranges: 54.8% for AGIs below $25k, 49.6% for AGIs $25k-50k)
Percentage of individuals using paid preparers for their 2020 taxes: 86.9%
Here:
87%
State:
92%
(% for various income ranges: 85.1% for AGIs below $25k, 86.0% for AGIs $25k-50k, 84.9% for AGIs $50k-75k, 87.9% for AGIs $75k-100k, 90.9% for AGIs $100k-200k, 92.3% for AGIs over 200k)
Averages for the 2012 tax year for zip code 94515, filed in 2013:
Average Adjusted Gross Income (AGI) in 2012: $76,734 (Individual Income Tax Returns)
Here:
$76,734
State:
$72,726
Salary/wage: $50,971 (reported on 75.8% of returns)
Here:
$50,971
State:
$59,079
(% of AGI for various income ranges: 71.1% for AGIs below $25k, 76.3% for AGIs $25k-50k, 68.6% for AGIs $50k-75k, 67.7% for AGIs $75k-100k, 56.7% for AGIs $100k-200k, 28.6% for AGIs over 200k)
Taxable interest for individuals: $2,873 (reported on 38.8% of returns)
This zip code:
$2,873
California:
$2,146
(% of AGI for various income ranges: 2.5% for AGIs below $25k, 0.7% for AGIs $25k-50k, 0.9% for AGIs $50k-75k, 1.2% for AGIs $75k-100k, 1.6% for AGIs $100k-200k, 1.7% for AGIs over 200k)
Ordinary dividends: $10,170 (reported on 23.3% of returns)
Here:
$10,170
State:
$9,308
(% of AGI for various income ranges: 4.8% for AGIs below $25k, 1.5% for AGIs $25k-50k, 2.6% for AGIs $50k-75k, 2.6% for AGIs $75k-100k, 3.6% for AGIs $100k-200k, 3.4% for AGIs over 200k)
Net capital gain/loss in AGI: +$20,156 (reported on 21.5% of returns)
Here:
+$20,156
State:
+$30,460
(% of AGI for various income ranges: 0.9% for AGIs $50k-75k, 0.9% for AGIs $75k-100k, 3.0% for AGIs $100k-200k, 11.5% for AGIs over 200k)
Profit/loss from business: +$29,200 (reported on 19.4% of returns)
Here:
+$29,200
State:
+$17,064
(% of AGI for various income ranges: 7.9% for AGIs below $25k, 6.4% for AGIs $25k-50k, 5.5% for AGIs $50k-75k, 5.9% for AGIs $75k-100k, 8.3% for AGIs $100k-200k, 8.0% for AGIs over 200k)
Taxable individual retirement arrangement distribution: $22,162 (reported on 11.2% of returns)
94515:
$22,162
California:
$19,557
(% of AGI for various income ranges: 2.4% for AGIs below $25k, 2.3% for AGIs $25k-50k, 3.9% for AGIs $50k-75k, 3.3% for AGIs $75k-100k, 5.4% for AGIs $100k-200k, 2.5% for AGIs over 200k)
Self-employment retirement plans: $31,820 (reported on 1.5% of returns)
94515:
$31,820
California:
$24,530
Total itemized deductions: $43,092 (25% of AGI, reported on 30.6% of returns)
Here:
$43,092
State:
$34,004
Here:
24.7% of AGI
State:
22.7% of AGI
(% of AGI for various income ranges: 15.1% for AGIs below $25k, 9.2% for AGIs $25k-50k, 12.3% for AGIs $50k-75k, 18.2% for AGIs $75k-100k, 19.1% for AGIs $100k-200k, 20.1% for AGIs over 200k)
Charity contributions: $10,100 (reported on 25.2% of returns)
Here:
$10,100
State:
$4,659
(% of AGI for various income ranges: 1.1% for AGIs below $25k, 1.0% for AGIs $25k-50k, 1.1% for AGIs $50k-75k, 1.1% for AGIs $75k-100k, 2.1% for AGIs $100k-200k, 5.9% for AGIs over 200k)
Taxes paid: $17,849 (reported on 30.6% of returns)
94515:
$17,849
State:
$14,448
(% of AGI for various income ranges: 3.4% for AGIs below $25k, 2.0% for AGIs $25k-50k, 3.1% for AGIs $50k-75k, 5.5% for AGIs $75k-100k, 7.2% for AGIs $100k-200k, 10.5% for AGIs over 200k)
Earned income credit: $1,846 (reported on 11.2% of returns)
Here:
$1,846
State:
$2,286
(% of AGI for various income ranges: 2.9% for AGIs below $25k, 0.7% for AGIs $25k-50k)
Percentage of individuals using paid preparers for their 2012 taxes: 62.4%
Here:
62%
State:
64%
(% for various income ranges: 54.2% for AGIs below $25k, 59.6% for AGIs $25k-50k, 66.7% for AGIs $50k-75k, 66.7% for AGIs $75k-100k, 75.0% for AGIs $100k-200k, 93.3% for AGIs over 200k)
Averages for the 2004 tax year for zip code 94515, filed in 2005:
Average Adjusted Gross Income (AGI) in 2004: $68,156 (Individual Income Tax Returns)
Here:
$68,156
State:
$58,600
Salary/wage: $45,128 (reported on 74.4% of returns)
Here:
$45,128
State:
$49,455
(% of AGI for various income ranges: 72.1% for AGIs $10k-25k, 77.6% for AGIs $25k-50k, 66.1% for AGIs $50k-75k, 63.5% for AGIs $75k-100k, 31.2% for AGIs over 100k)
Taxable interest for individuals: $4,861 (reported on 49.4% of returns)
This zip code:
$4,861
California:
$2,365
(% of AGI for various income ranges: 2.9% for AGIs $10k-25k, 2.2% for AGIs $25k-50k, 2.5% for AGIs $50k-75k, 2.9% for AGIs $75k-100k, 3.7% for AGIs over 100k)
Taxable dividends: $6,288 (reported on 30.2% of returns)
Here:
$6,288
State:
$4,746
(% of AGI for various income ranges: 3.1% for AGIs $10k-25k, 1.7% for AGIs $25k-50k, 2.2% for AGIs $50k-75k, 2.3% for AGIs $75k-100k, 2.7% for AGIs over 100k)
Net capital gain/loss: +$26,735 (reported on 26.9% of returns)
Here:
+$26,735
State:
+$23,418
(% of AGI for various income ranges: -0.2% for AGIs $10k-25k, 0.5% for AGIs $25k-50k, 2.8% for AGIs $50k-75k, 1.9% for AGIs $75k-100k, 15.8% for AGIs over 100k)
Profit/loss from business: +$31,956 (reported on 19.7% of returns)
Here:
+$31,956
State:
+$16,826
(% of AGI for various income ranges: 7.4% for AGIs $10k-25k, 5.7% for AGIs $25k-50k, 7.7% for AGIs $50k-75k, 9.3% for AGIs $75k-100k, 10.2% for AGIs over 100k)
IRA payment deduction: $3,184 (reported on 3.1% of returns)
94515:
$3,184
California:
$3,192
(% of AGI for various income ranges: 0.4% for AGIs $10k-25k, 0.2% for AGIs $25k-50k, 0.3% for AGIs $50k-75k, 0.1% for AGIs over 100k)
Self-employed pension: $18,763 (reported on 3.0% of returns)
Here:
$18,763
California:
$17,688
(% of AGI for various income ranges: 0.3% for AGIs $25k-50k, 0.3% for AGIs $50k-75k, 0.9% for AGIs $75k-100k, 1.1% for AGIs over 100k)
Total itemized deductions: $33,509 (21% of AGI, reported on 33.4% of returns)
Here:
$33,509
State:
$28,113
Here:
21.1% of AGI
State:
25.3% of AGI
(% of AGI for various income ranges: 14.9% for AGIs $10k-25k, 12.6% for AGIs $25k-50k, 18.0% for AGIs $50k-75k, 19.7% for AGIs $75k-100k, 15.5% for AGIs over 100k)
Charity contributions deductions: $6,491 (4% of AGI, reported on 28.3% of returns)
Here:
$6,491
State:
$3,923
Here:
3.7% of AGI
State:
3.3% of AGI
(% of AGI for various income ranges: 0.9% for AGIs $10k-25k, 1.0% for AGIs $25k-50k, 2.0% for AGIs $50k-75k, 2.1% for AGIs $75k-100k, 3.3% for AGIs over 100k)
Total tax: $14,370 (reported on 76.3% of returns)
94515:
$14,370
State:
$10,761
(% of AGI for various income ranges: 4.5% for AGIs $10k-25k, 6.8% for AGIs $25k-50k, 9.5% for AGIs $50k-75k, 11.9% for AGIs $75k-100k, 20.1% for AGIs over 100k)
Earned income credit: $1,510 (reported on 9.3% of returns)
Here:
$1,510
State:
$1,763
Percentage of individuals using paid preparers for their 2004 taxes: 66.7%
Here:
67%
State:
66%
(% for various income ranges: 64.0% for AGIs below $10k, 62.5% for AGIs $10k-25k, 62.7% for AGIs $25k-50k, 67.2% for AGIs $50k-75k, 75.0% for AGIs $75k-100k, 84.0% for AGIs over 100k)
Likely homosexual households (counted as self-reported same-sex unmarried-partner households)
Lesbian couples: 0.0% of all households
Gay men: 0.3% of all households
Household received Food Stamps/SNAP in the past 12 months: 311 Household did not receive Food Stamps/SNAP in the past 12 months: 2,455
Women who had a birth in the past 12 months: 30 (30 now married, 0 unmarried) Women who did not have a birth in the past 12 months: 1,226 (478 now married, 748 unmarried)
Housing units in zip code 94515 with a mortgage: 870 (93 second mortgage, 97 both second mortgage and home equity loan) Median monthly owner costs for units with a mortgage: $2,922 Median monthly owner costs for units without a mortgage: $1,031
Residents with income below the poverty level in 2022:
This zip code:
6.7%
Whole state:
12.2%
Residents with income below 50% of the poverty level in 2022:
This zip code:
2.1%
Whole state:
6.2%
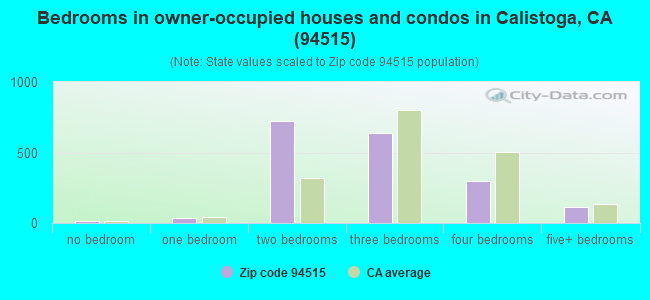
Median number of rooms in houses and condos:
Here:
5.9
State:
6.0
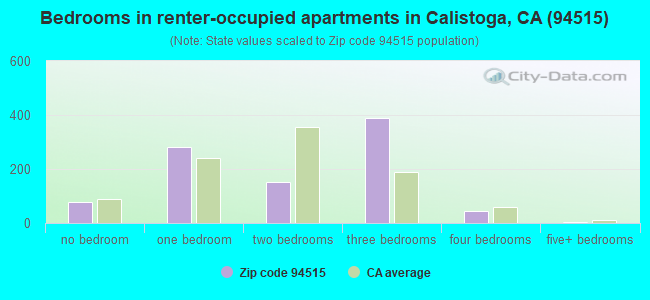
Median number of rooms in apartments:
Here:
4.4
State:
3.9
Notable locations in this zip code not listed on our city pages
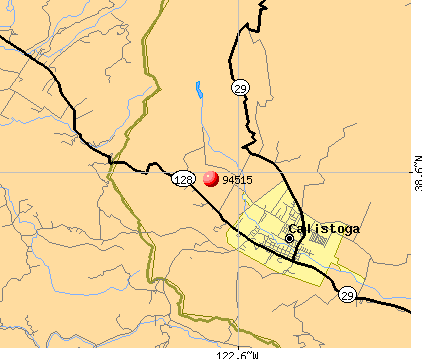
Notable locations in zip code 94515: Napa County Fairgrounds (A), Petrified Forest (B), Clover Flat Landfill (C), Traulsen Winery (D), Stonegate Winery (E), Sterling Vineyards (F), Roddis Cellar (G), Robert Pecota Winery (H), Ritchey Creek Campground (I), Mount Saint Helena Golf Course (J), L Pocai and Sons Winery (K), Hanns Kornell Champagne Cellars (L), Diamond Creek Vineyards (M), Cuvaison Winery (N), Chateau Montelena Winery (O), Alta Vineyard (P), Storybook Mountain Vineyards (Q), Charles F Shaw Vineyard and Winery (R), Aetna Springs Golf Course (S), Sharpsteen Museum (T). Display/hide their locations on the map
Churches in zip code 94515 include: Calistoga Baptist Church (A), Church of the Highlands (B), Community Presbyterian Church (C), First Church of Christ Scientist (D), Holy Assumption Monastery (E), Kingdom Hall of Jehovahs Witnesses (F), Our Lady of Perpetual Help Roman Catholic Church (G), Saint Lukes Episcopal Church (H), Seventh Day Adventist Church (I). Display/hide their locations on the map
Streams, rivers, and creeks: Biter Creek (A), Blossom Creek (B), Coon Creek (C), Cyrus Creek (D), Foote Creek (E), Garnett Creek (F), Kellogg Creek (G), La Franchi Creek (H), Little Briggs Creek (I). Display/hide their locations on the map
Parks in zip code 94515 include: Robert Louis Stevenson State Park (1), Schramsberg Winery Historical Marker (2), Pioneer Park (3). Display/hide their locations on the map
643 married couples with children.
114 single-parent households (12 men, 102 women).
66.2% of residents of 94515 zip code speak English at home.
30.3% of residents speak Spanish at home (51% very well, 23% well, 14% not well, 12% not at all).
3.4% of residents speak other Indo-European language at home (75% very well, 16% well, 8% not well).
0.3% of residents speak Asian or Pacific Island language at home (21% very well, 42% well, 37% not well).
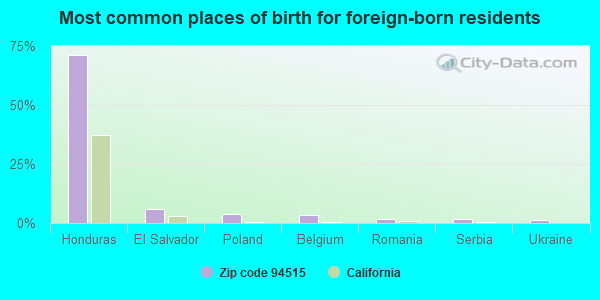
Foreign born population: 1,856 (26.6%) (47.5% of them are naturalized citizens)
This zip code:
26.6%
Whole state:
26.7%
71%Honduras
6%El Salvador
4%Poland
4%Belgium
2%Romania
2%Serbia
1%Ukraine
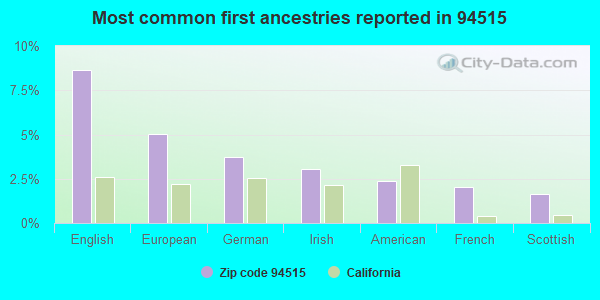
9%English
5%European
4%German
3%Irish
2%American
2%French
2%Scottish
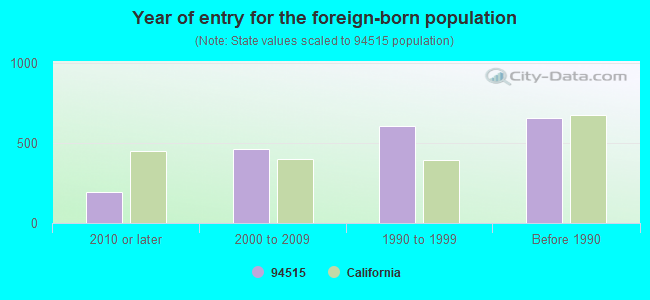
Year of entry for the foreign-born population
1942010 or later
4592000 to 2009
6031990 to 1999
655Before 1990
Facilities with environmental interests located in this zip code:
CALISTOGA AUTO PARTS INC (1318 LINCOLN AVE in CALISTOGA, CA)
STATE MASTER (California - Hazardous Waste Tracking) - HAZARDOU WASTE PROGRAM Small Quantity Generators, between 100 kg and 1000 kg of hazardous waste/month (Resource Conservation and Recovery Act (tracking hazardous waste)) - notification
CALISTOGA MINERAL WATER (865 SILVERADO TRAIL in CALISTOGA, CA)
STATE MASTER (California - Hazardous Waste Tracking) - HAZARDOU WASTE PROGRAM Small Quantity Generators, between 100 kg and 1000 kg of hazardous waste/month (Resource Conservation and Recovery Act (tracking hazardous waste)) Business NAICS classification: BOTTLED WATER MANUFACTURING. Organizations: NESTLE'S WATER NORTH AMERICA (CONTACT/OPERATOR)
CALTRANS DISTRICT 4 (1413 TUBBS LANE in CALISTOGA, CA) . Federal Facility
STATE MASTER (California - Hazardous Waste Tracking) - HAZARDOU WASTE PROGRAM Small Quantity Generators, between 100 kg and 1000 kg of hazardous waste/month (Resource Conservation and Recovery Act (tracking hazardous waste)) - notification Organizations: STATE OF CALIFORNIA (CONTACT/OWNER)
Alternative names: CALISTOGA MAINTENANCE STATION
EQUILON ENTERPRISES (1108 LINCOLN AVE/FOOTHILL in CALISTOGA, CA) . Federal Facility
STATE MASTER (California - Hazardous Waste Tracking) - HAZARDOU WASTE PROGRAM Small Quantity Generators, between 100 kg and 1000 kg of hazardous waste/month (Resource Conservation and Recovery Act (tracking hazardous waste)) - notification Organizations: EQUILON ENTERPRISES LLC (CONTACT/OWNER)
Alternative names: SHELL OIL CO
CALISTOGA ELEMENTARY (1327 BERRY ST. in CALISTOGA, CA)
(National Center for Education Statistics) - STATE ID-6026744 Organizations: CALISTOGA JOINT UNIFIED (SCHOOL DISTRICT)
CALISTOGA JUNIOR-SENIOR HIGH (1608 LAKE ST. in CALISTOGA, CA)
(National Center for Education Statistics) - STATE ID-2831758 Organizations: CALISTOGA JOINT UNIFIED (SCHOOL DISTRICT)
CALISTOGA WWTP (1232 WASHINGTON STREET in CALISTOGA, CA)
National Pollutant Discharge Elimination System NON-MAJOR (Tracking pollutant discharge elimination systems) - permit Business SIC classification: SEWERAGE SYSTEMS Organizations: CALISTOGA, CITY OF (CONTACT/OWNER)
Alternative names: CALISTOGA, CITY OF, CALISTOGA WASTE TREATMENT PLT
CALISTOGA AUTO BODY (1020-B FOOTHILL BLVD in CALISTOGA, CA)
Small Quantity Generators, between 100 kg and 1000 kg of hazardous waste/month (Resource Conservation and Recovery Act (tracking hazardous waste)) Organizations: NICHOLS JIM (CONTACT/OWNER)
CALISTOGA PRESS INC (1401 TUBBS LN in CALISTOGA, CA)
Small Quantity Generators, between 100 kg and 1000 kg of hazardous waste/month (Resource Conservation and Recovery Act (tracking hazardous waste)) - notification Business NAICS classification: COMMERCIAL LITHOGRAPHIC PRINTING. Organizations: DAVID CLAUS AND BOB HILLIS (CONTACT/OWNER)
LE STRANGE TRUCKING (17851 US HWY 128 in CALISTOGA, CA)
TRANSPORTER (Resource Conservation and Recovery Act (tracking hazardous waste)) Organizations: JOHN LE STRANGE (CONTACT/OWNER)
MARK BYRN AND SON TRUCKING (1559 CENTENIAL CIR in CALISTOGA, CA)
MCCORMICK FOUNDATION (9000 FRANZ VALLEY RD in CALISTOGA, CA)
COMPLIANCE ACTIVITY (Tracking inspections of insecticide, fungicide, and rodenticide, and toxic substances)
Housing units lacking complete plumbing facilities: 0.5% Housing units lacking complete kitchen facilities: 3.6%
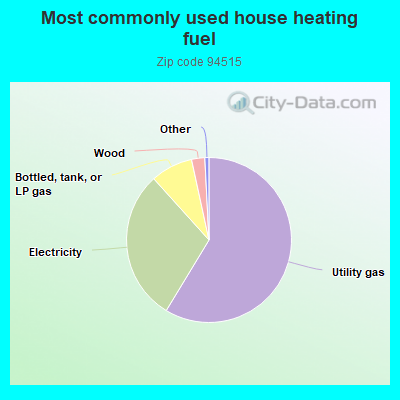
58.8%Utility gas
29.7%Electricity
8.3%Bottled, tank, or LP gas
2.6%Wood
Population in 1990: 5,758. Population change in the 1990s: +1,612 (+28.0%).
Place of birth for U.S.-born residents:
This state: 3,456
Northeast: 264
Midwest: 684
South: 225
West: 346
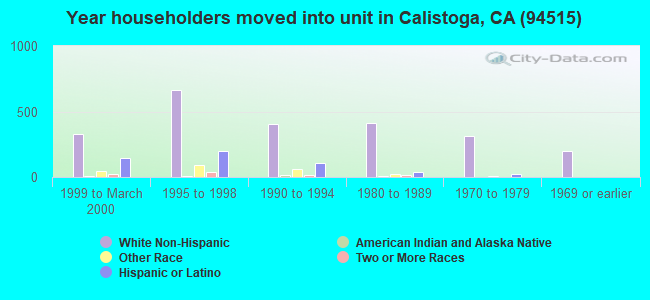
61% of the 94515 zip code residents lived in the same house 5 years ago. Out of people who lived in different houses, 51% lived in this county. Out of people who lived in different counties, 50% lived in California.
86% of the 94515 zip code residents lived in the same house 1 year ago. Out of people who lived in different houses, 34% moved from this county. Out of people who lived in different houses, 48% moved from different county within same state. Out of people who lived in different houses, 6% moved from different state. Out of people who lived in different houses, 12% moved from abroad.
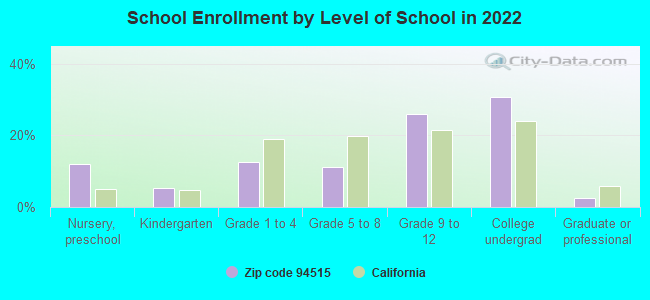
Private vs. public school enrollment:
Students in private schools in grades 1 to 8 (elementary and middle school): 5
Here:
2.3%
California:
10.5%
Students in private schools in grades 9 to 12 (high school): 3
Here:
1.4%
California:
8.5%
Students in private undergraduate colleges: 14
Here:
4.5%
California:
15.9%
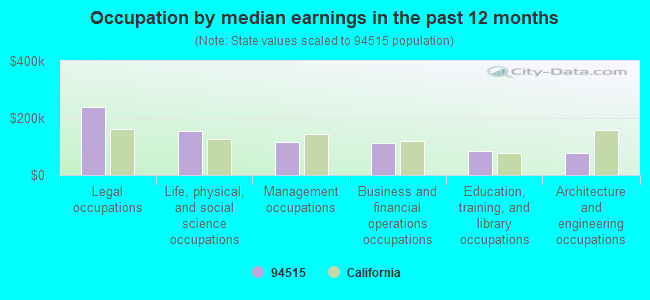
Occupation by median earnings in the past 12 months ($)
237,352Legal occupations
155,249Life, physical, and social science occupations
116,613Management occupations
113,785Business and financial operations occupations
83,999Education, training, and library occupations
78,076Architecture and engineering occupations
Companies with federal contracts located in this zip code:
JA GALLEGOS CONSTRUCTION (4485 SAINT HELENA HWY # 29 in CALISTOGA, CA; small business) : $21,086,100 in 45 contractsfrom 2003 to 2006
Contracts for Maintenance, Repair or Alteration of Real Property -- Other Non-Building Facilities by U.S. Army Corps of Engineers - civil program financing only, Army Signed by year:2000: $0; 2001: $0; 2002: $0; 2003: $2,252,000; 2004: $5,846,415; 2005: $12,582,756; 2006: $404,929.
Biggest contracts:
$2,970,794 with U.S. Army Corps of Engineers - civil program financing only for Maintenance, Repair or Alteration of Real Property -- Other Non-Building Facilities. Signed on 2005-09-08. Completion date: 2005-12-21.
$2,970,794 with Army for Maintenance, Repair or Alteration of Real Property -- Other Non-Building Facilities. Signed on 2005-09-08. Completion date: 2005-12-21.
$2,909,671, same as above.Signed on 2005-03-30. Completion date: 2005-11-11.
$2,909,671 with U.S. Army Corps of Engineers - civil program financing only for Maintenance, Repair or Alteration of Real Property -- Other Non-Building Facilities. Signed on 2005-03-30. Completion date: 2005-11-11.
Top industries in this zip code by the number of employees in 2005:
2005 - 2018 National Fire Incident Reporting System (NFIRS) incidents
According to the data from the years 2005 - 2018 the average number of fire incidents per year is 16. The highest number of fires - 29 took place in 2008, and the least - 4 in 2005. The data has an increasing trend.
When looking into fire subcategories, the most incidents belonged to: Outside Fires (63.3%), and Mobile Property/Vehicle Fires (16.8%).
Fire incident types reported to NFIRS in Zip Code 94515
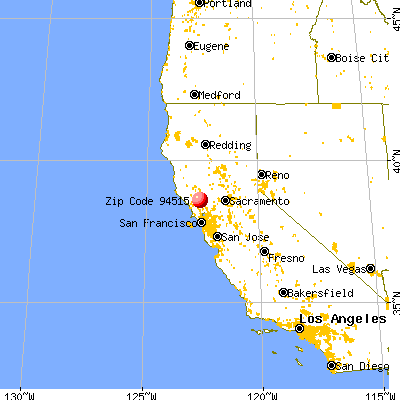


 Nearest zip codes: 95461, 95404, 94576, 95409, 94508, 95467.
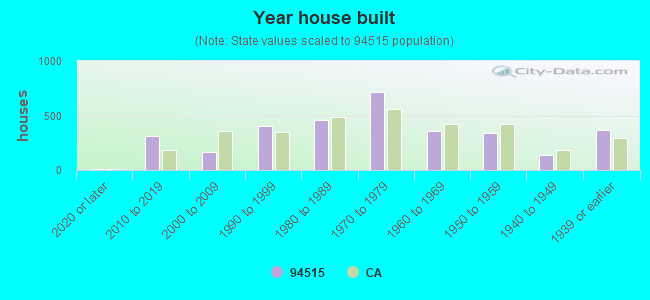


 According to the data from the years 2005 - 2018 the average number of fire incidents per year is 16. The highest number of fires - 29 took place in 2008, and the least - 4 in 2005. The data has an increasing trend.
 When looking into fire subcategories, the most incidents belonged to: Outside Fires (63.3%), and Mobile Property/Vehicle Fires (16.8%).