Estimated zip code population in 2022: 37,126 Zip code population in 2010: 39,761 Zip code population in 2000: 35,056
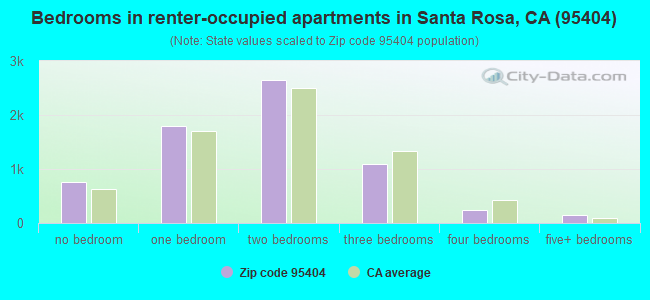
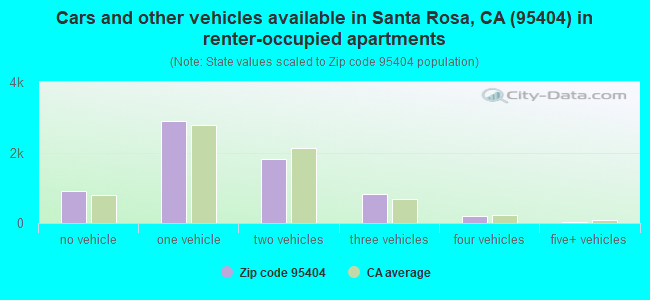
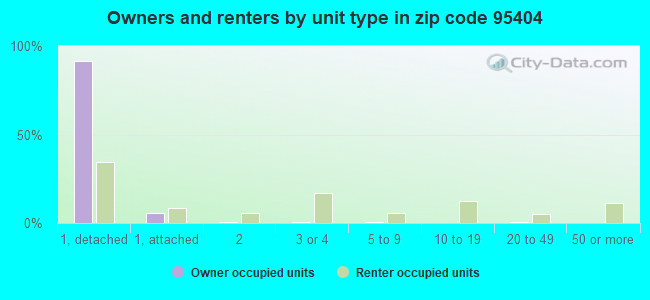
Houses and condos: 17,054 Renter-occupied apartments: 6,671
% of renters here:
42%
State:
44%
March 2022 cost of living index in zip code 95404: 116.8 (more than average, U.S. average is 100)
Land area: 80.0 sq. mi. Water area: 0.0 sq. mi.
Population density: 464 people per square mile
(low).
OSM Map
General Map
Google Map
MSN Map
OSM Map
General Map
Google Map
MSN Map
OSM Map
General Map
Google Map
MSN Map
OSM Map
General Map
Google Map
MSN Map
Please wait while loading the map...
Real estate property taxes paid for housing units in 2022:
This zip code:
0.7% ($6,096)
California:
0.7% ($4,831)
Median real estate property taxes paid for housing units with mortgages in 2022: $6,594 (0.8%) Median real estate property taxes paid for housing units with no mortgage in 2022: $4,789 (0.5%)
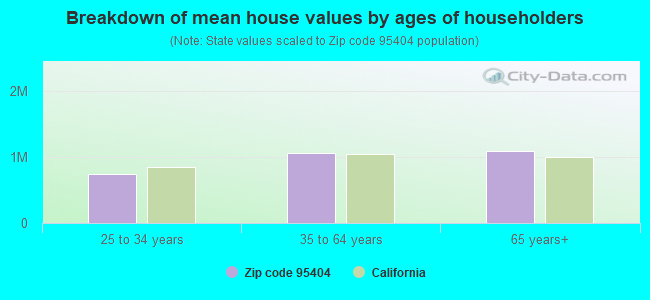
Estimated median house/condo value in 2022: $902,014
95404:
$902,014
California:
$715,900
According to our research of California and other state lists, there were 51 registered sex offenders living in 95404 zip code as of April 27, 2024. The ratio of all residents to sex offenders in zip code 95404 is 809 to 1. The ratio of registered sex offenders to all residents in this zip code is near the state average.
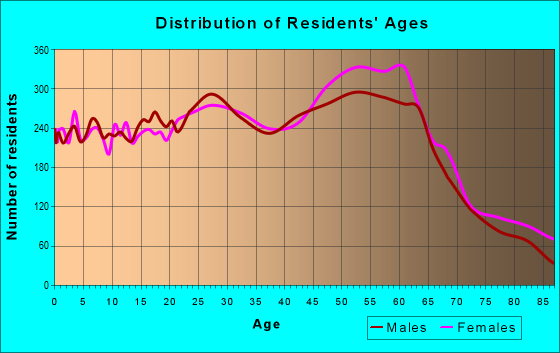
Median resident age:
This zip code:
43.3 years
California median age:
37.9 years
Average household size:
This zip code:
2.3 people
California:
2.8 people
Averages for the 2020 tax year for zip code 95404, filed in 2021:
Average Adjusted Gross Income (AGI) in 2020: $106,576 (Individual Income Tax Returns)
Here:
$106,576
State:
$95,910
Salary/wage: $78,464 (reported on 77.1% of returns)
Here:
$78,464
State:
$77,331
(% of AGI for various income ranges: 1283.8% for AGIs below $25k, 4142.4% for AGIs $25k-50k, 7426.7% for AGIs $50k-75k, 10929.8% for AGIs $75k-100k, 20038.8% for AGIs $100k-200k, 92440.6% for AGIs over 200k)
Taxable interest for individuals: $3,113 (reported on 44.2% of returns)
This zip code:
$3,113
California:
$2,294
(% of AGI for various income ranges: 36.1% for AGIs below $25k, 41.6% for AGIs $25k-50k, 67.3% for AGIs $50k-75k, 153.2% for AGIs $75k-100k, 404.0% for AGIs $100k-200k, 3038.6% for AGIs over 200k)
Ordinary dividends: $13,130 (reported on 27.6% of returns)
Here:
$13,130
State:
$10,949
(% of AGI for various income ranges: 67.3% for AGIs below $25k, 94.4% for AGIs $25k-50k, 198.1% for AGIs $50k-75k, 369.9% for AGIs $75k-100k, 914.6% for AGIs $100k-200k, 8668.8% for AGIs over 200k)
Net capital gain/loss in AGI: +$36,652 (reported on 26.4% of returns)
Here:
+$36,652
State:
+$49,306
(% of AGI for various income ranges: 44.7% for AGIs below $25k, 73.0% for AGIs $25k-50k, 164.2% for AGIs $50k-75k, 331.2% for AGIs $75k-100k, 1184.0% for AGIs $100k-200k, 31285.2% for AGIs over 200k)
Profit/loss from business: +$27,530 (reported on 18.8% of returns)
Here:
+$27,530
State:
+$15,671
(% of AGI for various income ranges: 186.1% for AGIs below $25k, 339.0% for AGIs $25k-50k, 408.2% for AGIs $50k-75k, 669.5% for AGIs $75k-100k, 1661.6% for AGIs $100k-200k, 9064.6% for AGIs over 200k)
Taxable individual retirement arrangement distribution: $26,806 (reported on 10.4% of returns)
95404:
$26,806
California:
$23,505
(% of AGI for various income ranges: 69.7% for AGIs below $25k, 110.4% for AGIs $25k-50k, 273.0% for AGIs $50k-75k, 495.0% for AGIs $75k-100k, 1258.4% for AGIs $100k-200k, 3872.4% for AGIs over 200k)
Self-employed (Keogh) retirement plans: $22,474 (reported on 1.8% of returns)
95404:
$22,474
California:
$30,163
(% of AGI for various income ranges: 7.6% for AGIs $25k-50k, 21.7% for AGIs $50k-75k, 36.5% for AGIs $75k-100k, 105.0% for AGIs $100k-200k, 1029.2% for AGIs over 200k)
Total itemized deductions: $35,354 (reported on 18.9% of returns)
Here:
$35,354
State:
$39,517
(% of AGI for various income ranges: 179.8% for AGIs below $25k, 224.6% for AGIs $25k-50k, 561.8% for AGIs $50k-75k, 1182.8% for AGIs $75k-100k, 2664.3% for AGIs $100k-200k, 10914.0% for AGIs over 200k)
Charity contributions: $6,889 (reported on 14.7% of returns)
Here:
$6,889
State:
$12,598
(% of AGI for various income ranges: 6.5% for AGIs below $25k, 13.3% for AGIs $25k-50k, 50.9% for AGIs $50k-75k, 90.4% for AGIs $75k-100k, 301.6% for AGIs $100k-200k, 2476.4% for AGIs over 200k)
Taxes paid: $8,924 (reported on 18.8% of returns)
95404:
$8,924
State:
$8,807
(% of AGI for various income ranges: 31.3% for AGIs below $25k, 51.7% for AGIs $25k-50k, 154.3% for AGIs $50k-75k, 353.7% for AGIs $75k-100k, 790.9% for AGIs $100k-200k, 2304.2% for AGIs over 200k)
Earned income credit: $1,705 (reported on 7.9% of returns)
Here:
$1,705
State:
$2,074
(% of AGI for various income ranges: 53.9% for AGIs below $25k, 38.4% for AGIs $25k-50k)
Percentage of individuals using paid preparers for their 2020 taxes: 92.9%
Here:
93%
State:
92%
(% for various income ranges: 90.6% for AGIs below $25k, 92.3% for AGIs $25k-50k, 93.2% for AGIs $50k-75k, 93.1% for AGIs $75k-100k, 94.6% for AGIs $100k-200k, 95.6% for AGIs over 200k)
Averages for the 2012 tax year for zip code 95404, filed in 2013:
Average Adjusted Gross Income (AGI) in 2012: $85,664 (Individual Income Tax Returns)
Here:
$85,664
State:
$72,726
Salary/wage: $62,789 (reported on 78.2% of returns)
Here:
$62,789
State:
$59,079
(% of AGI for various income ranges: 70.1% for AGIs below $25k, 76.1% for AGIs $25k-50k, 69.4% for AGIs $50k-75k, 64.4% for AGIs $75k-100k, 64.4% for AGIs $100k-200k, 43.9% for AGIs over 200k)
Taxable interest for individuals: $2,887 (reported on 43.5% of returns)
This zip code:
$2,887
California:
$2,146
(% of AGI for various income ranges: 1.7% for AGIs below $25k, 1.0% for AGIs $25k-50k, 1.2% for AGIs $50k-75k, 1.3% for AGIs $75k-100k, 1.4% for AGIs $100k-200k, 1.7% for AGIs over 200k)
Ordinary dividends: $9,877 (reported on 28.7% of returns)
Here:
$9,877
State:
$9,308
(% of AGI for various income ranges: 3.5% for AGIs below $25k, 1.8% for AGIs $25k-50k, 2.6% for AGIs $50k-75k, 2.5% for AGIs $75k-100k, 3.2% for AGIs $100k-200k, 4.0% for AGIs over 200k)
Net capital gain/loss in AGI: +$29,753 (reported on 25.8% of returns)
Here:
+$29,753
State:
+$30,460
(% of AGI for various income ranges: 0.5% for AGIs $25k-50k, 0.8% for AGIs $50k-75k, 1.0% for AGIs $75k-100k, 2.2% for AGIs $100k-200k, 18.9% for AGIs over 200k)
Profit/loss from business: +$31,514 (reported on 20.8% of returns)
Here:
+$31,514
State:
+$17,064
(% of AGI for various income ranges: 12.1% for AGIs below $25k, 8.1% for AGIs $25k-50k, 6.4% for AGIs $50k-75k, 6.5% for AGIs $75k-100k, 7.4% for AGIs $100k-200k, 7.7% for AGIs over 200k)
Taxable individual retirement arrangement distribution: $24,776 (reported on 12.1% of returns)
95404:
$24,776
California:
$19,557
(% of AGI for various income ranges: 3.2% for AGIs below $25k, 2.5% for AGIs $25k-50k, 3.7% for AGIs $50k-75k, 4.7% for AGIs $75k-100k, 4.4% for AGIs $100k-200k, 3.0% for AGIs over 200k)
Self-employment retirement plans: $22,610 (reported on 2.1% of returns)
95404:
$22,610
California:
$24,530
(% of AGI for various income ranges: 0.3% for AGIs $25k-50k, 0.2% for AGIs $50k-75k, 0.4% for AGIs $75k-100k, 0.7% for AGIs $100k-200k, 0.8% for AGIs over 200k)
Total itemized deductions: $36,327 (23% of AGI, reported on 42.0% of returns)
Here:
$36,327
State:
$34,004
Here:
22.7% of AGI
State:
22.7% of AGI
(% of AGI for various income ranges: 15.9% for AGIs below $25k, 12.5% for AGIs $25k-50k, 17.4% for AGIs $50k-75k, 20.0% for AGIs $75k-100k, 20.4% for AGIs $100k-200k, 17.4% for AGIs over 200k)
Charity contributions: $4,159 (reported on 34.8% of returns)
Here:
$4,159
State:
$4,659
(% of AGI for various income ranges: 0.7% for AGIs below $25k, 0.7% for AGIs $25k-50k, 1.2% for AGIs $50k-75k, 1.5% for AGIs $75k-100k, 1.8% for AGIs $100k-200k, 2.1% for AGIs over 200k)
Taxes paid: $16,274 (reported on 41.8% of returns)
95404:
$16,274
State:
$14,448
(% of AGI for various income ranges: 3.2% for AGIs below $25k, 2.9% for AGIs $25k-50k, 4.7% for AGIs $50k-75k, 6.5% for AGIs $75k-100k, 8.1% for AGIs $100k-200k, 10.5% for AGIs over 200k)
Earned income credit: $1,766 (reported on 11.5% of returns)
Here:
$1,766
State:
$2,286
(% of AGI for various income ranges: 3.7% for AGIs below $25k, 0.6% for AGIs $25k-50k)
Percentage of individuals using paid preparers for their 2012 taxes: 57.4%
Here:
57%
State:
64%
(% for various income ranges: 50.3% for AGIs below $25k, 52.5% for AGIs $25k-50k, 58.4% for AGIs $50k-75k, 63.4% for AGIs $75k-100k, 66.2% for AGIs $100k-200k, 77.6% for AGIs over 200k)
Averages for the 2004 tax year for zip code 95404, filed in 2005:
Average Adjusted Gross Income (AGI) in 2004: $67,640 (Individual Income Tax Returns)
Here:
$67,640
State:
$58,600
Salary/wage: $53,243 (reported on 78.5% of returns)
Here:
$53,243
State:
$49,455
(% of AGI for various income ranges: 72.5% for AGIs $10k-25k, 77.4% for AGIs $25k-50k, 72.2% for AGIs $50k-75k, 69.7% for AGIs $75k-100k, 51.3% for AGIs over 100k)
Taxable interest for individuals: $3,561 (reported on 53.6% of returns)
This zip code:
$3,561
California:
$2,365
(% of AGI for various income ranges: 3.6% for AGIs $10k-25k, 2.5% for AGIs $25k-50k, 2.3% for AGIs $50k-75k, 2.3% for AGIs $75k-100k, 2.7% for AGIs over 100k)
Taxable dividends: $5,042 (reported on 34.7% of returns)
Here:
$5,042
State:
$4,746
(% of AGI for various income ranges: 2.8% for AGIs $10k-25k, 1.8% for AGIs $25k-50k, 2.2% for AGIs $50k-75k, 2.4% for AGIs $75k-100k, 2.6% for AGIs over 100k)
Net capital gain/loss: +$22,113 (reported on 30.8% of returns)
Here:
+$22,113
State:
+$23,418
(% of AGI for various income ranges: 0.9% for AGIs $10k-25k, 0.8% for AGIs $25k-50k, 1.4% for AGIs $50k-75k, 2.2% for AGIs $75k-100k, 15.8% for AGIs over 100k)
Profit/loss from business: +$30,948 (reported on 20.9% of returns)
Here:
+$30,948
State:
+$16,826
(% of AGI for various income ranges: 9.3% for AGIs $10k-25k, 6.5% for AGIs $25k-50k, 7.9% for AGIs $50k-75k, 7.6% for AGIs $75k-100k, 10.9% for AGIs over 100k)
IRA payment deduction: $3,349 (reported on 3.4% of returns)
95404:
$3,349
California:
$3,192
(% of AGI for various income ranges: 0.3% for AGIs $10k-25k, 0.3% for AGIs $25k-50k, 0.2% for AGIs $50k-75k, 0.2% for AGIs $75k-100k, 0.1% for AGIs over 100k)
Self-employed pension: $19,483 (reported on 3.3% of returns)
Here:
$19,483
California:
$17,688
(% of AGI for various income ranges: 0.2% for AGIs $10k-25k, 0.3% for AGIs $25k-50k, 0.5% for AGIs $50k-75k, 0.6% for AGIs $75k-100k, 1.3% for AGIs over 100k)
Total itemized deductions: $30,431 (25% of AGI, reported on 43.8% of returns)
Here:
$30,431
State:
$28,113
Here:
24.7% of AGI
State:
25.3% of AGI
(% of AGI for various income ranges: 19.0% for AGIs $10k-25k, 16.7% for AGIs $25k-50k, 21.7% for AGIs $50k-75k, 24.7% for AGIs $75k-100k, 18.2% for AGIs over 100k)
Charity contributions deductions: $3,500 (3% of AGI, reported on 38.6% of returns)
Here:
$3,500
State:
$3,923
Here:
2.7% of AGI
State:
3.3% of AGI
(% of AGI for various income ranges: 0.9% for AGIs $10k-25k, 1.2% for AGIs $25k-50k, 1.7% for AGIs $50k-75k, 2.2% for AGIs $75k-100k, 2.2% for AGIs over 100k)
Total tax: $12,748 (reported on 80.2% of returns)
95404:
$12,748
State:
$10,761
(% of AGI for various income ranges: 5.1% for AGIs $10k-25k, 7.9% for AGIs $25k-50k, 9.8% for AGIs $50k-75k, 10.6% for AGIs $75k-100k, 19.1% for AGIs over 100k)
Earned income credit: $1,349 (reported on 8.2% of returns)
Here:
$1,349
State:
$1,763
Percentage of individuals using paid preparers for their 2004 taxes: 61.3%
Here:
61%
State:
66%
(% for various income ranges: 52.7% for AGIs below $10k, 57.6% for AGIs $10k-25k, 57.7% for AGIs $25k-50k, 64.6% for AGIs $50k-75k, 68.8% for AGIs $75k-100k, 72.8% for AGIs over 100k)
Likely homosexual households (counted as self-reported same-sex unmarried-partner households)
Lesbian couples: 0.2% of all households
Gay men: 0.6% of all households
Household received Food Stamps/SNAP in the past 12 months: 1,154 Household did not receive Food Stamps/SNAP in the past 12 months: 14,631
Women who had a birth in the past 12 months: 208 (158 now married, 49 unmarried) Women who did not have a birth in the past 12 months: 8,638 (3,761 now married, 4,862 unmarried)
Housing units in zip code 95404 with a mortgage: 6,410 (874 second mortgage, 18 home equity loan, 711 both second mortgage and home equity loan) Houses without a mortgage: 106
Median monthly owner costs for units with a mortgage: $3,048 Median monthly owner costs for units without a mortgage: $883
Residents with income below the poverty level in 2022:
This zip code:
8.5%
Whole state:
12.2%
Residents with income below 50% of the poverty level in 2022:
This zip code:
3.2%
Whole state:
6.2%
Median number of rooms in houses and condos:
Here:
6.1
State:
6.0
Median number of rooms in apartments:
Here:
3.8
State:
3.9
Notable locations in this zip code not listed on our city pages
Notable locations in zip code 95404: Mark West Creek Rancheria (A), Matanzas Creek Winery (B), Santa Rosa City Hall (C), Santa Rosa Seniors Center (D), Santa Rosa Central Branch Sonoma County Library (E), Santa Rosa Fire Department Station 1 Headquarters (F), Chanate Hall (G), Bennett Valley Grange Hall (H), Veterans Memorial Auditorium (I), Sonoma Life Support Post 16 (J), Sonoma Life Support Post 1 Headquarters (K), Rincon Valley Fire Protection District Alpine Station (L), Santa Rosa Fire Department Station 11 (M), Santa Rosa Fire Department Station 5 (N), Mountain Volunteer Fire Department (O), Bennett Valley Fire Protection District (P). Display/hide their locations on the map
Churches in zip code 95404 include: Apostolic Bible Church (A), Bethlehem Lutheran Church (B), The Church of Jesus Christ of Latter Day Saints (C), Church of Religious Science (D), Church of the Incarnation (E), Church of the Nazarene (F), First Church of Christ Scientist (G), First Congregational Church of Santa Rosa (H), First Presbyterian Church (I). Display/hide their locations on the map
Cemeteries: Bennett Valley Cemetery (1), Independent Order of Oddfellows Cemetery (2), Santa Rosa Calvary Cemetery (3), Santa Rosa Rural Cemetery (4), Fulkerson Cemetery (5), Stanley Cemetery (6), Moke Cemetery (7). Display/hide their locations on the map
Creeks: Deadhorse Creek (A), Ducker Creek (B), Humbug Creek (C), Matanzas Creek (D), Mill Creek (E), Neal Creek (F), Weeks Creek (G), Van Buren Creek (H), Spring Creek (I). Display/hide their locations on the map
Parks in zip code 95404 include: Franklin Park (1), Fremont Park (2), Hidden Valley Park (3), Martin Luther King Junior Park (4), Rincon Valley Community Park (5), Sonoma County Fairgrounds (6), Upper Brush Creek Neighborhood Park (7), Humboldt Street Park (8), North Park (9). Display/hide their locations on the map
4,496 married couples with children.
1,919 single-parent households (608 men, 1,311 women).
77.6% of residents of 95404 zip code speak English at home.
14.2% of residents speak Spanish at home (61% very well, 19% well, 15% not well, 5% not at all).
3.4% of residents speak other Indo-European language at home (80% very well, 12% well, 8% not well).
4.2% of residents speak Asian or Pacific Island language at home (60% very well, 28% well, 10% not well, 2% not at all).
0.4% of residents speak other language at home (36% very well, 64% well).
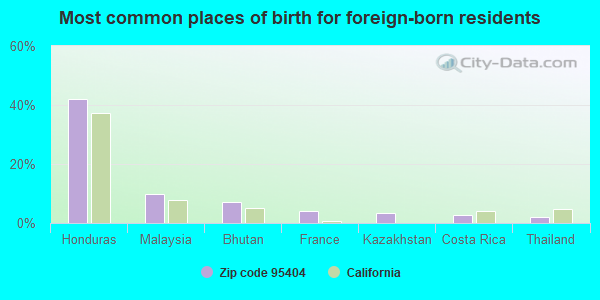
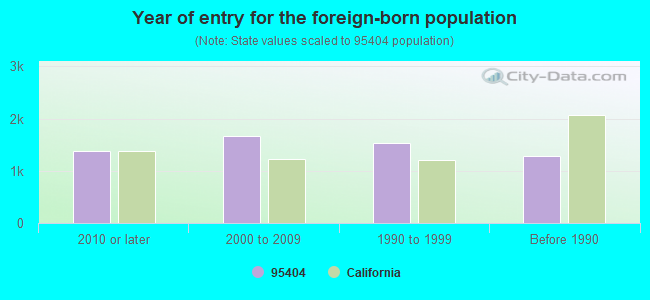
Foreign born population: 5,262 (14.2%) (43.4% of them are naturalized citizens)
Major facilities with environmental interests located in this zip code:
ABLE AUTO BODY AND PAINTING (2630 PETALUMA HILL ROAD in SANTA ROSA, CA)
STATE MASTER (California - Hazardous Waste Tracking) - HAZARDOU WASTE PROGRAM CRITERIA AND HAZARDOUS AIR POLLUTANT INVENTORY (Inventory of air pollution sources) Small Quantity Generators, between 100 kg and 1000 kg of hazardous waste/month (Resource Conservation and Recovery Act (tracking hazardous waste)) - notification Business SIC classification: TOP, BODY, AND UPHOLSTERY REPAIR SHOPS AND PAINT SHOPS Business NAICS classification: AUTOMOTIVE BODY, PAINT, AND INTERIOR REPAIR AND MAINTENANCE. Organizations: TODD WILLIAM (CONTACT/OWNER)
JERALD MARQUIS AUTO BODY (950 PETALUMA HILL ROAD in SANTA ROSA, CA)
STATE MASTER (California - Hazardous Waste Tracking) - HAZARDOU WASTE PROGRAM CRITERIA AND HAZARDOUS AIR POLLUTANT INVENTORY (Inventory of air pollution sources) Small Quantity Generators, between 100 kg and 1000 kg of hazardous waste/month (Resource Conservation and Recovery Act (tracking hazardous waste)) - notification Business SIC classification: TOP, BODY, AND UPHOLSTERY REPAIR SHOPS AND PAINT SHOPS Business NAICS classification: AUTOMOTIVE BODY, PAINT, AND INTERIOR REPAIR AND MAINTENANCE. Organizations: MARQUIS, JERALD (CONTACT/OWNER)
Alternative names: JERALD MARQUIS CO
MAACO AUTO PAINTING & BODYWORK (112 COMMERCIAL COURT in SANTA ROSA, CA)
STATE MASTER (California - Hazardous Waste Tracking) - HAZARDOU WASTE PROGRAM CRITERIA AND HAZARDOUS AIR POLLUTANT INVENTORY (Inventory of air pollution sources) Small Quantity Generators, between 100 kg and 1000 kg of hazardous waste/month (Resource Conservation and Recovery Act (tracking hazardous waste)) - notification Business SIC classification: TOP, BODY, AND UPHOLSTERY REPAIR SHOPS AND PAINT SHOPS Business NAICS classification: AUTOMOTIVE BODY, PAINT, AND INTERIOR REPAIR AND MAINTENANCE. Organizations: M. JEFFERY (CONTACT/OWNER)
ANTHONYS NORTH INCORPORATED (509 FRAZIER AVENUE in SANTA ROSA, CA)
STATE MASTER (California - Hazardous Waste Tracking) - HAZARDOU WASTE PROGRAM CRITERIA AND HAZARDOUS AIR POLLUTANT INVENTORY (Inventory of air pollution sources) Small Quantity Generators, between 100 kg and 1000 kg of hazardous waste/month (Resource Conservation and Recovery Act (tracking hazardous waste)) - notification Business SIC classification: TOP, BODY, AND UPHOLSTERY REPAIR SHOPS AND PAINT SHOPS Organizations: GARY HOWARD (CONTACT/OWNER)
Alternative names: ANTHONYS AUTO CRAFT NORTH
CHUCK'S BRAKE & WHEEL INC (540 BARHAM AVE in SANTA ROSA, CA)
STATE MASTER (California - Hazardous Waste Tracking) - HAZARDOU WASTE PROGRAM Small Quantity Generators, between 100 kg and 1000 kg of hazardous waste/month (Resource Conservation and Recovery Act (tracking hazardous waste)) - notification Organizations: CHIESA RICK (CONTACT/OWNER)
CHEVRON STATION 91168 (1715 SANTA ROSA AVE in SANTA ROSA, CA)
STATE MASTER (California - Hazardous Waste Tracking) - HAZARDOU WASTE PROGRAM Small Quantity Generators, between 100 kg and 1000 kg of hazardous waste/month (Resource Conservation and Recovery Act (tracking hazardous waste)) - notification Organizations: CHEVRON PRODUCTS CO (CONTACT/OWNER)
Alternative names: CHEVRON STATION #91168
FREEMAN NISSAN (1275 SANTA ROSA AVENUE in SANTA ROSA, CA)
STATE MASTER (California - Hazardous Waste Tracking) - HAZARDOU WASTE PROGRAM CRITERIA AND HAZARDOUS AIR POLLUTANT INVENTORY (Inventory of air pollution sources) Business SIC classification: MOTOR VEHICLE DEALERS (NEW AND USED) Alternative names: SANTA ROSA NISSAN
FREMONT (JOHN) ELEMENTARY (756 HUMBOLDT ST. in SANTA ROSA, CA)
(National Center for Education Statistics) - STATE ID-6052138 Organizations: SANTA ROSA ELEMENTARY (SCHOOL DISTRICT)
HIDDEN VALLEY ELEMENTARY (3435 BONITA VISTA DR. in SANTA ROSA, CA)
(National Center for Education Statistics) - STATE ID-6095459 Organizations: SANTA ROSA ELEMENTARY (SCHOOL DISTRICT)
KAWANA ELEMENTARY (2121 MORAGA DR. in SANTA ROSA, CA)
(National Center for Education Statistics) - STATE ID-6051593 Organizations: BELLEVUE UNION ELEMENTARY (SCHOOL DISTRICT)
NUEVA VISTA HIGH (CONT.) (2230 LOMITAS AVE. in SANTA ROSA, CA)
(National Center for Education Statistics) - STATE ID-4930137 Organizations: SANTA ROSA HIGH (SCHOOL DISTRICT)
FIREFORM PORCELAIN INC (368 YOLANDA AVE in SANTA ROSA, CA)
Small Quantity Generators, between 100 kg and 1000 kg of hazardous waste/month (Resource Conservation and Recovery Act (tracking hazardous waste)) - notification TRANSPORTER (Resource Conservation and Recovery Act (tracking hazardous waste)) - notification Organizations: JIM BURCH (CONTACT/OWNER)
G&C AUTO BODY (251 BELLEVUE AVENUE in SANTA ROSA, CA)
ENFORCEMENT/COMPLIANCE ACTIVITY (Integrated Compliance Information System) CRITERIA AND HAZARDOUS AIR POLLUTANT INVENTORY (Inventory of air pollution sources) Small Quantity Generators, between 100 kg and 1000 kg of hazardous waste/month (Resource Conservation and Recovery Act (tracking hazardous waste)) - notification Business SIC classification: TOP, BODY, AND UPHOLSTERY REPAIR SHOPS AND PAINT SHOPS Organizations: EUGENE CROZAT (CONTACT/OWNER)
Housing units lacking complete plumbing facilities: 1.9% Housing units lacking complete kitchen facilities: 2.7%
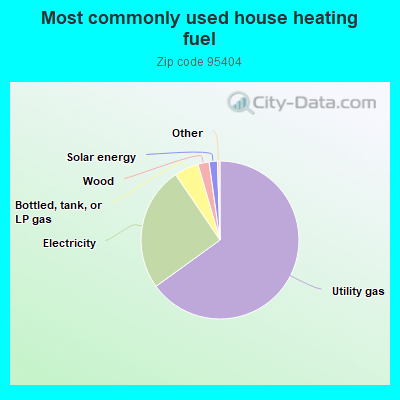
65.1%Utility gas
25.5%Electricity
5.0%Bottled, tank, or LP gas
2.3%Wood
1.7%Solar energy
Population in 1990: 31,216. Population change in the 1990s: +3,840 (+12.3%).
Place of birth for U.S.-born residents:
This state: 23,278
Northeast: 2,026
Midwest: 2,494
South: 1,481
West: 1,877
53% of the 95404 zip code residents lived in the same house 5 years ago. Out of people who lived in different houses, 67% lived in this county. Out of people who lived in different counties, 50% lived in California.
86% of the 95404 zip code residents lived in the same house 1 year ago. Out of people who lived in different houses, 62% moved from this county. Out of people who lived in different houses, 22% moved from different county within same state. Out of people who lived in different houses, 10% moved from different state. Out of people who lived in different houses, 4% moved from abroad.
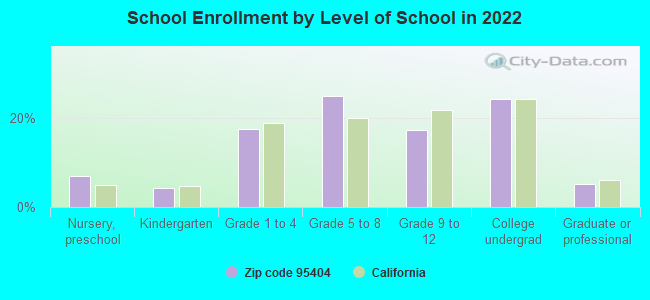
Private vs. public school enrollment:
Students in private schools in grades 1 to 8 (elementary and middle school): 538
Here:
15.6%
California:
10.5%
Students in private schools in grades 9 to 12 (high school): 150
Here:
10.8%
California:
8.5%
Students in private undergraduate colleges: 99
Here:
5.1%
California:
15.9%
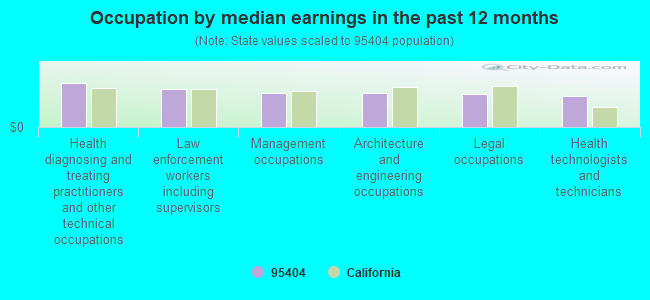
Occupation by median earnings in the past 12 months ($)
128,436Health diagnosing and treating practitioners and other technical occupations
112,109Law enforcement workers including supervisors
99,233Management occupations
98,507Architecture and engineering occupations
97,652Legal occupations
91,438Health technologists and technicians
Companies with federal contracts located in this zip code (SANTA ROSA, CA):
PETALUMA BUILDING MAINTENANCE, (72 KAWANA SPRINGS RD; small business) : $1,450,551 in 25 contractsfrom 1999 to 2005
Contracts for Custodial Janitorial Services, Hospital Buildings, Operation of Government-Owned Facilities -- Office Buildings, Maintenance, Repair or Alteration of Real Property -- Hospitals and Infirmaries, and moreby Public Buildings Service, Department of Veterans Affairs, National Park Service, Army, and others Signed by year:2000: $645,000; 2001: $430,000; 2002: $0; 2003: $47,208; 2004: $75,765; 2005: $104,578; 2006: $0.
Biggest contracts:
$260,000 with Public Buildings Service for Custodial Janitorial Services. Signed on 2001-01-15. Completion date: 2001-07-15.
$216,000 with Department of Veterans Affairs for Hospital Buildings. Signed on 2000-09-15. Completion date: 2001-08-15.
$185,000 with Public Buildings Service for Operation of Government-Owned Facilities -- Office Buildings. Signed on 2000-07-15. Completion date: 2001-01-15.
$112,000 with Department of Veterans Affairs for Hospital Buildings. Signed on 2000-09-15. Completion date: 2001-08-15.
SANTA ROSA, CITY OF (100 SANTA ROSA AVE) : $22,982 in 4 contractsfrom 2004 to 2006
$11,310 with Army for Lease or Rental of Facilities -- Parking Facilities Conservation. Signed on 2004-11-04. Completion date: 2005-09-30.
$8,924, same as above.Signed on 2006-01-27. Completion date: 2006-09-30.
$2,748, same as above.Signed on 2005-11-09. Completion date: 2006-09-30.
$0, same as above.Signed on 2005-11-09. Completion date: 2006-09-30.
STEPAHNIE CARNATION (3968 MILLBROOK DR; small business) : $22,000 in 3 contractsfrom 2002 to 2004
$22,000 with United States Coast Guard (disused code: now 7008) for Other Medical Services. Signed on 2002-03-15. Completion date: 2002-09-15.
$0 with U.S. Coast Guard for Other Medical Services. Signed on 2004-03-17. Completion date: 2004-09-30.
$0, same as above.Signed on 2004-03-17. Completion date: 2004-09-30.
NORTH BAY COOPERATIVE LIBRARY (55 E ST) : $7,192 in 2 contractsfrom 2004 to 2005
$3,802 with Air Force for Library Services. Signed on 2005-10-01. Completion date: 2006-09-30.
$3,390 with Air Force for Other Professional Services. Signed on 2004-10-01. Completion date: 2005-09-30.
ICORE TECHNOLOGIES, INC (900 MONROE STREET; small business)
-$283,939 with Navy for Defense Electronics and Communication Equipment -- Applied Research and Exploratory Development (R&D). Signed on 2002-02-13. Completion date: 2001-10-08.
Top industries in this zip code by the number of employees in 2005:
Health Care and Social Assistance: General Medical and Surgical Hospitals (over 1000 employees: 1 establishment)
Administrative and Support and Waste Management and Remediation Services: Temporary Help Services (250-499: 1, 100-249: 1, 50-99: 1, 20-49: 1, 5-9: 1, 1-4: 1)
Professional, Scientific, and Technical Services: Offices of Lawyers (20-49: 1, 10-19: 9, 5-9: 10, 1-4: 85)
Health Care and Social Assistance: Offices of Physicians (except Mental Health Specialists) (100-249: 1, 20-49: 2, 10-19: 4, 5-9: 8, 1-4: 26)
2005 - 2018 National Fire Incident Reporting System (NFIRS) incidents
According to the data from the years 2005 - 2018 the average number of fires per year is 86. The highest number of reported fire incidents - 139 took place in 2013, and the least - 27 in 2018. The data has a dropping trend.
When looking into fire subcategories, the most incidents belonged to: Outside Fires (42.6%), and Structure Fires (41.4%).
Fire incident types reported to NFIRS in Zip Code 95404


 Nearest zip codes: 95403, 95405, 95439, 95409, 95401, 95492.
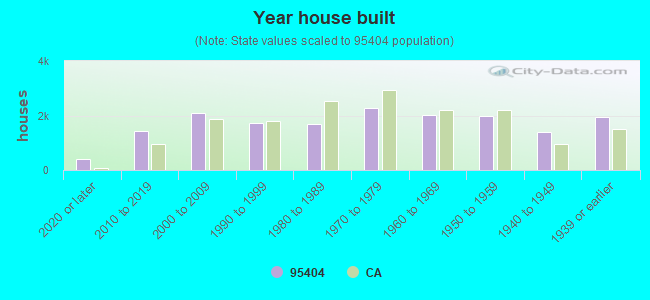


 According to the data from the years 2005 - 2018 the average number of fires per year is 86. The highest number of reported fire incidents - 139 took place in 2013, and the least - 27 in 2018. The data has a dropping trend.
 When looking into fire subcategories, the most incidents belonged to: Outside Fires (42.6%), and Structure Fires (41.4%).