Estimated zip code population in 2022: 23,550 Zip code population in 2010: 21,399 Zip code population in 2000: 22,247
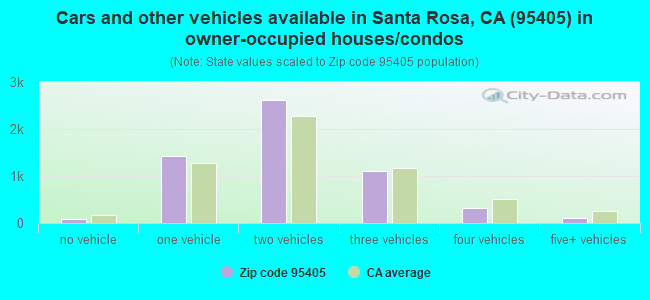
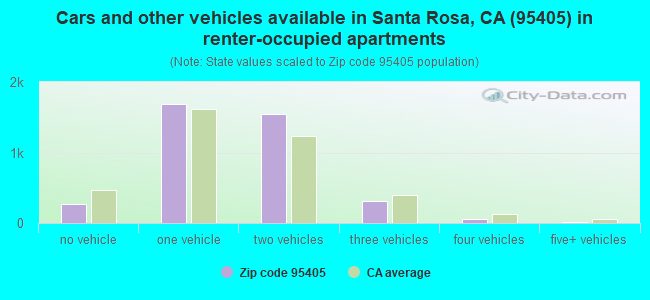
Houses and condos: 9,743 Renter-occupied apartments: 3,889
% of renters here:
41%
State:
44%
March 2022 cost of living index in zip code 95405: 115.1 (more than average, U.S. average is 100)
Land area: 5.5 sq. mi. Water area: 0.0 sq. mi.
Population density: 4,300 people per square mile
(average).
OSM Map
General Map
Google Map
MSN Map
OSM Map
General Map
Google Map
MSN Map
OSM Map
General Map
Google Map
MSN Map
OSM Map
General Map
Google Map
MSN Map
Please wait while loading the map...
Real estate property taxes paid for housing units in 2022:
This zip code:
0.6% ($4,598)
California:
0.7% ($4,831)
Median real estate property taxes paid for housing units with mortgages in 2022: $5,092 (0.7%) Median real estate property taxes paid for housing units with no mortgage in 2022: $3,606 (0.4%)
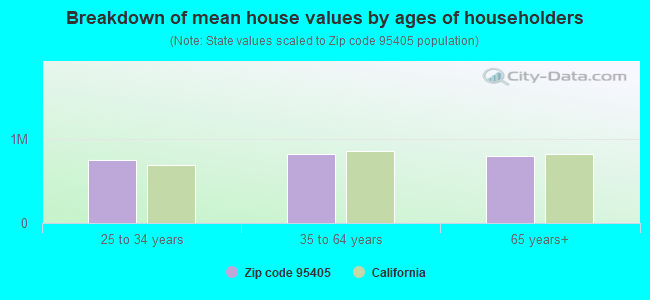
Estimated median house/condo value in 2022: $793,538
95405:
$793,538
California:
$715,900
According to our research of California and other state lists, there were 16 registered sex offenders living in 95405 zip code as of April 27, 2024. The ratio of all residents to sex offenders in zip code 95405 is 1,354 to 1. The ratio of registered sex offenders to all residents in this zip code is lower than the state average.
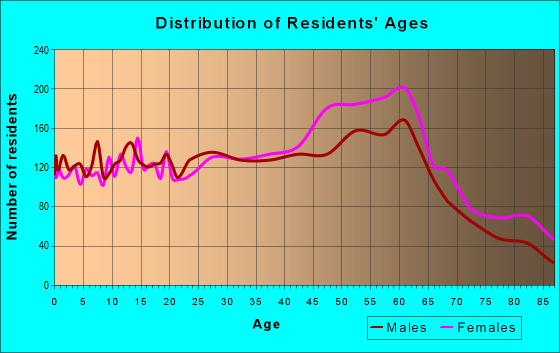
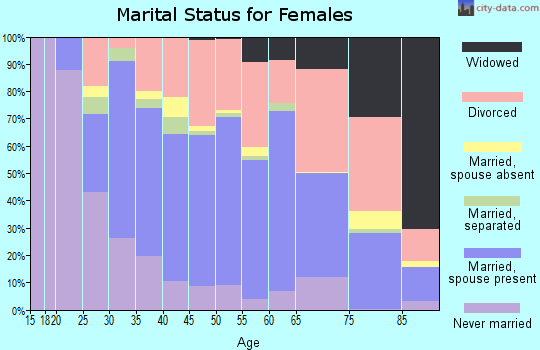
Median resident age:
This zip code:
44.3 years
California median age:
37.9 years
Average household size:
This zip code:
2.4 people
California:
2.8 people
Averages for the 2020 tax year for zip code 95405, filed in 2021:
Average Adjusted Gross Income (AGI) in 2020: $94,353 (Individual Income Tax Returns)
Here:
$94,353
State:
$95,910
Salary/wage: $80,224 (reported on 74.7% of returns)
Here:
$80,224
State:
$77,331
(% of AGI for various income ranges: 1195.9% for AGIs below $25k, 3983.2% for AGIs $25k-50k, 7124.9% for AGIs $50k-75k, 10003.9% for AGIs $75k-100k, 20044.9% for AGIs $100k-200k, 82448.3% for AGIs over 200k)
Taxable interest for individuals: $2,071 (reported on 48.8% of returns)
This zip code:
$2,071
California:
$2,294
(% of AGI for various income ranges: 36.1% for AGIs below $25k, 55.8% for AGIs $25k-50k, 102.8% for AGIs $50k-75k, 145.9% for AGIs $75k-100k, 239.2% for AGIs $100k-200k, 1869.3% for AGIs over 200k)
Ordinary dividends: $7,799 (reported on 30.6% of returns)
Here:
$7,799
State:
$10,949
(% of AGI for various income ranges: 75.9% for AGIs below $25k, 134.0% for AGIs $25k-50k, 241.8% for AGIs $50k-75k, 338.4% for AGIs $75k-100k, 574.2% for AGIs $100k-200k, 4428.6% for AGIs over 200k)
Net capital gain/loss in AGI: +$18,879 (reported on 28.0% of returns)
Here:
+$18,879
State:
+$49,306
(% of AGI for various income ranges: 17.6% for AGIs below $25k, 81.0% for AGIs $25k-50k, 187.0% for AGIs $50k-75k, 302.9% for AGIs $75k-100k, 822.5% for AGIs $100k-200k, 15746.9% for AGIs over 200k)
Profit/loss from business: +$25,928 (reported on 19.0% of returns)
Here:
+$25,928
State:
+$15,671
(% of AGI for various income ranges: 199.8% for AGIs below $25k, 371.1% for AGIs $25k-50k, 471.8% for AGIs $50k-75k, 603.4% for AGIs $75k-100k, 1316.0% for AGIs $100k-200k, 8263.8% for AGIs over 200k)
Taxable individual retirement arrangement distribution: $22,045 (reported on 13.4% of returns)
95405:
$22,045
California:
$23,505
(% of AGI for various income ranges: 111.3% for AGIs below $25k, 175.0% for AGIs $25k-50k, 375.8% for AGIs $50k-75k, 568.7% for AGIs $75k-100k, 1022.7% for AGIs $100k-200k, 3499.0% for AGIs over 200k)
Self-employed (Keogh) retirement plans: $23,758 (reported on 1.7% of returns)
95405:
$23,758
California:
$30,163
(% of AGI for various income ranges: 51.6% for AGIs $50k-75k, 89.5% for AGIs $100k-200k, 1018.6% for AGIs over 200k)
Total itemized deductions: $32,606 (reported on 19.4% of returns)
Here:
$32,606
State:
$39,517
(% of AGI for various income ranges: 171.5% for AGIs below $25k, 333.4% for AGIs $25k-50k, 616.6% for AGIs $50k-75k, 1234.0% for AGIs $75k-100k, 2242.9% for AGIs $100k-200k, 8467.2% for AGIs over 200k)
Charity contributions: $5,460 (reported on 15.0% of returns)
Here:
$5,460
State:
$12,598
(% of AGI for various income ranges: 7.5% for AGIs below $25k, 18.3% for AGIs $25k-50k, 40.1% for AGIs $50k-75k, 101.6% for AGIs $75k-100k, 255.7% for AGIs $100k-200k, 1707.6% for AGIs over 200k)
Taxes paid: $8,575 (reported on 19.4% of returns)
95405:
$8,575
State:
$8,807
(% of AGI for various income ranges: 31.3% for AGIs below $25k, 60.1% for AGIs $25k-50k, 150.5% for AGIs $50k-75k, 356.6% for AGIs $75k-100k, 700.6% for AGIs $100k-200k, 1960.3% for AGIs over 200k)
Earned income credit: $1,743 (reported on 6.9% of returns)
Here:
$1,743
State:
$2,074
(% of AGI for various income ranges: 56.6% for AGIs below $25k, 36.7% for AGIs $25k-50k)
Percentage of individuals using paid preparers for their 2020 taxes: 92.6%
Here:
93%
State:
92%
(% for various income ranges: 89.1% for AGIs below $25k, 92.3% for AGIs $25k-50k, 93.3% for AGIs $50k-75k, 92.8% for AGIs $75k-100k, 94.7% for AGIs $100k-200k, 95.5% for AGIs over 200k)
Averages for the 2012 tax year for zip code 95405, filed in 2013:
Average Adjusted Gross Income (AGI) in 2012: $70,411 (Individual Income Tax Returns)
Here:
$70,411
State:
$72,726
Salary/wage: $59,658 (reported on 76.9% of returns)
Here:
$59,658
State:
$59,079
(% of AGI for various income ranges: 65.5% for AGIs below $25k, 70.3% for AGIs $25k-50k, 67.2% for AGIs $50k-75k, 68.9% for AGIs $75k-100k, 70.2% for AGIs $100k-200k, 54.4% for AGIs over 200k)
Taxable interest for individuals: $1,848 (reported on 45.7% of returns)
This zip code:
$1,848
California:
$2,146
(% of AGI for various income ranges: 1.8% for AGIs below $25k, 1.1% for AGIs $25k-50k, 1.2% for AGIs $50k-75k, 1.3% for AGIs $75k-100k, 1.0% for AGIs $100k-200k, 1.3% for AGIs over 200k)
Ordinary dividends: $6,473 (reported on 29.2% of returns)
Here:
$6,473
State:
$9,308
(% of AGI for various income ranges: 3.5% for AGIs below $25k, 2.2% for AGIs $25k-50k, 2.1% for AGIs $50k-75k, 1.9% for AGIs $75k-100k, 1.9% for AGIs $100k-200k, 4.3% for AGIs over 200k)
Net capital gain/loss in AGI: +$11,778 (reported on 25.0% of returns)
Here:
+$11,778
State:
+$30,460
(% of AGI for various income ranges: 0.2% for AGIs $25k-50k, 1.0% for AGIs $50k-75k, 0.6% for AGIs $75k-100k, 1.6% for AGIs $100k-200k, 13.0% for AGIs over 200k)
Profit/loss from business: +$24,590 (reported on 19.7% of returns)
Here:
+$24,590
State:
+$17,064
(% of AGI for various income ranges: 11.2% for AGIs below $25k, 6.9% for AGIs $25k-50k, 5.5% for AGIs $50k-75k, 5.8% for AGIs $75k-100k, 6.2% for AGIs $100k-200k, 7.9% for AGIs over 200k)
Taxable individual retirement arrangement distribution: $16,745 (reported on 13.9% of returns)
95405:
$16,745
California:
$19,557
(% of AGI for various income ranges: 4.1% for AGIs below $25k, 3.4% for AGIs $25k-50k, 4.0% for AGIs $50k-75k, 3.8% for AGIs $75k-100k, 3.6% for AGIs $100k-200k, 2.3% for AGIs over 200k)
Self-employment retirement plans: $17,500 (reported on 1.8% of returns)
95405:
$17,500
California:
$24,530
(% of AGI for various income ranges: 0.3% for AGIs $25k-50k, 0.2% for AGIs $50k-75k, 0.2% for AGIs $75k-100k, 0.5% for AGIs $100k-200k, 0.8% for AGIs over 200k)
Total itemized deductions: $28,327 (24% of AGI, reported on 42.2% of returns)
Here:
$28,327
State:
$34,004
Here:
23.6% of AGI
State:
22.7% of AGI
(% of AGI for various income ranges: 18.1% for AGIs below $25k, 12.5% for AGIs $25k-50k, 15.6% for AGIs $50k-75k, 17.4% for AGIs $75k-100k, 18.9% for AGIs $100k-200k, 17.0% for AGIs over 200k)
Charity contributions: $3,174 (reported on 35.3% of returns)
Here:
$3,174
State:
$4,659
(% of AGI for various income ranges: 0.8% for AGIs below $25k, 0.9% for AGIs $25k-50k, 1.2% for AGIs $50k-75k, 1.5% for AGIs $75k-100k, 1.8% for AGIs $100k-200k, 2.1% for AGIs over 200k)
Taxes paid: $10,740 (reported on 41.8% of returns)
95405:
$10,740
State:
$14,448
(% of AGI for various income ranges: 2.9% for AGIs below $25k, 2.8% for AGIs $25k-50k, 4.2% for AGIs $50k-75k, 5.7% for AGIs $75k-100k, 7.4% for AGIs $100k-200k, 9.0% for AGIs over 200k)
Earned income credit: $1,594 (reported on 10.4% of returns)
Here:
$1,594
State:
$2,286
(% of AGI for various income ranges: 3.1% for AGIs below $25k, 0.6% for AGIs $25k-50k)
Percentage of individuals using paid preparers for their 2012 taxes: 54.0%
Here:
54%
State:
64%
(% for various income ranges: 44.9% for AGIs below $25k, 52.2% for AGIs $25k-50k, 57.4% for AGIs $50k-75k, 60.0% for AGIs $75k-100k, 62.6% for AGIs $100k-200k, 71.4% for AGIs over 200k)
Averages for the 2004 tax year for zip code 95405, filed in 2005:
Average Adjusted Gross Income (AGI) in 2004: $61,846 (Individual Income Tax Returns)
Here:
$61,846
State:
$58,600
Salary/wage: $50,946 (reported on 77.9% of returns)
Here:
$50,946
State:
$49,455
(% of AGI for various income ranges: 174.4% for AGIs below $10k, 67.2% for AGIs $10k-25k, 74.9% for AGIs $25k-50k, 70.9% for AGIs $50k-75k, 72.4% for AGIs $75k-100k, 55.6% for AGIs over 100k)
Taxable interest for individuals: $2,927 (reported on 56.5% of returns)
This zip code:
$2,927
California:
$2,365
(% of AGI for various income ranges: 17.6% for AGIs below $10k, 4.1% for AGIs $10k-25k, 2.3% for AGIs $25k-50k, 2.1% for AGIs $50k-75k, 1.8% for AGIs $75k-100k, 2.9% for AGIs over 100k)
Taxable dividends: $3,425 (reported on 35.4% of returns)
Here:
$3,425
State:
$4,746
(% of AGI for various income ranges: 18.0% for AGIs below $10k, 2.8% for AGIs $10k-25k, 1.8% for AGIs $25k-50k, 1.7% for AGIs $50k-75k, 1.5% for AGIs $75k-100k, 2.0% for AGIs over 100k)
Net capital gain/loss: +$14,427 (reported on 29.5% of returns)
Here:
+$14,427
State:
+$23,418
(% of AGI for various income ranges: -9.2% for AGIs below $10k, 1.2% for AGIs $10k-25k, 0.4% for AGIs $25k-50k, 1.5% for AGIs $50k-75k, 2.3% for AGIs $75k-100k, 12.3% for AGIs over 100k)
Profit/loss from business: +$28,128 (reported on 19.3% of returns)
Here:
+$28,128
State:
+$16,826
(% of AGI for various income ranges: 8.2% for AGIs below $10k, 8.9% for AGIs $10k-25k, 6.6% for AGIs $25k-50k, 6.5% for AGIs $50k-75k, 7.3% for AGIs $75k-100k, 10.4% for AGIs over 100k)
IRA payment deduction: $3,271 (reported on 3.9% of returns)
95405:
$3,271
California:
$3,192
(% of AGI for various income ranges: 0.6% for AGIs below $10k, 0.4% for AGIs $10k-25k, 0.4% for AGIs $25k-50k, 0.3% for AGIs $50k-75k, 0.3% for AGIs $75k-100k, 0.1% for AGIs over 100k)
Self-employed pension: $15,303 (reported on 3.4% of returns)
Here:
$15,303
California:
$17,688
(% of AGI for various income ranges: 0.3% for AGIs $10k-25k, 0.4% for AGIs $25k-50k, 0.4% for AGIs $50k-75k, 0.7% for AGIs $75k-100k, 1.2% for AGIs over 100k)
Total itemized deductions: $25,746 (25% of AGI, reported on 44.8% of returns)
Here:
$25,746
State:
$28,113
Here:
24.5% of AGI
State:
25.3% of AGI
(% of AGI for various income ranges: 57.6% for AGIs below $10k, 18.1% for AGIs $10k-25k, 15.6% for AGIs $25k-50k, 20.4% for AGIs $50k-75k, 22.2% for AGIs $75k-100k, 17.7% for AGIs over 100k)
Charity contributions deductions: $2,802 (3% of AGI, reported on 40.2% of returns)
Here:
$2,802
State:
$3,923
Here:
2.6% of AGI
State:
3.3% of AGI
(% of AGI for various income ranges: 2.7% for AGIs below $10k, 1.2% for AGIs $10k-25k, 1.2% for AGIs $25k-50k, 1.7% for AGIs $50k-75k, 2.3% for AGIs $75k-100k, 2.0% for AGIs over 100k)
Total tax: $10,513 (reported on 82.6% of returns)
95405:
$10,513
State:
$10,761
(% of AGI for various income ranges: 7.2% for AGIs below $10k, 5.2% for AGIs $10k-25k, 8.3% for AGIs $25k-50k, 9.8% for AGIs $50k-75k, 10.7% for AGIs $75k-100k, 18.8% for AGIs over 100k)
Earned income credit: $1,354 (reported on 7.8% of returns)
Here:
$1,354
State:
$1,763
Percentage of individuals using paid preparers for their 2004 taxes: 58.7%
Here:
59%
State:
66%
(% for various income ranges: 48.3% for AGIs below $10k, 54.0% for AGIs $10k-25k, 56.5% for AGIs $25k-50k, 63.5% for AGIs $50k-75k, 65.6% for AGIs $75k-100k, 70.0% for AGIs over 100k)
Likely homosexual households (counted as self-reported same-sex unmarried-partner households)
Lesbian couples: 0.3% of all households
Gay men: 0.0% of all households
Household received Food Stamps/SNAP in the past 12 months: 483 Household did not receive Food Stamps/SNAP in the past 12 months: 8,885
Women who had a birth in the past 12 months: 197 (158 now married, 38 unmarried) Women who did not have a birth in the past 12 months: 5,000 (2,392 now married, 2,591 unmarried)
Housing units in zip code 95405 with a mortgage: 3,775 (473 second mortgage, 429 both second mortgage and home equity loan) Houses without a mortgage: 28
Median monthly owner costs for units with a mortgage: $2,693 Median monthly owner costs for units without a mortgage: $729
Residents with income below the poverty level in 2022:
This zip code:
7.9%
Whole state:
12.2%
Residents with income below 50% of the poverty level in 2022:
This zip code:
2.1%
Whole state:
6.2%
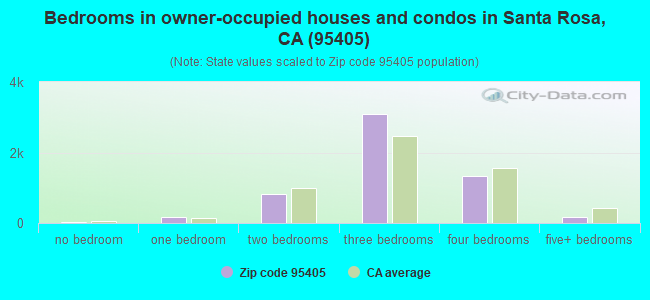
Median number of rooms in houses and condos:
Here:
6.1
State:
6.0
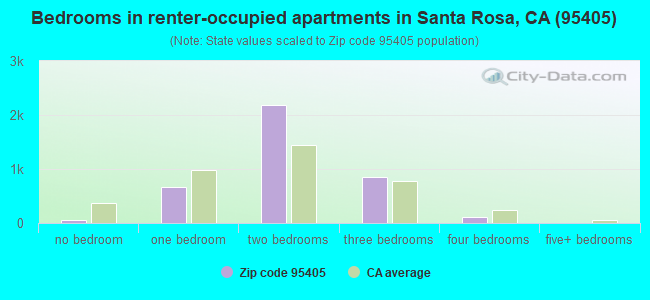
Median number of rooms in apartments:
Here:
4.3
State:
3.9
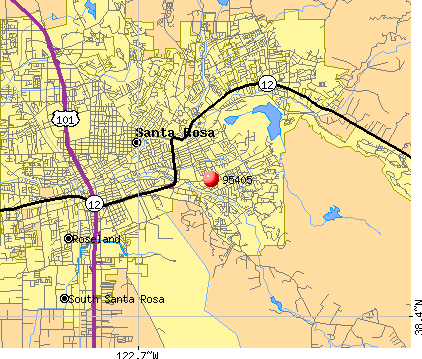
Notable locations in this zip code not listed on our city pages
Notable locations in zip code 95405: Santa Rosa Boys Club (A), Bennett Valley Golf Course (B), Santa Rosa Fire Department Station 4 (C). Display/hide their locations on the map
Shopping Centers: Flamingo One Stop Shopping Center (1), Montgomery Village Shopping Center (2), Mayette Village Shopping Center (3), Lakeside Shopping Center (4), Bennett Valley Shopping Center (5). Display/hide their locations on the map
Churches in zip code 95405 include: Bennett Valley Baptist Church (A), Community Baptist Church (B), First Baptist Church (C), Presbyterian Church of the Roses (D), Saint Eugenes Cathedral (E), Church of Christ (F), First United Methodist Church (G). Display/hide their locations on the map
Parks in zip code 95405 include: Doyle Park (1), Galvan Community Park (2), Howarth Memorial Park (3), Matanzas Park (4), Mesquite Park (5), Eastside Park (6). Display/hide their locations on the map
2,707 married couples with children.
1,148 single-parent households (516 men, 632 women).
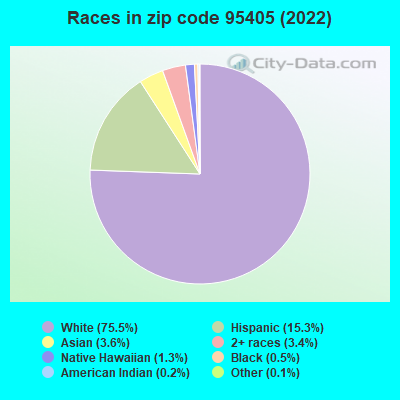
85.2% of residents of 95405 zip code speak English at home.
7.2% of residents speak Spanish at home (70% very well, 21% well, 7% not well, 2% not at all).
3.2% of residents speak other Indo-European language at home (78% very well, 22% well).
4.1% of residents speak Asian or Pacific Island language at home (69% very well, 13% well, 16% not well, 2% not at all).
0.1% of residents speak other language at home (100% very well).
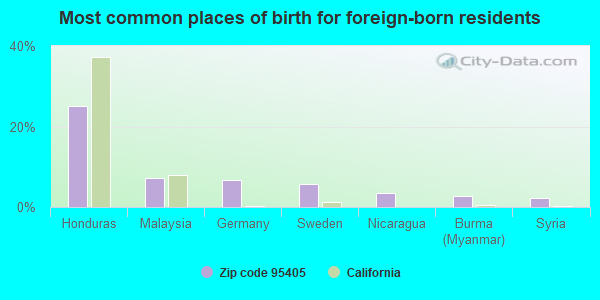
Foreign born population: 2,496 (10.6%) (58.4% of them are naturalized citizens)
Facilities with environmental interests located in this zip code:
EXXON SERVICE STATION 73035 (4501 SONOMA HIGHWAY in SANTA ROSA, CA)
STATE MASTER (California - Hazardous Waste Tracking) - HAZARDOU WASTE PROGRAM Small Quantity Generators, between 100 kg and 1000 kg of hazardous waste/month (Resource Conservation and Recovery Act (tracking hazardous waste)) - notification Organizations: EXXON MOBIL (CONTACT/OWNER)
Alternative names: EXXON MOBIL CORPORATION #730350, EXXON RAS NO 73035, EXXON SERVICE STATION NO 7-3035
MATANZAS ELEMENTARY (1687 YULUPA AVE. in SANTA ROSA, CA)
(National Center for Education Statistics) - STATE ID-6052039 Organizations: RINCON VALLEY UNION ELEMENTARY (SCHOOL DISTRICT)
NEXUS LEARNING COMMUNITY (1620 SONOMA AVE. in SANTA ROSA, CA)
(National Center for Education Statistics) - STATE ID-4930335 Organizations: SANTA ROSA HIGH (SCHOOL DISTRICT)
MONTGOMERY VILLAGE SHOPPING CTR (711 VILLAGE CT in SANTA ROSA, CA)
Large Quantity Generators, more that 1000 kg of hazardous waste/month (Resource Conservation and Recovery Act (tracking hazardous waste)) Organizations: MONTGOMERY VILLAGE LTD PARTNERSHIP (CONTACT/OPERATOR)
ANNADEL CLEANERS (2700 YULUPA AVENUE in SANTA ROSA, CA)
CRITERIA AND HAZARDOUS AIR POLLUTANT INVENTORY (Inventory of air pollution sources) Small Quantity Generators, between 100 kg and 1000 kg of hazardous waste/month (Resource Conservation and Recovery Act (tracking hazardous waste)) Business SIC classification: DRYCLEANING PLANTS, EXCEPT RUG CLEANING Organizations: CHOI SOOK (CONTACT/OWNER)
Alternative names: ANNADEL DRY CLEANERS
JOSE H CRUZ (4257 HOEN AVE in SANTA ROSA, CA)
TRANSPORTER (Resource Conservation and Recovery Act (tracking hazardous waste))
MAJOR CLEANERS (2533 GUERNEVILLE RD in SANTA ROSA, CA)
Small Quantity Generators, between 100 kg and 1000 kg of hazardous waste/month (Resource Conservation and Recovery Act (tracking hazardous waste)) - notification Organizations: FRANK MAJCHEREK (CONTACT/OWNER)
1111 RADIOLOGY INC (1111 SONOMA AVE 112 in SANTA ROSA, CA)
Small Quantity Generators, between 100 kg and 1000 kg of hazardous waste/month (Resource Conservation and Recovery Act (tracking hazardous waste)) - notification
LEE HISTOLOGY LAB (1144 MONTGOMERY DR in SANTA ROSA, CA)
Small Quantity Generators, between 100 kg and 1000 kg of hazardous waste/month (Resource Conservation and Recovery Act (tracking hazardous waste)) - notification Business NAICS classification: MEDICAL LABORATORIES. Organizations: THOMAS LEE (CONTACT/OWNER)
CHEMMARK OF SANTA ROSA (5360 NEWANGA AVENUE in SANTA ROSA, CA)
COMPLIANCE ACTIVITY (Tracking inspections of insecticide, fungicide, and rodenticide, and toxic substances)
INSTITUTE FOR BETTER HEALTH (3936 MAYETTE AVE in SANTA ROSA, CA)
COMPLIANCE ACTIVITY (Tracking inspections of insecticide, fungicide, and rodenticide, and toxic substances)
LAKESIDE CLEANERS (4211 MONTGOMERY in SANTA ROSA, CA)
CRITERIA AND HAZARDOUS AIR POLLUTANT INVENTORY (Inventory of air pollution sources) Business SIC classification: DRYCLEANING PLANTS, EXCEPT RUG CLEANING
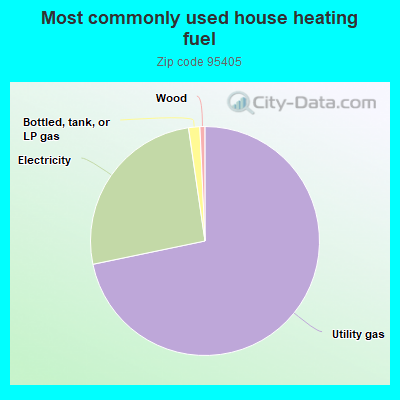
71.6%Utility gas
25.9%Electricity
1.6%Bottled, tank, or LP gas
0.7%Wood
Population in 1990: 20,776. Population change in the 1990s: +1,471 (+7.1%).
Place of birth for U.S.-born residents:
This state: 15,534
Northeast: 1,354
Midwest: 1,583
South: 1,358
West: 875
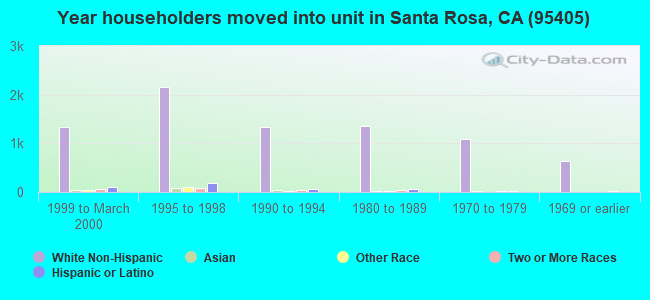
55% of the 95405 zip code residents lived in the same house 5 years ago. Out of people who lived in different houses, 66% lived in this county. Out of people who lived in different counties, 50% lived in California.
89% of the 95405 zip code residents lived in the same house 1 year ago. Out of people who lived in different houses, 54% moved from this county. Out of people who lived in different houses, 36% moved from different county within same state. Out of people who lived in different houses, 1% moved from different state. Out of people who lived in different houses, 9% moved from abroad.
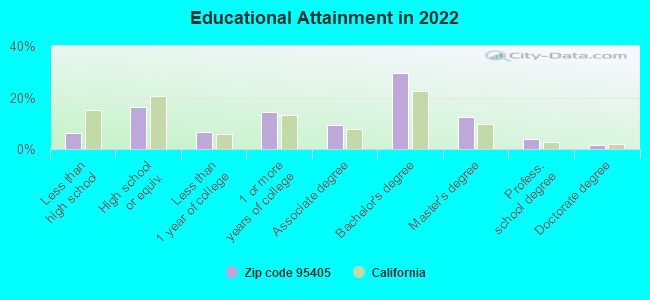
Private vs. public school enrollment:
Students in private schools in grades 1 to 8 (elementary and middle school): 321
Here:
16.1%
California:
10.5%
Students in private schools in grades 9 to 12 (high school): 84
Here:
7.3%
California:
8.5%
Students in private undergraduate colleges: 147
Here:
17.7%
California:
15.9%
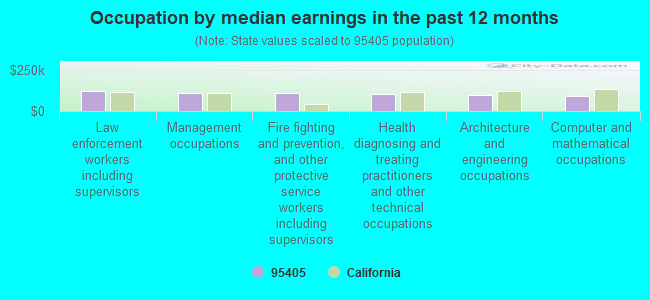
Occupation by median earnings in the past 12 months ($)
123,527Law enforcement workers including supervisors
110,399Management occupations
109,076Fire fighting and prevention, and other protective service workers including supervisors
100,223Health diagnosing and treating practitioners and other technical occupations
98,988Architecture and engineering occupations
91,474Computer and mathematical occupations
Companies with federal contracts located in this zip code:
DOUBLESHOT CORPORATION (4614 MORRIS COURT in SANTA ROSA, CA; small business) : $3,594,382 in 6 contractsfrom 2005 to 2006
Contracts for Other Defense -- Advanced Development (R&D), Miscellaneous Communication Equipment, ADP Software by Navy, Army Signed by year:2000: $0; 2001: $0; 2002: $0; 2003: $0; 2004: $0; 2005: $1,036,425; 2006: $2,557,957.
Biggest contracts:
$1,820,319 with Navy for Other Defense -- Advanced Development (R&D). Signed on 2006-04-18. Completion date: 2006-10-24.
$749,994, same as above.Signed on 2005-05-17. Completion date: 2006-05-16.
$659,338, same as above.Signed on 2006-07-10. Completion date: 2006-11-30.
$234,431, same as above.Signed on 2005-09-13. Completion date: 2006-05-16.
FOR 3D, INC (2627 CANTERBURY DRIVE in SANTA ROSA, CA; small business) : $169,327 in 2 contractsin 2004
$99,979 with Navy for Other Defense -- Operational Systems Development (R&D). Signed on 2004-08-26. Completion date: 2004-11-30.
$69,348 with Army for Defense Electronics and Communication Equipment -- Basic Research (R&D). Signed on 2004-12-14. Completion date: 2005-10-13.
RESOURCESYS (2429 COMPADRE DRIVE in SANTA ROSA, CA; small business)
$2,990 with Army for Cable, Cord, and Wire Assemblies: Communications Equipment. Taking place in VT. Signed on 2003-04-02. Completion date: 2003-04-18.
Top industries in this zip code by the number of employees in 2005:
Health Care and Social Assistance: General Medical and Surgical Hospitals (over 1000 employees: 1 establishment)
Health Care and Social Assistance: Offices of Physicians (except Mental Health Specialists) (100-249: 1, 50-99: 2, 20-49: 6, 10-19: 18, 5-9: 23, 1-4: 61)
Health Care and Social Assistance: Offices of Dentists (20-49: 3, 10-19: 11, 5-9: 37, 1-4: 33)
2005 - 2018 National Fire Incident Reporting System (NFIRS) incidents
Based on the data from the years 2005 - 2018 the average number of fire incidents per year is 30. The highest number of fires - 49 took place in 2006, and the least - 6 in 2018. The data has a declining trend.
When looking into fire subcategories, the most incidents belonged to: Structure Fires (49.8%), and Outside Fires (36.3%).
Fire incident types reported to NFIRS in Zip Code 95405


 Nearest zip codes: 95407, 95409, 95404, 94928, 95403, 94951.
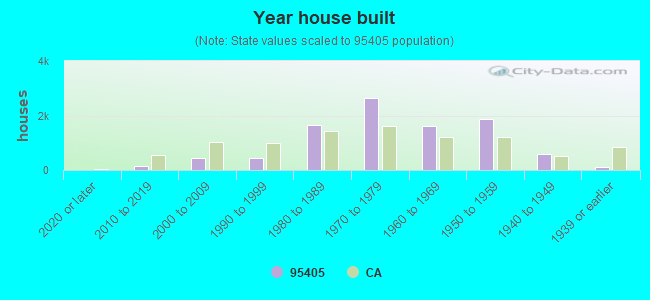


 Based on the data from the years 2005 - 2018 the average number of fire incidents per year is 30. The highest number of fires - 49 took place in 2006, and the least - 6 in 2018. The data has a declining trend.
 When looking into fire subcategories, the most incidents belonged to: Structure Fires (49.8%), and Outside Fires (36.3%).