Estimated zip code population in 2022: 45,847 Zip code population in 2010: 43,170 Zip code population in 2000: 42,542
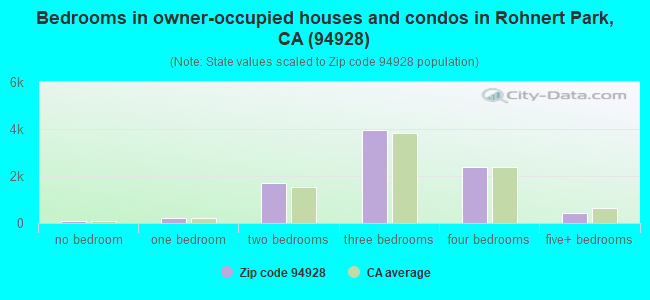
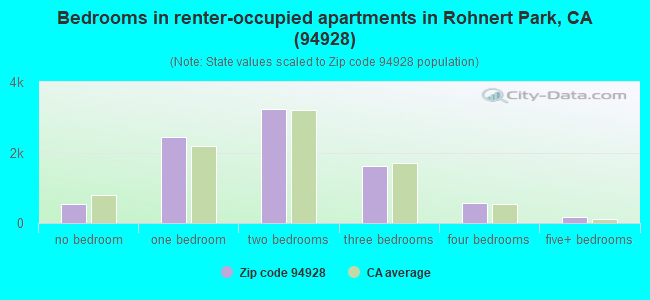
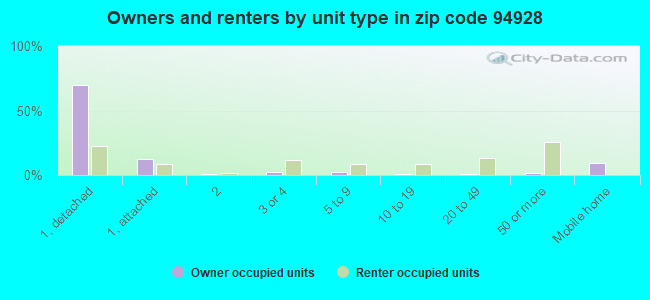
Houses and condos: 17,872 Renter-occupied apartments: 8,557
% of renters here:
49%
State:
44%
March 2022 cost of living index in zip code 94928: 114.9 (more than average, U.S. average is 100)
Land area: 7.7 sq. mi. Water area: 0.0 sq. mi.
Population density: 5,951 people per square mile
(average).
OSM Map
General Map
Google Map
MSN Map
OSM Map
General Map
Google Map
MSN Map
OSM Map
General Map
Google Map
MSN Map
OSM Map
General Map
Google Map
MSN Map
Please wait while loading the map...
Real estate property taxes paid for housing units in 2022:
This zip code:
0.7% ($4,642)
California:
0.7% ($4,831)
Median real estate property taxes paid for housing units with mortgages in 2022: $4,930 (0.7%) Median real estate property taxes paid for housing units with no mortgage in 2022: $3,676 (0.6%)
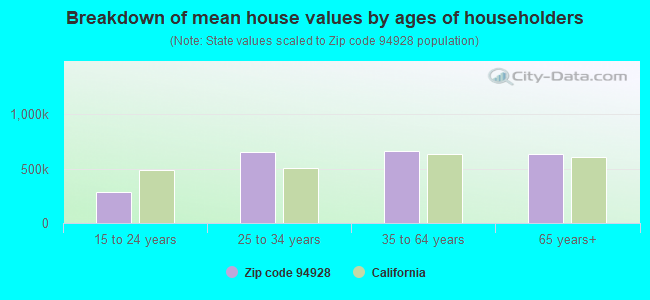
Estimated median house/condo value in 2022: $673,226
94928:
$673,226
California:
$715,900
According to our research of California and other state lists, there were 38 registered sex offenders living in 94928 zip code as of April 27, 2024. The ratio of all residents to sex offenders in zip code 94928 is 1,158 to 1. The ratio of registered sex offenders to all residents in this zip code is lower than the state average.
Median resident age:
This zip code:
34.5 years
California median age:
37.9 years
Average household size:
This zip code:
2.5 people
California:
2.8 people
Averages for the 2020 tax year for zip code 94928, filed in 2021:
Average Adjusted Gross Income (AGI) in 2020: $70,670 (Individual Income Tax Returns)
Here:
$70,670
State:
$95,910
Salary/wage: $62,859 (reported on 83.6% of returns)
Here:
$62,859
State:
$77,331
(% of AGI for various income ranges: 1288.0% for AGIs below $25k, 4131.7% for AGIs $25k-50k, 7373.4% for AGIs $50k-75k, 10867.7% for AGIs $75k-100k, 20671.9% for AGIs $100k-200k, 70799.4% for AGIs over 200k)
Taxable interest for individuals: $925 (reported on 36.1% of returns)
This zip code:
$925
California:
$2,294
(% of AGI for various income ranges: 19.5% for AGIs below $25k, 20.2% for AGIs $25k-50k, 39.7% for AGIs $50k-75k, 57.7% for AGIs $75k-100k, 124.0% for AGIs $100k-200k, 551.9% for AGIs over 200k)
Ordinary dividends: $3,538 (reported on 17.6% of returns)
Here:
$3,538
State:
$10,949
(% of AGI for various income ranges: 30.7% for AGIs below $25k, 38.3% for AGIs $25k-50k, 78.0% for AGIs $50k-75k, 114.5% for AGIs $75k-100k, 238.3% for AGIs $100k-200k, 976.1% for AGIs over 200k)
Net capital gain/loss in AGI: +$13,631 (reported on 16.5% of returns)
Here:
+$13,631
State:
+$49,306
(% of AGI for various income ranges: 7.1% for AGIs below $25k, 32.1% for AGIs $25k-50k, 89.1% for AGIs $50k-75k, 145.0% for AGIs $75k-100k, 441.3% for AGIs $100k-200k, 11597.4% for AGIs over 200k)
Profit/loss from business: +$15,704 (reported on 14.8% of returns)
Here:
+$15,704
State:
+$15,671
(% of AGI for various income ranges: 141.6% for AGIs below $25k, 195.3% for AGIs $25k-50k, 305.9% for AGIs $50k-75k, 375.7% for AGIs $75k-100k, 731.2% for AGIs $100k-200k, 3863.2% for AGIs over 200k)
Taxable individual retirement arrangement distribution: $17,999 (reported on 7.2% of returns)
94928:
$17,999
California:
$23,505
(% of AGI for various income ranges: 62.1% for AGIs below $25k, 79.6% for AGIs $25k-50k, 135.3% for AGIs $50k-75k, 299.1% for AGIs $75k-100k, 542.5% for AGIs $100k-200k, 1630.6% for AGIs over 200k)
Self-employed (Keogh) retirement plans: $16,636 (reported on 0.5% of returns)
94928:
$16,636
California:
$30,163
(% of AGI for various income ranges: 15.5% for AGIs $50k-75k, 26.4% for AGIs $100k-200k, 294.2% for AGIs over 200k)
Total itemized deductions: $29,972 (reported on 13.9% of returns)
Here:
$29,972
State:
$39,517
(% of AGI for various income ranges: 93.5% for AGIs below $25k, 168.1% for AGIs $25k-50k, 448.8% for AGIs $50k-75k, 890.7% for AGIs $75k-100k, 1957.0% for AGIs $100k-200k, 6662.9% for AGIs over 200k)
Charity contributions: $3,611 (reported on 9.8% of returns)
Here:
$3,611
State:
$12,598
(% of AGI for various income ranges: 3.3% for AGIs below $25k, 11.0% for AGIs $25k-50k, 22.3% for AGIs $50k-75k, 57.9% for AGIs $75k-100k, 178.7% for AGIs $100k-200k, 801.9% for AGIs over 200k)
Taxes paid: $8,555 (reported on 13.9% of returns)
94928:
$8,555
State:
$8,807
(% of AGI for various income ranges: 18.4% for AGIs below $25k, 34.9% for AGIs $25k-50k, 124.4% for AGIs $50k-75k, 292.0% for AGIs $75k-100k, 607.0% for AGIs $100k-200k, 1674.5% for AGIs over 200k)
Earned income credit: $1,717 (reported on 9.0% of returns)
Here:
$1,717
State:
$2,074
(% of AGI for various income ranges: 55.1% for AGIs below $25k, 37.6% for AGIs $25k-50k, 0.7% for AGIs $50k-75k)
Percentage of individuals using paid preparers for their 2020 taxes: 92.0%
Here:
92%
State:
92%
(% for various income ranges: 90.3% for AGIs below $25k, 91.7% for AGIs $25k-50k, 93.1% for AGIs $50k-75k, 92.7% for AGIs $75k-100k, 93.0% for AGIs $100k-200k, 94.2% for AGIs over 200k)
Averages for the 2012 tax year for zip code 94928, filed in 2013:
Average Adjusted Gross Income (AGI) in 2012: $51,937 (Individual Income Tax Returns)
Here:
$51,937
State:
$72,726
Salary/wage: $46,525 (reported on 84.4% of returns)
Here:
$46,525
State:
$59,079
(% of AGI for various income ranges: 74.8% for AGIs below $25k, 80.6% for AGIs $25k-50k, 77.7% for AGIs $50k-75k, 77.9% for AGIs $75k-100k, 80.3% for AGIs $100k-200k, 45.1% for AGIs over 200k)
Taxable interest for individuals: $814 (reported on 35.1% of returns)
This zip code:
$814
California:
$2,146
(% of AGI for various income ranges: 1.0% for AGIs below $25k, 0.6% for AGIs $25k-50k, 0.6% for AGIs $50k-75k, 0.5% for AGIs $75k-100k, 0.5% for AGIs $100k-200k, 0.3% for AGIs over 200k)
Ordinary dividends: $2,820 (reported on 16.8% of returns)
Here:
$2,820
State:
$9,308
(% of AGI for various income ranges: 1.4% for AGIs below $25k, 0.8% for AGIs $25k-50k, 0.9% for AGIs $50k-75k, 0.7% for AGIs $75k-100k, 0.9% for AGIs $100k-200k, 1.0% for AGIs over 200k)
Net capital gain/loss in AGI: +$3,096 (reported on 13.2% of returns)
Here:
+$3,096
State:
+$30,460
(% of AGI for various income ranges: 0.3% for AGIs $50k-75k, 0.3% for AGIs $75k-100k, 1.1% for AGIs $100k-200k, 4.0% for AGIs over 200k)
Profit/loss from business: +$14,337 (reported on 13.7% of returns)
Here:
+$14,337
State:
+$17,064
(% of AGI for various income ranges: 7.5% for AGIs below $25k, 4.0% for AGIs $25k-50k, 4.0% for AGIs $50k-75k, 3.2% for AGIs $75k-100k, 2.9% for AGIs $100k-200k, 3.3% for AGIs over 200k)
Taxable individual retirement arrangement distribution: $13,131 (reported on 8.3% of returns)
94928:
$13,131
California:
$19,557
(% of AGI for various income ranges: 2.6% for AGIs below $25k, 2.0% for AGIs $25k-50k, 2.2% for AGIs $50k-75k, 2.5% for AGIs $75k-100k, 2.1% for AGIs $100k-200k, 0.9% for AGIs over 200k)
Self-employment retirement plans: $11,300 (reported on 0.4% of returns)
94928:
$11,300
California:
$24,530
Total itemized deductions: $22,990 (25% of AGI, reported on 33.2% of returns)
Here:
$22,990
State:
$34,004
Here:
24.6% of AGI
State:
22.7% of AGI
(% of AGI for various income ranges: 9.7% for AGIs below $25k, 9.6% for AGIs $25k-50k, 14.8% for AGIs $50k-75k, 16.7% for AGIs $75k-100k, 18.1% for AGIs $100k-200k, 14.9% for AGIs over 200k)
Charity contributions: $1,990 (reported on 26.4% of returns)
Here:
$1,990
State:
$4,659
(% of AGI for various income ranges: 0.4% for AGIs below $25k, 0.6% for AGIs $25k-50k, 1.0% for AGIs $50k-75k, 1.3% for AGIs $75k-100k, 1.3% for AGIs $100k-200k, 0.9% for AGIs over 200k)
Taxes paid: $7,524 (reported on 33.0% of returns)
94928:
$7,524
State:
$14,448
(% of AGI for various income ranges: 1.7% for AGIs below $25k, 2.2% for AGIs $25k-50k, 3.9% for AGIs $50k-75k, 5.2% for AGIs $75k-100k, 7.1% for AGIs $100k-200k, 6.3% for AGIs over 200k)
Earned income credit: $1,826 (reported on 12.8% of returns)
Here:
$1,826
State:
$2,286
(% of AGI for various income ranges: 3.6% for AGIs below $25k, 0.7% for AGIs $25k-50k)
Percentage of individuals using paid preparers for their 2012 taxes: 49.8%
Here:
50%
State:
64%
(% for various income ranges: 44.0% for AGIs below $25k, 48.5% for AGIs $25k-50k, 53.8% for AGIs $50k-75k, 56.0% for AGIs $75k-100k, 58.4% for AGIs $100k-200k, 73.9% for AGIs over 200k)
Averages for the 2004 tax year for zip code 94928, filed in 2005:
Average Adjusted Gross Income (AGI) in 2004: $45,626 (Individual Income Tax Returns)
Here:
$45,626
State:
$58,600
Salary/wage: $43,360 (reported on 86.6% of returns)
Here:
$43,360
State:
$49,455
(% of AGI for various income ranges: 111.3% for AGIs below $10k, 77.5% for AGIs $10k-25k, 83.7% for AGIs $25k-50k, 83.4% for AGIs $50k-75k, 86.6% for AGIs $75k-100k, 77.6% for AGIs over 100k)
Taxable interest for individuals: $1,076 (reported on 45.9% of returns)
This zip code:
$1,076
California:
$2,365
(% of AGI for various income ranges: 4.8% for AGIs below $10k, 2.0% for AGIs $10k-25k, 1.2% for AGIs $25k-50k, 0.9% for AGIs $50k-75k, 0.8% for AGIs $75k-100k, 0.9% for AGIs over 100k)
Taxable dividends: $1,644 (reported on 21.8% of returns)
Here:
$1,644
State:
$4,746
(% of AGI for various income ranges: 3.9% for AGIs below $10k, 1.7% for AGIs $10k-25k, 0.8% for AGIs $25k-50k, 0.7% for AGIs $50k-75k, 0.4% for AGIs $75k-100k, 0.7% for AGIs over 100k)
Net capital gain/loss: +$5,367 (reported on 17.9% of returns)
Here:
+$5,367
State:
+$23,418
(% of AGI for various income ranges: -1.6% for AGIs below $10k, 0.4% for AGIs $10k-25k, 0.3% for AGIs $25k-50k, 0.5% for AGIs $50k-75k, 0.8% for AGIs $75k-100k, 6.1% for AGIs over 100k)
Profit/loss from business: +$15,087 (reported on 14.2% of returns)
Here:
+$15,087
State:
+$16,826
(% of AGI for various income ranges: 2.9% for AGIs below $10k, 5.9% for AGIs $10k-25k, 4.5% for AGIs $25k-50k, 3.9% for AGIs $50k-75k, 4.1% for AGIs $75k-100k, 5.6% for AGIs over 100k)
Profit/loss from farming: +$1,786 (reported on 0.1% of returns)
Here:
+$1,786
State:
-$7,562
IRA payment deduction: $2,811 (reported on 2.8% of returns)
94928:
$2,811
California:
$3,192
(% of AGI for various income ranges: 0.2% for AGIs below $10k, 0.3% for AGIs $10k-25k, 0.2% for AGIs $25k-50k, 0.2% for AGIs $50k-75k, 0.2% for AGIs $75k-100k, 0.1% for AGIs over 100k)
Self-employed pension: $10,532 (reported on 0.9% of returns)
Here:
$10,532
California:
$17,688
(% of AGI for various income ranges: 0.1% for AGIs $10k-25k, 0.1% for AGIs $25k-50k, 0.1% for AGIs $50k-75k, 0.1% for AGIs $75k-100k, 0.4% for AGIs over 100k)
Total itemized deductions: $21,310 (28% of AGI, reported on 40.1% of returns)
Here:
$21,310
State:
$28,113
Here:
28.5% of AGI
State:
25.3% of AGI
(% of AGI for various income ranges: 21.9% for AGIs below $10k, 12.3% for AGIs $10k-25k, 15.3% for AGIs $25k-50k, 20.7% for AGIs $50k-75k, 21.8% for AGIs $75k-100k, 19.4% for AGIs over 100k)
Charity contributions deductions: $1,864 (2% of AGI, reported on 34.5% of returns)
Here:
$1,864
State:
$3,923
Here:
2.4% of AGI
State:
3.3% of AGI
(% of AGI for various income ranges: 0.6% for AGIs below $10k, 0.7% for AGIs $10k-25k, 1.0% for AGIs $25k-50k, 1.6% for AGIs $50k-75k, 1.7% for AGIs $75k-100k, 1.6% for AGIs over 100k)
Total tax: $5,664 (reported on 81.0% of returns)
94928:
$5,664
State:
$10,761
(% of AGI for various income ranges: 3.7% for AGIs below $10k, 5.0% for AGIs $10k-25k, 7.6% for AGIs $25k-50k, 9.0% for AGIs $50k-75k, 9.7% for AGIs $75k-100k, 14.6% for AGIs over 100k)
Earned income credit: $1,372 (reported on 8.6% of returns)
Here:
$1,372
State:
$1,763
Percentage of individuals using paid preparers for their 2004 taxes: 53.2%
Here:
53%
State:
66%
(% for various income ranges: 40.0% for AGIs below $10k, 50.9% for AGIs $10k-25k, 54.6% for AGIs $25k-50k, 59.0% for AGIs $50k-75k, 60.5% for AGIs $75k-100k, 61.6% for AGIs over 100k)
Likely homosexual households (counted as self-reported same-sex unmarried-partner households)
Lesbian couples: 0.3% of all households
Gay men: 0.3% of all households
Household received Food Stamps/SNAP in the past 12 months: 1,517 Household did not receive Food Stamps/SNAP in the past 12 months: 15,637
Women who had a birth in the past 12 months: 459 (276 now married, 184 unmarried) Women who did not have a birth in the past 12 months: 12,064 (3,665 now married, 8,446 unmarried)
Housing units in zip code 94928 with a mortgage: 5,915 (538 second mortgage, 7 home equity loan, 425 both second mortgage and home equity loan) Houses without a mortgage: 57
Median monthly owner costs for units with a mortgage: $2,561 Median monthly owner costs for units without a mortgage: $848
Residents with income below the poverty level in 2022:
This zip code:
10.0%
Whole state:
12.2%
Residents with income below 50% of the poverty level in 2022:
This zip code:
3.6%
Whole state:
6.2%
Median number of rooms in houses and condos:
Here:
5.8
State:
6.0
Median number of rooms in apartments:
Here:
3.8
State:
3.9
Notable locations in this zip code not listed on our city pages
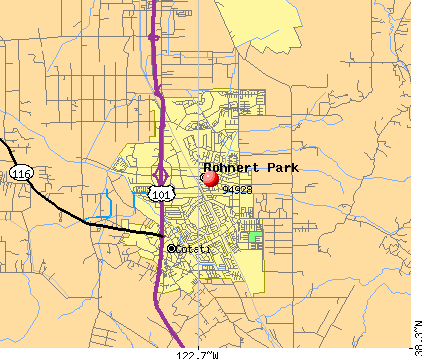
Notable locations in zip code 94928: Rohnert Park Sewage Treatment Plant (A), Mountain Shadows Golf Course (B), Stevenson Hall (C), Ruben Salazar Library (D), Rohnert Park-Cotati Branch Sonoma County Library (E), Rohnert Park City Hall (F), Sonoma Life Support Post 17 (G), Rohnert Park Department of Public Safety Fire Division Station 3 (H), Rohnert Park Department of Public Safety Fire Division Station 2 (I), Rohnert Park Department of Public Safety Fire Division Station 4 (J), Rohnert Park Department of Public Safety Fire Division Station 1 Headquarters (K). Display/hide their locations on the map
Shopping Centers: Raleys Towne Centre Shopping Center (1), Park Plaza Shopping Center (2), Padre Town Center Shopping Center (3), Northbay Centre Shopping Center (4). Display/hide their locations on the map
Churches in zip code 94928 include: Faith Presbyterian Church (A), First Baptist Church of Rohnert Park (B), Rohnert Park Assembly of God Church (C). Display/hide their locations on the map
Parks in zip code 94928 include: Alicia Park (1), Benicia Park (2), Caterpillar Park (3), Colegio Vista Park (4), Dorotea Park (5), Eagle Park (6), Hinebaugh Park (7), Lady Bug Park (8), Meadow Pines Park (9). Display/hide their locations on the map
4,967 married couples with children.
2,833 single-parent households (709 men, 2,124 women).
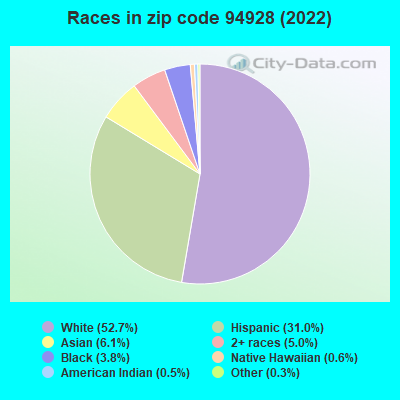
74.0% of residents of 94928 zip code speak English at home.
17.9% of residents speak Spanish at home (69% very well, 13% well, 14% not well, 4% not at all).
2.6% of residents speak other Indo-European language at home (84% very well, 10% well, 6% not well).
4.3% of residents speak Asian or Pacific Island language at home (69% very well, 25% well, 5% not well, 2% not at all).
0.6% of residents speak other language at home (73% very well, 27% well).
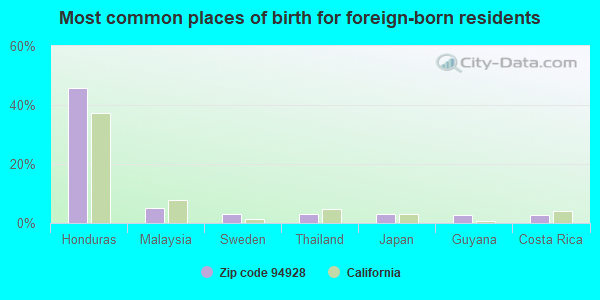
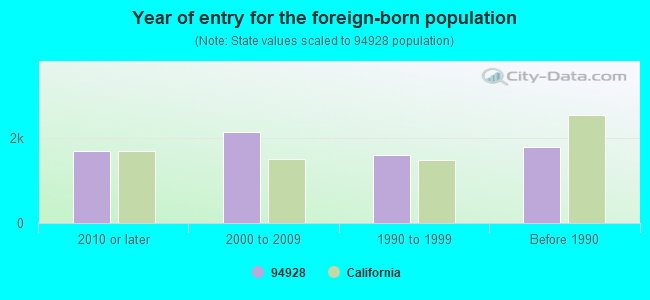
Foreign born population: 6,640 (14.5%) (45.6% of them are naturalized citizens)
This zip code:
14.5%
Whole state:
26.7%
46%Honduras
5%Malaysia
3%Sweden
3%Thailand
3%Japan
3%Guyana
3%Costa Rica
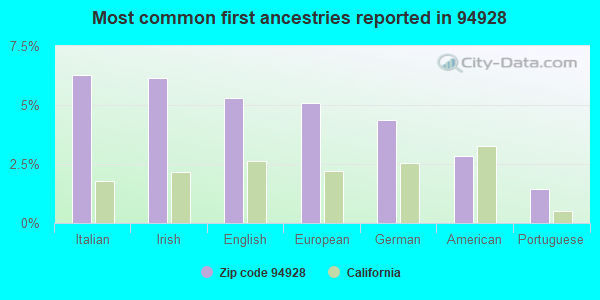
6%Italian
6%Irish
5%English
5%European
4%German
3%American
1%Portuguese
Year of entry for the foreign-born population
1,6772010 or later
2,1282000 to 2009
1,5901990 to 1999
1,791Before 1990
Major facilities with environmental interests located in this zip code:
LINENS N THINGS (4601 REDWOOD DRIVE in ROHNERT PARK, CA)
ENFORCEMENT/COMPLIANCE ACTIVITY (Integrated Compliance Information System) - ICIS-05-2004-0050, FORMAL ENFORCEMENT ACTION (Integrated Compliance Information System) - ICIS-05-2004-0050, FORMAL ENFORCEMENT ACTION (Integrated Compliance Information System) - ICIS-05-2004-0071, FORMAL ENFORCEMENT ACTION COMPLIANCE ACTIVITY (Tracking inspections of insecticide, fungicide, and rodenticide, and toxic substances) Business SIC classification: MISCELLANEOUS HOMEFURNISHINGS STORES Alternative names: LINEN N THINGS, LINENS 'THINGS INC
HERTZ EQUIPMENT RENTAL CORPORATION (5500 COMMERCE BOULEVARD in ROHNERT PARK, CA)
STATE MASTER (California - Hazardous Waste Tracking) - HAZARDOU WASTE PROGRAM CRITERIA AND HAZARDOUS AIR POLLUTANT INVENTORY (Inventory of air pollution sources) HAZARDOUS WASTE BIENNIAL REPORTER (Resource Conservation and Recovery Act (tracking hazardous waste)) Large Quantity Generators, more that 1000 kg of hazardous waste/month (Resource Conservation and Recovery Act (tracking hazardous waste)) Business SIC and NAICS classification: EQUIPMENT RENTAL AND LEASING Organizations: RENTAL CENTER PROPERTIES (CONTACT/OWNER)
Alternative names: BIG 4 RENTS, BIG 4 RENTS ROHNERT PARK
HEWLETT PACKARD COMPANY (1212 VALLEY HOUSE DRIVE in ROHNERT PARK, CA)
STATE MASTER (California - Hazardous Waste Tracking) - HAZARDOU WASTE PROGRAM CRITERIA AND HAZARDOUS AIR POLLUTANT INVENTORY (Inventory of air pollution sources) (Resource Conservation and Recovery Act (tracking hazardous waste)) TRI REPORTER (Tracking of toxic chemicals releasing facilities) Business SIC classification: INSTRUMENTS FOR MEASURING AND TESTING OF ELECTRICITY AND ELECTRICAL SIGNALS Business NAICS classification: INSTRUMENT MANUFACTURING FOR MEASURING AND TESTING ELECTRICITY AND ELECTRICAL SIGNALS. Organizations: AGILENT TECHNOLOGIES INC (CONTACT/OWNER)
Alternative names: AGILENT TECHNOLOGIES
O'DELL PRINTING (5460 STATE FARM DR in ROHNERT PARK, CA)
STATE MASTER (California - Hazardous Waste Tracking) - HAZARDOU WASTE PROGRAM CRITERIA AND HAZARDOUS AIR POLLUTANT INVENTORY (Inventory of air pollution sources) Small Quantity Generators, between 100 kg and 1000 kg of hazardous waste/month (Resource Conservation and Recovery Act (tracking hazardous waste)) - notification Business SIC classification: COMMERCIAL PRINTING, LITHOGRAPHIC Business NAICS classification: COMMERCIAL LITHOGRAPHIC PRINTING. Organizations: ODELL BILL (CONTACT/OWNER)
EMPIRE EQUIPMENT CO LP (5380 COMMERCE BLVD in ROHNERT PARK, CA)
STATE MASTER (California - Hazardous Waste Tracking) - HAZARDOU WASTE PROGRAM Small Quantity Generators, between 100 kg and 1000 kg of hazardous waste/month (Resource Conservation and Recovery Act (tracking hazardous waste)) - notification Alternative names: EMPIRE EQUIPMENT LP DBA NORTRAX
MIO TRUCKING (1153 HAILEY CT in ROHNERT PARK, CA)
STATE MASTER (California - Hazardous Waste Tracking) - HAZARDOU WASTE PROGRAM TRANSPORTER (Resource Conservation and Recovery Act (tracking hazardous waste)) Organizations: LEE NELSON (CONTACT/OPERATOR)
ACUR IT HONDA TECH (5677 REDWOOD DR UNIT B in ROHNERT PARK, CA)
Small Quantity Generators, between 100 kg and 1000 kg of hazardous waste/month (Resource Conservation and Recovery Act (tracking hazardous waste)) - notification STATE MASTER (California - Used Oil Recycling System ) - USED OIL RECYCLING Organizations: JON VINING (CONTACT/OWNER)
CHEVRON STATION NO 91912 (302 ROHNERT PARK EXPY W in ROHNERT PARK, CA)
STATE MASTER (California - Hazardous Waste Tracking) - HAZARDOU WASTE PROGRAM Small Quantity Generators, between 100 kg and 1000 kg of hazardous waste/month (Resource Conservation and Recovery Act (tracking hazardous waste)) - notification Organizations: CHEVRON PRODUCTS CO (CONTACT/OWNER)
NOR CAL TRANSMISSION (71 UTILITY CT UNIT B in ROHNERT PARK, CA)
STATE MASTER (California - Hazardous Waste Tracking) - HAZARDOU WASTE PROGRAM Small Quantity Generators, between 100 kg and 1000 kg of hazardous waste/month (Resource Conservation and Recovery Act (tracking hazardous waste)) - notification Organizations: DEL CURTO PROPERTIES (CONTACT/OWNER)
CHEVRON STATION NO 98893 (4990 COMMERCE BLVD in ROHNERT PARK, CA)
STATE MASTER (California - Hazardous Waste Tracking) - HAZARDOU WASTE PROGRAM Small Quantity Generators, between 100 kg and 1000 kg of hazardous waste/month (Resource Conservation and Recovery Act (tracking hazardous waste)) - notification Organizations: CHEVRON PRODUCTS CO (CONTACT/OWNER)
LA FIESTA ELEMENTARY (8511 LIMAN WAY in ROHNERT PARK, CA)
(National Center for Education Statistics) - STATE ID-6094841 Organizations: COTATI-ROHNERT PARK UNIFIED (SCHOOL DISTRICT)
ACE CLEANERS (6404 COMMERCE BOULEVARD in ROHNERT PARK, CA)
CRITERIA AND HAZARDOUS AIR POLLUTANT INVENTORY (Inventory of air pollution sources) Small Quantity Generators, between 100 kg and 1000 kg of hazardous waste/month (Resource Conservation and Recovery Act (tracking hazardous waste)) - notification Small Quantity Generators, between 100 kg and 1000 kg of hazardous waste/month (Resource Conservation and Recovery Act (tracking hazardous waste)) Business SIC classification: DRYCLEANING PLANTS, EXCEPT RUG CLEANING Organizations: ROSSI CATHY (CONTACT/OWNER)
, BU LIM YOO (CONTACT/OWNER)
Alternative names: PLAZA CLEANERS
EL CAMINO HIGH (CONT.) (5860 LABATH AVE. in ROHNERT PARK, CA)
(National Center for Education Statistics) - STATE ID-4930046 Organizations: COTATI-ROHNERT PARK UNIFIED (SCHOOL DISTRICT)
Housing units lacking complete plumbing facilities: 0.3% Housing units lacking complete kitchen facilities: 0.4%
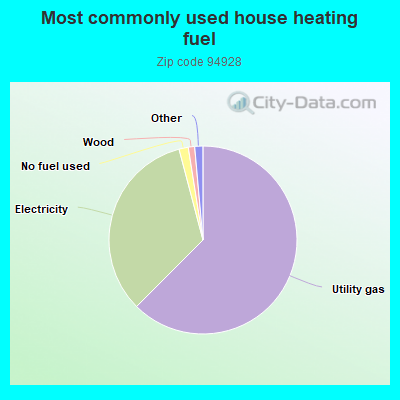
62.5%Utility gas
33.4%Electricity
1.6%No fuel used
1.1%Wood
0.6%Bottled, tank, or LP gas
0.6%Solar energy
Population in 1990: 35,730. Population change in the 1990s: +6,812 (+19.1%).
Place of birth for U.S.-born residents:
This state: 30,379
Northeast: 2,594
Midwest: 1,612
South: 2,330
West: 1,725
47% of the 94928 zip code residents lived in the same house 5 years ago. Out of people who lived in different houses, 57% lived in this county. Out of people who lived in different counties, 50% lived in California.
86% of the 94928 zip code residents lived in the same house 1 year ago. Out of people who lived in different houses, 64% moved from this county. Out of people who lived in different houses, 27% moved from different county within same state. Out of people who lived in different houses, 3% moved from different state. Out of people who lived in different houses, 3% moved from abroad.
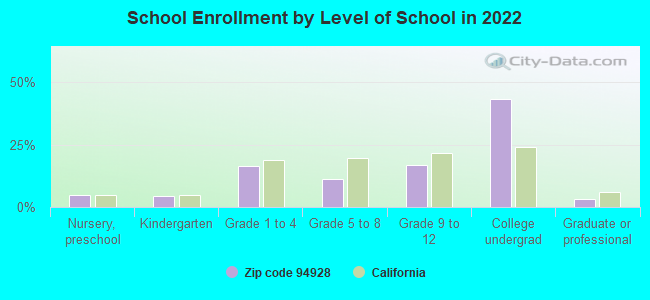
Private vs. public school enrollment:
Students in private schools in grades 1 to 8 (elementary and middle school): 80
Here:
2.3%
California:
10.5%
Students in private schools in grades 9 to 12 (high school): 48
Here:
2.2%
California:
8.5%
Students in private undergraduate colleges: 753
Here:
13.3%
California:
15.9%
Occupation by median earnings in the past 12 months ($)
110,557Health diagnosing and treating practitioners and other technical occupations
108,271Law enforcement workers including supervisors
103,233Computer and mathematical occupations
93,081Architecture and engineering occupations
85,381Management occupations
78,612Business and financial operations occupations
Companies with federal contracts located in this zip code (ROHNERT PARK, CA):
NORTH BAY REHABILITATION SERVI (649 MARTIN AVE) : $18,112,103 in 147 contractsfrom 1999 to 2006
Contracts for Miscellaneous Items, Food Services, Landscaping/Groundskeeping Services, Outerwear, Women's, and moreby United States Coast Guard (disused code: now 7008), Navy, Army, Defense Logistics Agency, and others Signed by year:2000: $1,761,468; 2001: $5,046,196; 2002: $1,819,008; 2003: $3,189,331; 2004: $2,207,164; 2005: $1,043,025; 2006: $530,572.
Biggest contracts:
$1,014,000 with United States Coast Guard (disused code: now 7008) for Miscellaneous Items. Signed on 2001-09-15. Completion date: 2002-09-15.
$877,000 with United States Coast Guard (disused code: now 7008) for Food Services. Signed on 1999-12-15. Completion date: 2000-09-15.
$825,000 with United States Coast Guard (disused code: now 7008) for Miscellaneous Items. Signed on 2001-12-15. Completion date: 2002-09-15.
$741,064 with Navy for Landscaping/Groundskeeping Services. Signed on 2002-04-03. Completion date: 2002-03-31.
QUARTERWAVE CORP (5780 LABATH AVE; small business) : $434,025 in 8 contractsfrom 2000 to 2004
Contracts for Miscellaneous Communication Equipment, Electrical and Electronic Properties Measuring and Testing Instruments, Radar Equipment, Except Airborne, Electric Power Generation (EPG), and moreby Navy, Air Force Signed by year:2000: $40,200; 2001: $0; 2002: $279,950; 2003: $56,500; 2004: $57,375; 2005: $0; 2006: $0.
Biggest contracts:
$113,000 with Navy for Miscellaneous Communication Equipment. Signed on 2002-08-21. Completion date: 2002-11-20.
$100,300 with Air Force for Electrical and Electronic Properties Measuring and Testing Instruments. Signed on 2002-08-20. Completion date: 2003-01-23.
$57,375 with Navy for Radar Equipment, Except Airborne. Signed on 2004-09-13. Completion date: 2005-02-15.
$56,500 with Navy for Electric Power Generation (EPG). Signed on 2003-12-03. Completion date: 2004-01-07.
NUGENERATION TECHNOLOGIES, LLC (100 PROFESSIONAL CENTER DR; small business) : $371,250 in 2 contractsfrom 2005 to 2006
$185,625 with Army for Miscellaneous Chemical Specialties. Signed on 2006-01-19. Completion date: 2007-02-01.
$185,625, same as above.Signed on 2005-02-02. Completion date: 2006-02-01.
SPS MARKETING INC (4697 FAIRWAY DR; small business) : $200,263 in 4 contractsin 2005
$127,750 with Defense Logistics Agency for Oils and Greases: Cutting, Lubricating, and Hydraulic. Signed on 2005-08-26. Completion date: 2005-09-25.
$53,491, same as above.Signed on 2005-06-24. Completion date: 2005-07-24.
$14,877, same as above.Signed on 2005-07-12. Completion date: 2005-07-27.
$4,145 with Army for Oils and Greases: Cutting, Lubricating, and Hydraulic. Taking place in TX. Signed on 2005-01-06. Completion date: 2005-01-13.
FOD TECHNOLOGY GROUP INC (230 PARQUE MARGARITA; small business) 50 employees, $0 revenue. : $111,396 in 5 contractsfrom 2000 to 2005
Contracts for Combination and Miscellaneous Instruments, ADP Support Equipment, Aircraft Maintenance and Repair Shop Specialized Equipment, Miscellaneous Alarm, Signal and Security Detection Systems by Defense Logistics Agency, Air Force, Army Signed by year:2000: $35,349; 2001: $35,655; 2002: $0; 2003: $11,490; 2004: $13,020; 2005: $15,882; 2006: $0.
Biggest contracts:
$35,655 with Defense Logistics Agency for Combination and Miscellaneous Instruments. Signed on 2001-06-20. Completion date: 2001-10-18.
$35,349, same as above.Signed on 2000-06-01. Completion date: 2000-09-25.
$15,882 with Air Force for ADP Support Equipment. Taking place in AZ. Signed on 2005-02-07. Completion date: 2005-02-08.
$13,020 with Air Force for Aircraft Maintenance and Repair Shop Specialized Equipment. Signed on 2004-09-09. Completion date: 2004-12-17.
SONOMA STATE UNIVERITY AC FOUN (1801 E COTATI AVE) : $34,420 in 4 contractsfrom 2001 to 2006
$21,000 with National Park Service for Archeological/Paleontological Studies. Signed on 2001-09-15. Completion date: 2002-09-15.
$5,908 with Air Force for Tuition, Registration, and Membership Fees. Signed on 2005-03-05. Completion date: 2005-09-30.
$4,204, same as above.Signed on 2005-06-02. Completion date: 2005-09-30.
$3,308, same as above.Signed on 2006-06-29. Completion date: 2005-10-19.
IPM-BIOCARE, INC (75 EXECUTIVE AVENUE; small business)
$25,850 with Air Force for Textile Fabrics. Signed on 2002-09-28. Completion date: 2002-11-01.
Top industries in this zip code by the number of employees in 2005:
2005 - 2018 National Fire Incident Reporting System (NFIRS) incidents
Based on the data from the years 2005 - 2018 the average number of fires per year is 33. The highest number of fires - 71 took place in 2006, and the least - 13 in 2012. The data has a growing trend.
When looking into fire subcategories, the most reports belonged to: Structure Fires (70.9%), and Outside Fires (21.5%).
Fire incident types reported to NFIRS in Zip Code 94928


+$1,786
-$7,562
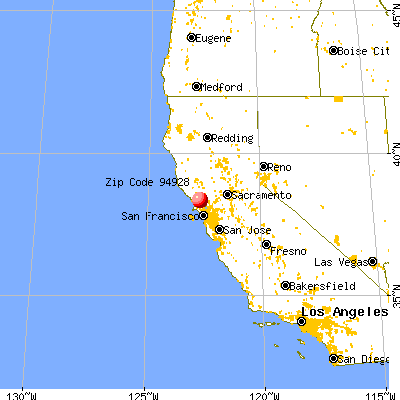
 Nearest zip codes: 94931, 94951, 95407, 95405, 94952, 95401.


 Based on the data from the years 2005 - 2018 the average number of fires per year is 33. The highest number of fires - 71 took place in 2006, and the least - 13 in 2012. The data has a growing trend.
 When looking into fire subcategories, the most reports belonged to: Structure Fires (70.9%), and Outside Fires (21.5%).