Races in Cerulean Springs, Kentucky (KY) Detailed Stats
Ancestries, Foreign-born residents, place of birth
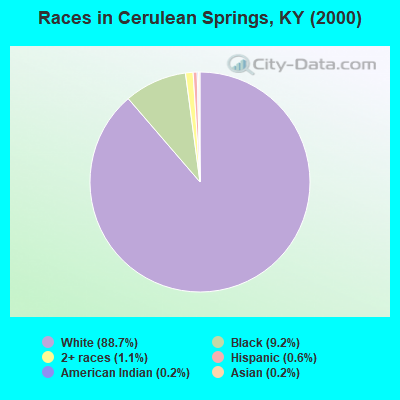
Race distribution in Cerulean Springs

- 2,31288.7%White alone
- 2399.2%Black alone
- 281.1%Two or more races
- 160.6%Hispanic
- 50.2%Asian alone
- 60.2%American Indian alone
- 20.08%Other race alone
2000
2022
-
- 3,608,01389.3%White alone
- 293,6397.3%Black alone
- 59,9391.5%Hispanic
- 37,7500.9%Two or more races
- 29,3680.7%Asian alone
- 7,9390.2%American Indian alone
- 3,8460.10%Other race alone
- 1,2750.03%Native Hawaiian and Other
Pacific Islander alone

-
- 3,710,99882.2%White alone
- 343,1947.6%Black alone
- 187,4834.2%Hispanic
- 187,3944.2%Two or more races
- 62,2401.4%Asian alone
- 13,5290.3%Other race alone
- 4,3020.10%American Indian alone
- 3,1700.07%Native Hawaiian and Other
Pacific Islander alone

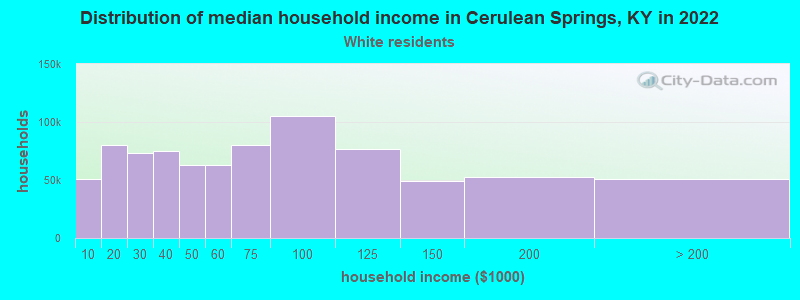
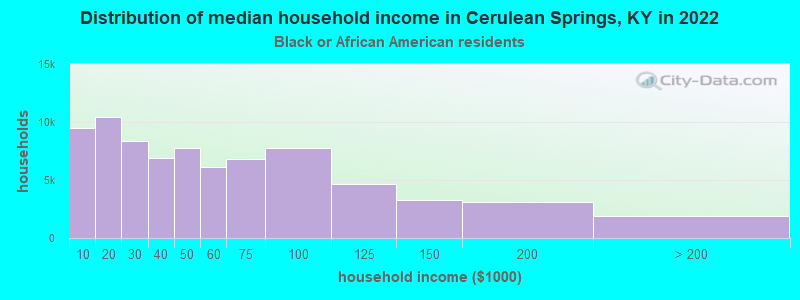
Income and house value in Cerulean Springs
- Median household income in 2022
- $66,404White non-Hispanic householders
- $49,555Black householders
- Median 2022 house value
- $240,198White Non-Hispanic householders
- $103,058Black or African American householders
Household income for White non-Hispanic householders
Household income for Black householders
Zip code: 42211