Races in Cloverland, Wisconsin (WI) Detailed Stats
Ancestries, Foreign-born residents, place of birth

Discuss Cloverland, Wisconsin races on our local forum with over 2,400,000 registered users
1.1% of Cloverland, WI residents are foreign-born , which is 359.5% less than the foreign-born rate of 5.0% across the entire state of Wisconsin.
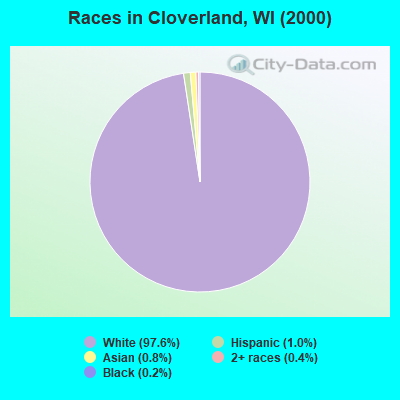
Race distribution in Cloverland

- 89797.6%White alone
- 91.0%Hispanic
- 70.8%Asian alone
- 40.4%Two or more races
- 20.2%Black alone
2000
2022
-
- 4,681,63087.3%White alone
- 300,2455.6%Black alone
- 192,9213.6%Hispanic
- 87,9951.6%Asian alone
- 51,9211.0%Two or more races
- 43,9800.8%American Indian alone
- 3,6370.07%Other race alone
- 1,3460.03%Native Hawaiian and Other
Pacific Islander alone

-
- 4,654,03179.0%White alone
- 447,0227.6%Hispanic
- 345,6785.9%Black alone
- 217,5323.7%Two or more races
- 172,2422.9%Asian alone
- 33,7620.6%American Indian alone
- 19,6800.3%Other race alone
- 2,5920.04%Native Hawaiian and Other
Pacific Islander alone

Income and house value in Cloverland
- Median household income in 2022
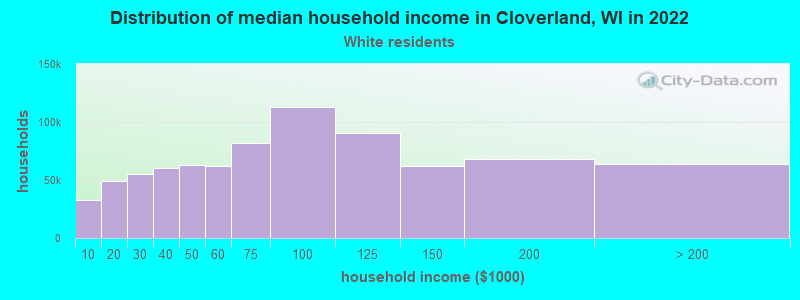
- $58,228White non-Hispanic householders
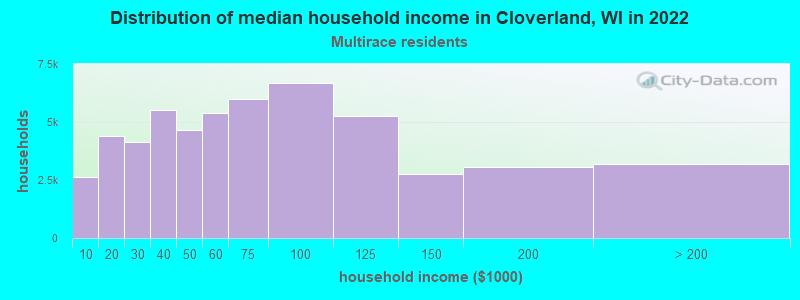
- $49,998Two or more races householders
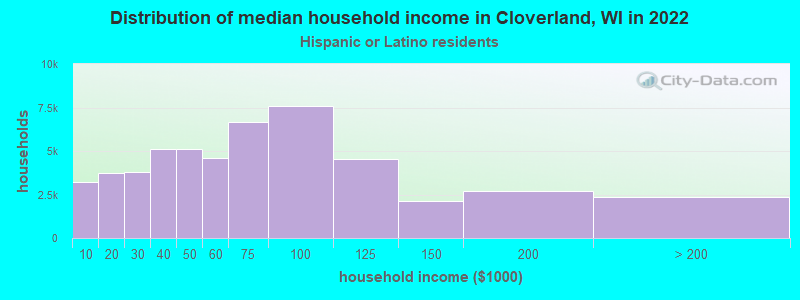
- $47,508Hispanic or Latino race householders
- Median 2022 house value
- $335,358White Non-Hispanic householders
- $259,967Two or more races householders
- $153,617Hispanic or Latino householders
Household income for White non-Hispanic householders
Household income for Two or more races householders
Household income for Hispanic or Latino race householders
Foreign-born residents in Cloverland
10 residents are foreign born
| This city: | 1.1% |
| Wisconsin: | 3.6% |
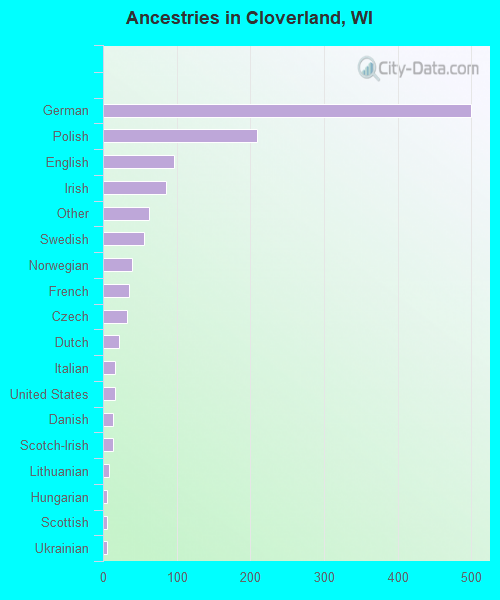
Ancestries in Cloverland

- 49940.7%German
- 20917.1%Polish
- 967.8%English
- 856.9%Irish
- 625.1%Other
- 554.5%Swedish
- 403.3%Norwegian
- 352.9%French
- 332.7%Czech
- 221.8%Dutch
- 161.3%Italian
- 161.3%United States
- 131.1%Danish
- 131.1%Scotch-Irish
- 80.7%Lithuanian
- 60.5%Hungarian
- 60.5%Scottish
- 50.4%Ukrainian
- 20.2%Greek
- 20.2%Russian
- 20.2%Welsh
Zip codes: 54521.