Races in Colorado Springs, Colorado (CO) Detailed Stats
Data:
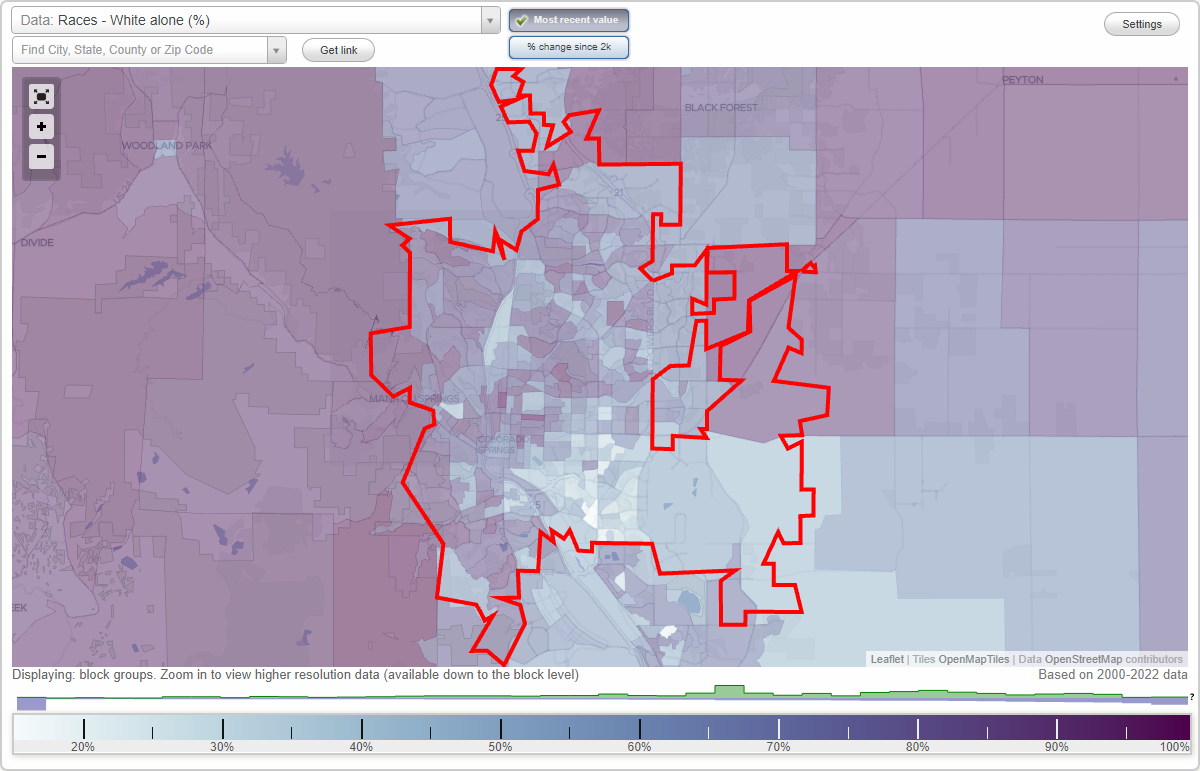
Races - White alone (%)
Races - White alone (% change since 2000)
Races - Black alone (%)
Races - Black alone (% change since 2000)
Races - American Indian alone (%)
Races - American Indian alone (% change since 2000)
Races - Asian alone (%)
Races - Asian alone (% change since 2000)
Races - Hispanic (%)
Races - Hispanic (% change since 2000)
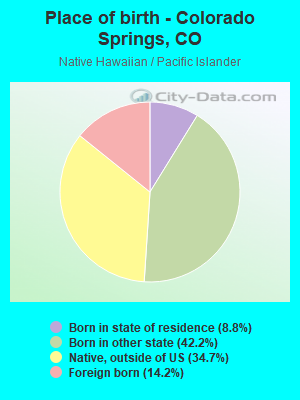
Races - Native Hawaiian and Other Pacific Islander alone (%)
Races - Native Hawaiian and Other Pacific Islander alone (% change since 2000)
Races - Two or more races(%)
Races - Two or more races(% change since 2000)
Races - Other race alone (%)
Races - Other race alone (% change since 2000)
Racial diversity
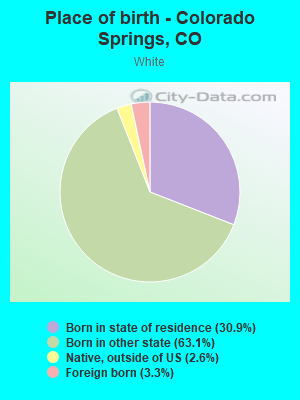
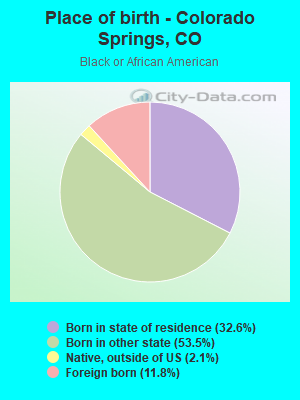
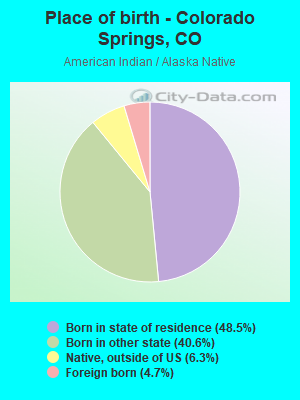
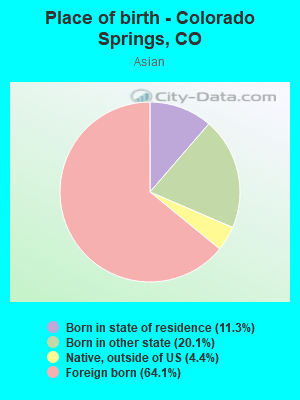
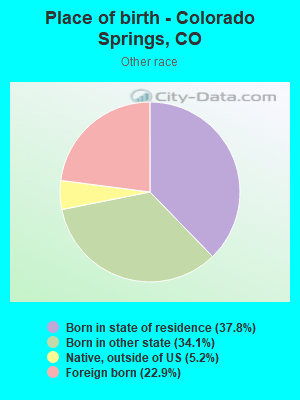
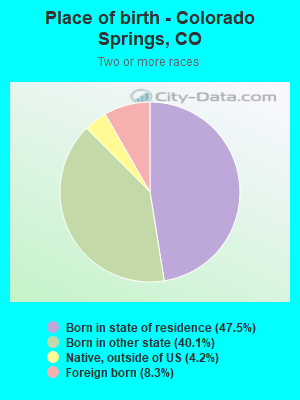
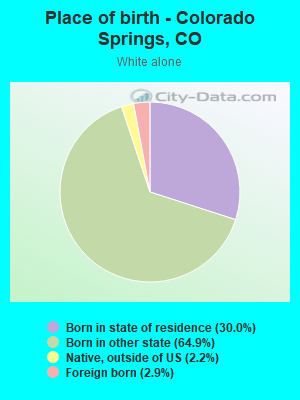
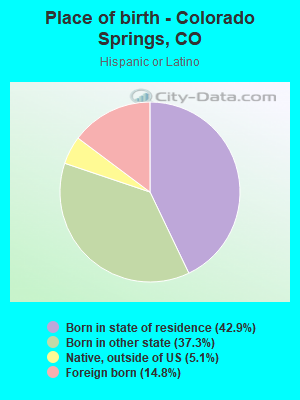
Place of birth - Born in state of residence (%)
Place of birth - Born in state of residence (%) - White
Place of birth - Born in state of residence (%) - Black or African American
Place of birth - Born in state of residence (%) - Asian
Place of birth - Born in state of residence (%) - Hispanic or Latino
Place of birth - Born in state of residence (%) - American Indian and Alaska Native
Place of birth - Born in state of residence (%) - Multirace
Place of birth - Born in state of residence (%) - Other Race
Place of birth - Born in other state (%)
Place of birth - Born in other state (%) - White
Place of birth - Born in other state (%) - Black or African American
Place of birth - Born in other state (%) - Asian
Place of birth - Born in other state (%) - Hispanic or Latino
Place of birth - Born in other state (%) - American Indian and Alaska Native
Place of birth - Born in other state (%) - Multirace
Place of birth - Born in other state (%) - Other Race
Place of birth - Native, outside of US (%)
Place of birth - Native, outside of US (%) - White
Place of birth - Native, outside of US (%) - Black or African American
Place of birth - Native, outside of US (%) - Asian
Place of birth - Native, outside of US (%) - Hispanic or Latino
Place of birth - Native, outside of US (%) - American Indian and Alaska Native
Place of birth - Native, outside of US (%) - Multirace
Place of birth - Native, outside of US (%) - Other Race
Place of birth - Foreign born (%)
Place of birth - Foreign born (%) - White
Place of birth - Foreign born (%) - Black or African American
Place of birth - Foreign born (%) - Asian
Place of birth - Foreign born (%) - Hispanic or Latino
Place of birth - Foreign born (%) - American Indian and Alaska Native
Place of birth - Foreign born (%) - Multirace
Place of birth - Foreign born (%) - Other Race
Residents speaking English at home (%)
Residents speaking English at home - Born in the United States (%)
Residents speaking English at home - Native, born elsewhere (%)
Residents speaking English at home - Foreign born (%)
Residents speaking Spanish at home (%)
Residents speaking Spanish at home - Born in the United States (%)
Residents speaking Spanish at home - Native, born elsewhere (%)
Residents speaking Spanish at home - Foreign born (%)
Residents speaking other language at home (%)
Residents speaking other language at home - Born in the United States (%)
Residents speaking other language at home - Native, born elsewhere (%)
Residents speaking other language at home - Foreign born (%)
Marital status - Never married (%)
Marital status - Now married (%)
Marital status - Separated (%)
Marital status - Widowed (%)
Marital status - Divorced (%)
Ancestries Reported - Arab (%)
Ancestries Reported - Czech (%)
Ancestries Reported - Danish (%)
Ancestries Reported - Dutch (%)
Ancestries Reported - English (%)
Ancestries Reported - French (%)
Ancestries Reported - French Canadian (%)
Ancestries Reported - German (%)
Ancestries Reported - Greek (%)
Ancestries Reported - Hungarian (%)
Ancestries Reported - Irish (%)
Ancestries Reported - Italian (%)
Ancestries Reported - Lithuanian (%)
Ancestries Reported - Norwegian (%)
Ancestries Reported - Polish (%)
Ancestries Reported - Portuguese (%)
Ancestries Reported - Russian (%)
Ancestries Reported - Scotch-Irish (%)
Ancestries Reported - Scottish (%)
Ancestries Reported - Slovak (%)
Ancestries Reported - Subsaharan African (%)
Ancestries Reported - Swedish (%)
Ancestries Reported - Swiss (%)
Ancestries Reported - Ukrainian (%)
Ancestries Reported - United States (%)
Ancestries Reported - Welsh (%)
Ancestries Reported - West Indian (%)
Ancestries Reported - Other (%)
Geographical mobility - Same house 1 year ago (%)
Geographical mobility - Same house 1 year ago (%) - White
Geographical mobility - Same house 1 year ago (%) - Black or African American
Geographical mobility - Same house 1 year ago (%) - Asian
Geographical mobility - Same house 1 year ago (%) - Hispanic or Latino
Geographical mobility - Same house 1 year ago (%) - American Indian and Alaska Native
Geographical mobility - Same house 1 year ago (%) - Multirace
Geographical mobility - Same house 1 year ago (%) - Other Race
Geographical mobility - Moved within same county (%)
Geographical mobility - Moved within same county (%) - White
Geographical mobility - Moved within same county (%) - Black or African American
Geographical mobility - Moved within same county (%) - Asian
Geographical mobility - Moved within same county (%) - Hispanic or Latino
Geographical mobility - Moved within same county (%) - American Indian and Alaska Native
Geographical mobility - Moved within same county (%) - Multirace
Geographical mobility - Moved within same county (%) - Other Race
Geographical mobility - Moved from different county within same state (%)
Geographical mobility - Moved from different county within same state (%) - White
Geographical mobility - Moved from different county within same state (%) - Black or African American
Geographical mobility - Moved from different county within same state (%) - Asian
Geographical mobility - Moved from different county within same state (%) - Hispanic or Latino
Geographical mobility - Moved from different county within same state (%) - American Indian and Alaska Native
Geographical mobility - Moved from different county within same state (%) - Multirace
Geographical mobility - Moved from different county within same state (%) - Other Race
Geographical mobility - Moved from different state (%)
Geographical mobility - Moved from different state (%) - White
Geographical mobility - Moved from different state (%) - Black or African American
Geographical mobility - Moved from different state (%) - Asian
Geographical mobility - Moved from different state (%) - Hispanic or Latino
Geographical mobility - Moved from different state (%) - American Indian and Alaska Native
Geographical mobility - Moved from different state (%) - Multirace
Geographical mobility - Moved from different state (%) - Other Race
Geographical mobility - Moved from abroad (%)
Geographical mobility - Moved from abroad (%) - White
Geographical mobility - Moved from abroad (%) - Black or African American
Geographical mobility - Moved from abroad (%) - Asian
Geographical mobility - Moved from abroad (%) - Hispanic or Latino
Geographical mobility - Moved from abroad (%) - American Indian and Alaska Native
Geographical mobility - Moved from abroad (%) - Multirace
Geographical mobility - Moved from abroad (%) - Other Race
Place of birth for the foreign-born population - Ireland (%)
Place of birth for the foreign-born population - Denmark (%)
Place of birth for the foreign-born population - Norway (%)
Place of birth for the foreign-born population - Sweden (%)
Place of birth for the foreign-born population - United Kingdom (%)
Place of birth for the foreign-born population - England (%)
Place of birth for the foreign-born population - Scotland (%)
Place of birth for the foreign-born population - Other Northern Europe (%)
Place of birth for the foreign-born population - Austria (%)
Place of birth for the foreign-born population - Belgium (%)
Place of birth for the foreign-born population - France (%)
Place of birth for the foreign-born population - Germany (%)
Place of birth for the foreign-born population - Netherlands (%)
Place of birth for the foreign-born population - Switzerland (%)
Place of birth for the foreign-born population - Other Western Europe (%)
Place of birth for the foreign-born population - Greece (%)
Place of birth for the foreign-born population - Italy (%)
Place of birth for the foreign-born population - Portugal (%)
Place of birth for the foreign-born population - Spain (%)
Place of birth for the foreign-born population - Other Southern Europe (%)
Place of birth for the foreign-born population - Albania (%)
Place of birth for the foreign-born population - Belarus (%)
Place of birth for the foreign-born population - Bosnia and Herzegovina (%)
Place of birth for the foreign-born population - Bulgaria (%)
Place of birth for the foreign-born population - Croatia (%)
Place of birth for the foreign-born population - Czechoslovakia (%)
Place of birth for the foreign-born population - Hungary (%)
Place of birth for the foreign-born population - Latvia (%)
Place of birth for the foreign-born population - Lithuania (%)
Place of birth for the foreign-born population - North Macedonia (Macedonia) (%)
Place of birth for the foreign-born population - Moldova (%)
Place of birth for the foreign-born population - Poland (%)
Place of birth for the foreign-born population - Romania (%)
Place of birth for the foreign-born population - Russia (%)
Place of birth for the foreign-born population - Serbia (%)
Place of birth for the foreign-born population - Ukraine (%)
Place of birth for the foreign-born population - Other Eastern Europe (%)
Place of birth for the foreign-born population - China (%)
Place of birth for the foreign-born population - Hong Kong (%)
Place of birth for the foreign-born population - Taiwan (%)
Place of birth for the foreign-born population - Japan (%)
Place of birth for the foreign-born population - Korea (%)
Place of birth for the foreign-born population - Other Eastern Asia (%)
Place of birth for the foreign-born population - Afghanistan (%)
Place of birth for the foreign-born population - Bangladesh (%)
Place of birth for the foreign-born population - India (%)
Place of birth for the foreign-born population - Iran (%)
Place of birth for the foreign-born population - Kazakhstan (%)
Place of birth for the foreign-born population - Nepal (%)
Place of birth for the foreign-born population - Pakistan (%)
Place of birth for the foreign-born population - Sri Lanka (%)
Place of birth for the foreign-born population - Uzbekistan (%)
Place of birth for the foreign-born population - Other South Central Asia (%)
Place of birth for the foreign-born population - Burma (%)
Place of birth for the foreign-born population - Cambodia (%)
Place of birth for the foreign-born population - Indonesia (%)
Place of birth for the foreign-born population - Laos (%)
Place of birth for the foreign-born population - Malaysia (%)
Place of birth for the foreign-born population - Philippines (%)
Place of birth for the foreign-born population - Singapore (%)
Place of birth for the foreign-born population - Thailand (%)
Place of birth for the foreign-born population - Vietnam (%)
Place of birth for the foreign-born population - Other South Eastern Asia (%)
Place of birth for the foreign-born population - Armenia (%)
Place of birth for the foreign-born population - Iraq (%)
Place of birth for the foreign-born population - Israel (%)
Place of birth for the foreign-born population - Jordan (%)
Place of birth for the foreign-born population - Kuwait (%)
Place of birth for the foreign-born population - Lebanon (%)
Place of birth for the foreign-born population - Saudi Arabia (%)
Place of birth for the foreign-born population - Syria (%)
Place of birth for the foreign-born population - Turkey (%)
Place of birth for the foreign-born population - Yemen (%)
Place of birth for the foreign-born population - Other Western Asia (%)
Place of birth for the foreign-born population - Eritrea (%)
Place of birth for the foreign-born population - Ethiopia (%)
Place of birth for the foreign-born population - Kenya (%)
Place of birth for the foreign-born population - Somalia (%)
Place of birth for the foreign-born population - Uganda (%)
Place of birth for the foreign-born population - Zimbabwe (%)
Place of birth for the foreign-born population - Other Eastern Africa (%)
Place of birth for the foreign-born population - Cameroon (%)
Place of birth for the foreign-born population - Congo (%)
Place of birth for the foreign-born population - Democratic Republic of Congo (Zaire) (%)
Place of birth for the foreign-born population - Other Middle Africa (%)
Place of birth for the foreign-born population - Egypt (%)
Place of birth for the foreign-born population - Morocco (%)
Place of birth for the foreign-born population - Sudan (%)
Place of birth for the foreign-born population - Other Northern Africa (%)
Place of birth for the foreign-born population - South Africa (%)
Place of birth for the foreign-born population - Other Southern Africa (%)
Place of birth for the foreign-born population - Cabo Verde (%)
Place of birth for the foreign-born population - Ghana (%)
Place of birth for the foreign-born population - Liberia (%)
Place of birth for the foreign-born population - Nigeria (%)
Place of birth for the foreign-born population - Senegal (%)
Place of birth for the foreign-born population - Sierra Leone (%)
Place of birth for the foreign-born population - Other Western Africa (%)
Place of birth for the foreign-born population - Australia (%)
Place of birth for the foreign-born population - New Zealand (%)
Place of birth for the foreign-born population - Fiji (%)
Place of birth for the foreign-born population - Micronesia (%)
Place of birth for the foreign-born population - Bahamas (%)
Place of birth for the foreign-born population - Barbados (%)
Place of birth for the foreign-born population - Cuba (%)
Place of birth for the foreign-born population - Dominica (%)
Place of birth for the foreign-born population - Dominican Republic (%)
Place of birth for the foreign-born population - Grenada (%)
Place of birth for the foreign-born population - Haiti (%)
Place of birth for the foreign-born population - Jamaica (%)
Place of birth for the foreign-born population - St. Vincent and the Grenadines (%)
Place of birth for the foreign-born population - Trinidad and Tobago (%)
Place of birth for the foreign-born population - West Indies (%)
Place of birth for the foreign-born population - Other Caribbean (%)
Place of birth for the foreign-born population - Belize (%)
Place of birth for the foreign-born population - Costa Rica (%)
Place of birth for the foreign-born population - El Salvador (%)
Place of birth for the foreign-born population - Guatemala (%)
Place of birth for the foreign-born population - Honduras (%)
Place of birth for the foreign-born population - Mexico (%)
Place of birth for the foreign-born population - Nicaragua (%)
Place of birth for the foreign-born population - Panama (%)
Place of birth for the foreign-born population - Other Central America (%)
Place of birth for the foreign-born population - Argentina (%)
Place of birth for the foreign-born population - Bolivia (%)
Place of birth for the foreign-born population - Brazil (%)
Place of birth for the foreign-born population - Chile (%)
Place of birth for the foreign-born population - Colombia (%)
Place of birth for the foreign-born population - Ecuador (%)
Place of birth for the foreign-born population - Guyana (%)
Place of birth for the foreign-born population - Peru (%)
Place of birth for the foreign-born population - Uruguay (%)
Place of birth for the foreign-born population - Venezuela (%)
Place of birth for the foreign-born population - Other South America (%)
Place of birth for the foreign-born population - Canada (%)
Place of birth for the foreign-born population - Other Northern America (%)
Place of birth for the foreign-born population - Other (%)
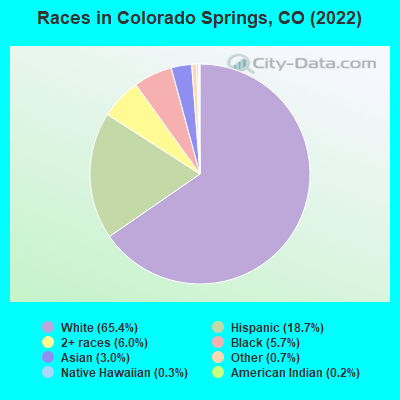
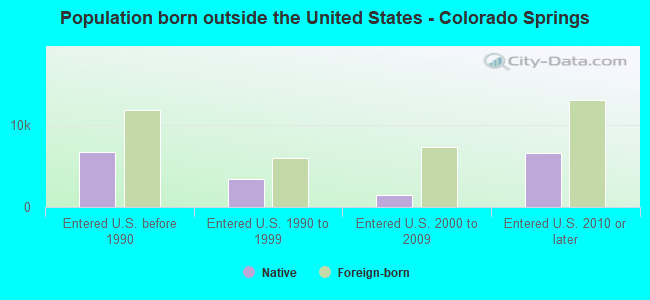
According to 2022 data, the most numerous races in Colorado Springs, CO are White alone (321,884 residents), Hispanic (94,880 residents), and Two or more races (30,487 residents). 87.9% of Colorado Springs residents speak English at home. 7.2% of Colorado Springs, CO residents are foreign-born (2.9% born in Latin America, 2.1% born in Asia, 1.5% born in Europe), which is 25.6% less than the foreign-born rate of 9.0% across the entire state of Colorado.
Race distribution in Colorado Springs
2000 2022
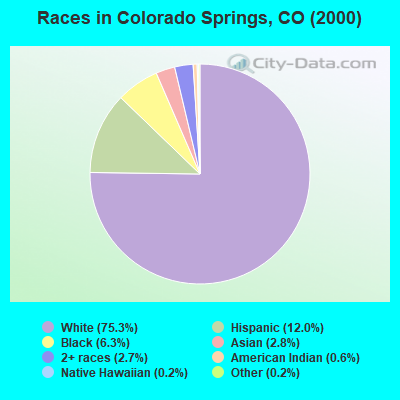
271,734 75.3% White alone 43,330 12.0% Hispanic 22,760 6.3% Black alone 9,956 2.8% Asian alone 9,683 2.7% Two or more races 2,095 0.6% American Indian alone 651 0.2% Other race alone 681 0.2% Native Hawaiian and Other
321,884 65.4% White alone 94,880 19.3% Hispanic 30,487 6.2% Two or more races 27,690 5.6% Black alone 14,729 3.0% Asian alone 2,287 0.5% Other race alone 2,128 0.4% American Indian alone 1,524 0.3% Native Hawaiian and Other
2000 2022
3,202,880 74.5% White alone 735,601 17.1% Hispanic 158,443 3.7% Black alone 93,277 2.2% Asian alone 72,721 1.7% Two or more races 28,982 0.7% American Indian alone 5,512 0.1% Other race alone 3,845 0.09% Native Hawaiian and Other
3,793,270 65.0% White alone 1,314,962 22.5% Hispanic 268,754 4.6% Two or more races 220,756 3.8% Black alone 182,658 3.1% Asian alone 29,798 0.5% Other race alone 23,389 0.4% American Indian alone 6,339 0.1% Native Hawaiian and Other
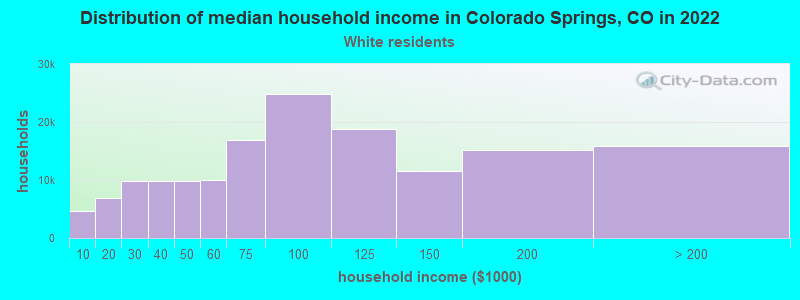
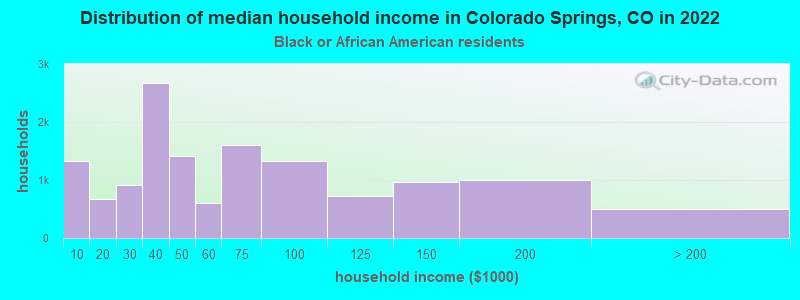
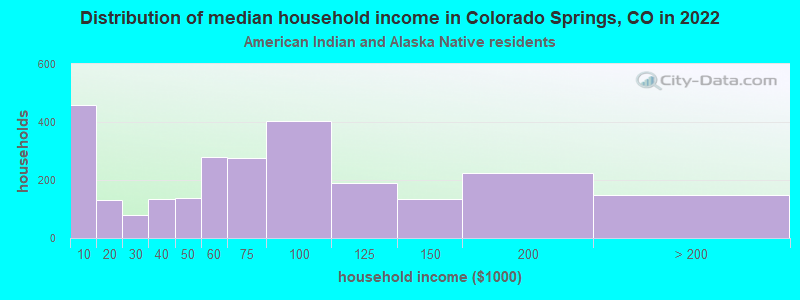
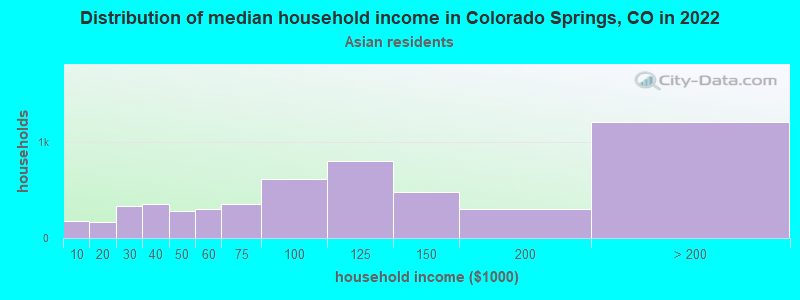
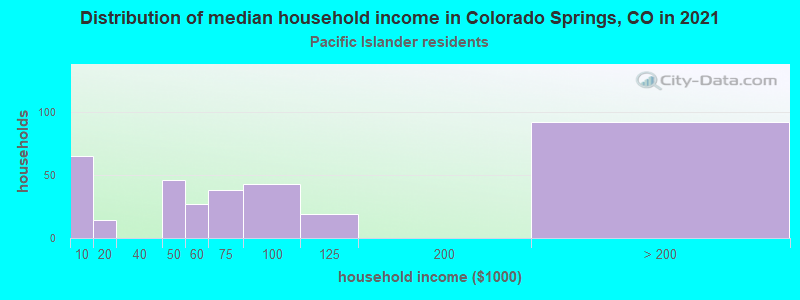
Income and house value in Colorado Springs Median household income in 2022 $89,274 White non-Hispanic householders$66,200 Black householders$39,023 American Indian and Alaska Native householders$77,763 Asian householders$48,672 Native Hawaiian and other Pacific Islander householders$55,203 Some other race householders$69,045 Two or more races householders$68,654 Hispanic or Latino race householdersMedian 2022 house value $496,600 White Non-Hispanic householders$414,662 Black or African American householders$402,056 American Indian or Alaska Native householders $541,715 Asian householders$379,499 Native Hawaiian and other Pacific Islander householders$383,480 Some other race householders$447,503 Two or more races householders$420,302 Hispanic or Latino householders
Median age by race in Colorado Springs
39.1 Median age for White residents37.4 41.1 31.7 Median age for Black or African American residents29.7 34.9 44.0 Median age for American Indian / Alaska Native residents43.7 42.3 42.7 Median age for Asian residents36.8 45.8 32.3 Median age for Native Hawaiian / Pacific Islander residents31.7 70.3 31.0 Median age for Other race residents28.5 31.5 27.6 Median age for Two or more races residents23.8 29.4 40.2 Median age for White alone residents37.9 42.4 28.2 Median age for Hispanic or Latino residents26.9 29.3
Owner/renter occupied households by race in Colorado Springs
House owners and renters - White residents 98,882 65.3% Owner occupied52,501 34.7% Renter occupiedHouse owners and renters - Black or African American residents 5,906 43.1% Owner occupied7,790 56.9% Renter occupiedHouse owners and renters - American Indian / Alaska Native residents 870 42.6% Owner occupied1,174 57.4% Renter occupiedHouse owners and renters - Asian residents 3,792 61.6% Owner occupied2,367 38.4% Renter occupiedHouse owners and renters - Native Hawaiian / Pacific Islander residents 203 44.8% Owner occupied250 55.2% Renter occupiedHouse owners and renters - Other race residents 4,024 44.7% Owner occupied4,969 55.3% Renter occupiedHouse owners and renters - Two or more races residents 9,730 43.6% Owner occupied12,565 56.4% Renter occupiedHouse owners and renters - White alone residents 92,529 65.3% Owner occupied49,178 34.7% Renter occupiedHouse owners and renters - Hispanic or Latino residents 15,174 49.4% Owner occupied15,558 50.6% Renter occupied
Language usage in Colorado Springs
English speakers - Total 87.9% of residents of Colorado Springs speak English at home.
7.8% of residents speak Spanish at home 23,244 66.0% Speak English very well11,974 34.0% Speak English less than very well4.5% of residents speak other language at home 14,203 70.7% Speak English very well5,898 29.3% Speak English less than very well
English speakers - Born in the United States 94.3% of residents of Colorado Springs speak English at home.
4.4% of residents speak Spanish at home 9,884 83.9% Speak English very well1,890 16.1% Speak English less than very well1.3% of residents speak other language at home 3,074 87.4% Speak English very well444 12.6% Speak English less than very well
English speakers - Native, born elsewhere 73.5% of residents of Colorado Springs speak English at home.
17.8% of residents speak Spanish at home 1,792 70.4% Speak English very well755 29.6% Speak English less than very well8.5% of residents speak other language at home 1,006 82.3% Speak English very well216 17.7% Speak English less than very well
English speakers - Foreign-born 28.3% of residents of Colorado Springs speak English at home.
34.4% of residents speak Spanish at home 3,981 33.1% Speak English very well8,058 66.9% Speak English less than very well38.5% of residents speak other language at home 8,449 62.8% Speak English very well5,007 37.2% Speak English less than very well
White (Caucasian) - Speak only English Native:
97.1% (314,765)Foreign-born:
51.5% (6,125)
White (Caucasian) - Speak another language Native:
3.7% (12,054)Foreign-born:
56.9% (6,774)
Black or African American - Speak only English Native:
94.4% (24,467)Foreign-born:
29.0% (1,076)
Black or African American - Speak another language Native:
5.5% (1,436)Foreign-born:
69.9% (2,593)
American Indian / Alaska Native - Speak only English Native:
83.5% (3,063)Foreign-born:
14.2% (29)
American Indian / Alaska Native - Speak another language Native:
16.4% (601)Foreign-born:
85.4% (172)
Asian - Speak only English Native:
70.6% (3,748)Foreign-born:
27.5% (2,392)
Asian - Speak another language Native:
30.2% (1,603)Foreign-born:
73.2% (6,372)
Native Hawaiian / Pacific Islander - Speak only English Native:
71.0% (707)Foreign-born:
24.3% (54)
Native Hawaiian / Pacific Islander - Speak another language Native:
26.0% (259)Foreign-born:
71.0% (156)
Other race - Speak only English Native:
56.3% (11,089)Foreign-born:
21.4% (1,574)
Other race - Speak another language Native:
43.7% (8,608)Foreign-born:
82.7% (6,089)
Two or more races - Speak only English Native:
75.9% (48,412)Foreign-born:
15.8% (1,159)
Two or more races - Speak another language Native:
27.5% (17,541)Foreign-born:
75.2% (5,519)
White alone - Speak only English Native:
98.4% (292,853)Foreign-born:
56.2% (5,981)
White alone - Speak another language Native:
1.7% (5,006)Foreign-born:
43.7% (4,652)
Hispanic or Latino - Speak only English Native:
71.7% (52,378)Foreign-born:
13.4% (1,829)
Hispanic or Latino - Speak another language Native:
29.0% (21,207)Foreign-born:
88.4% (12,104)
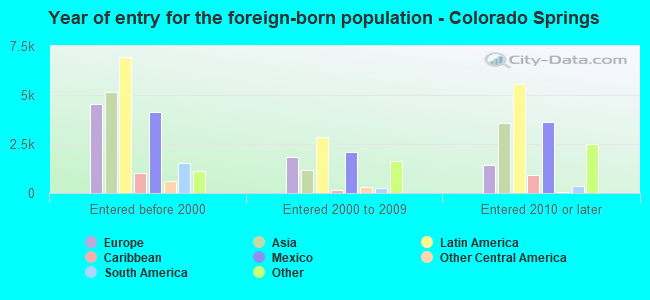
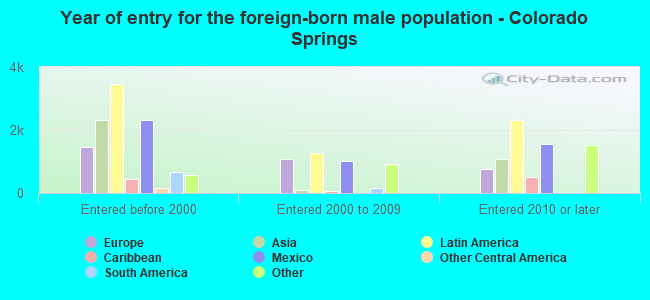
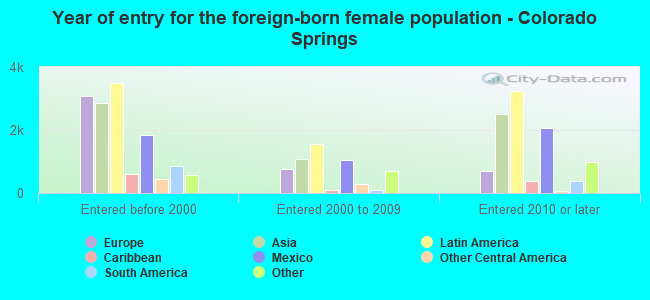
Foreign-born residents in Colorado Springs 35,308 residents are foreign born (2.9% Latin America , 2.1% Asia , 1.5% Europe ).
This city:
7.2%Colorado:
100.0%
Marital status for residents in Colorado Springs Marital status - White (Caucasian) population 15 years and over
Males 33.9% Never married52.3% Now married0.7% Separated2.5% Widowed10.7% DivorcedFemales 24.7% Never married51.0% Now married1.8% Separated7.7% Widowed14.8% DivorcedWomen who gave birth in the past 12 months Now married:
75.7% (3,319)Unmarried:
24.3% (1,063)
Women who did not give birth in the past 12 months Now married:
47.8% (37,355)Unmarried:
52.2% (40,777)
Marital status - Black or African American population 15 years and over
Males 50.6% Never married37.8% Now married2.5% Separated2.9% Widowed6.1% DivorcedFemales 38.0% Never married30.7% Now married4.2% Separated10.7% Widowed16.5% DivorcedWomen who gave birth in the past 12 months Now married:
43.8% (118)Unmarried:
56.2% (151)
Women who did not give birth in the past 12 months Now married:
29.9% (2,361)Unmarried:
70.1% (5,542)
Marital status - American Indian / Alaska Native population 15 years and over
Males 37.8% Never married35.6% Now married5.2% Separated4.1% Widowed17.2% DivorcedFemales 36.9% Never married36.3% Now married0.5% Separated3.4% Widowed22.8% DivorcedWomen who gave birth in the past 12 months Now married:
20.3% (14)Unmarried:
79.7% (55)
Women who did not give birth in the past 12 months Now married:
30.4% (315)Unmarried:
69.6% (722)
Marital status - Asian population 15 years and over
Males 31.8% Never married56.6% Now married0.8% Separated2.3% Widowed8.4% DivorcedFemales 25.9% Never married62.8% Now married2.5% Separated2.6% Widowed6.1% DivorcedWomen who gave birth in the past 12 months Now married:
100.0% (84)Unmarried:
0.0% (0)
Women who did not give birth in the past 12 months Now married:
60.5% (2,750)Unmarried:
39.5% (1,796)
Marital status - Native Hawaiian / Pacific Islander population 15 years and over
Males 38.8% Never married51.2% Now married3.4% Separated1.4% Widowed5.2% DivorcedFemales 33.3% Never married52.2% Now married0.0% Separated0.0% Widowed14.5% DivorcedWomen who gave birth in the past 12 months Now married:
61.3% (14)Unmarried:
38.7% (9)
Women who did not give birth in the past 12 months Now married:
46.9% (164)Unmarried:
53.1% (186)
Marital status - Other race population 15 years and over
Males 47.3% Never married36.7% Now married0.0% Separated0.0% Widowed16.0% DivorcedFemales 39.4% Never married37.2% Now married9.2% Separated4.2% Widowed10.1% DivorcedWomen who gave birth in the past 12 months Now married:
52.4% (343)Unmarried:
47.6% (311)
Women who did not give birth in the past 12 months Now married:
45.8% (3,979)Unmarried:
54.2% (4,710)
Marital status - Two or more races population 15 years and over
Males 54.8% Never married35.7% Now married0.0% Separated2.7% Widowed6.8% DivorcedFemales 41.7% Never married35.4% Now married3.4% Separated0.0% Widowed19.4% DivorcedWomen who gave birth in the past 12 months Now married:
100.0% (1,725)Unmarried:
0.0% (0)
Women who did not give birth in the past 12 months Now married:
32.7% (7,092)Unmarried:
67.3% (14,624)
Marital status - White alone, not Hispanic / Latino population 15 years and over
Males 32.6% Never married53.4% Now married0.7% Separated2.6% Widowed10.6% DivorcedFemales 23.9% Never married51.5% Now married1.8% Separated7.8% Widowed15.1% DivorcedWomen who gave birth in the past 12 months Now married:
76.8% (2,770)Unmarried:
23.2% (837)
Women who did not give birth in the past 12 months Now married:
47.3% (33,395)Unmarried:
52.7% (37,199)
Marital status - Hispanic or Latino population 15 years and over
Males 45.0% Never married41.2% Now married0.7% Separated1.4% Widowed11.6% DivorcedFemales 32.5% Never married44.4% Now married4.7% Separated6.1% Widowed12.4% DivorcedWomen who gave birth in the past 12 months Now married:
74.0% (1,387)Unmarried:
26.0% (486)
Women who did not give birth in the past 12 months Now married:
48.0% (12,028)Unmarried:
52.0% (13,041)
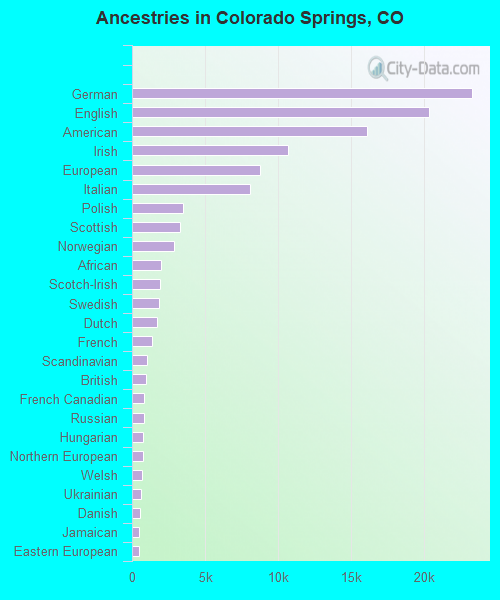
Ancestries in Colorado Springs
20,033 10.3% German15,028 7.7% English13,700 7.0% European12,952 6.7% American11,922 6.1% Irish5,745 3.0% Italian2,741 1.4% Scottish2,596 1.3% Norwegian2,532 1.3% Polish1,730 0.9% African1,722 0.9% Swedish1,528 0.8% French1,418 0.7% British1,380 0.7% Scotch-Irish1,249 0.6% Dutch1,175 0.6% Northern European1,134 0.6% Scandinavian895 0.5% Eastern European823 0.4% French Canadian709 0.4% Danish674 0.3% Czech644 0.3% Hungarian634 0.3% Russian489 0.3% Canadian454 0.2% Welsh448 0.2% Ukrainian387 0.2% Jamaican358 0.2% Greek350 0.2% Sudanese336 0.2% Austrian298 0.2% Lithuanian284 0.1% Swiss256 0.1% Portuguese254 0.1% Brazilian231 0.1% Finnish225 0.1% Lebanese204 0.1% Yugoslavian202 0.1% Romanian186 0.10% Czechoslovakian167 0.09% Croatian161 0.08% Iranian147 0.08% Ethiopian140 0.07% Belgian138 0.07% Palestinian135 0.07% Egyptian125 0.06% Haitian112 0.06% Slovak108 0.06% Celtic96 0.05% Iraqi94 0.05% Ghanaian88 0.05% Serbian87 0.04% Jordanian84 0.04% Slavic79 0.04% Slovene78 0.04% Nigerian75 0.04% Kenyan74 0.04% German Russian55 0.03% South African52 0.03% Somali51 0.03% West Indian48 0.02% Arab46 0.02% Turkish45 0.02% Pennsylvania German42 0.02% Senegalese42 0.02% British West Indian38 0.02% Australian36 0.02% Latvian35 0.02% Belizean30 0.02% Moroccan29 0.01% Israeli29 0.01% Liberian29 0.01% Guyanese28 0.01% Estonian27 0.01% Luxembourger26 0.01% Barbadian24 0.01% Cajun21 0.01% Alsatian21 0.01% Icelander20 0.01% Afghan19 0.01% Armenian17 0.01% Bulgarian17 0.01% Trinidadian and Tobagonian11 0.01% Macedonian10 0.01% Cape Verdean
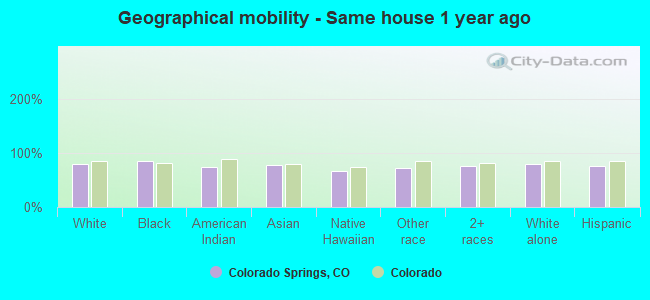
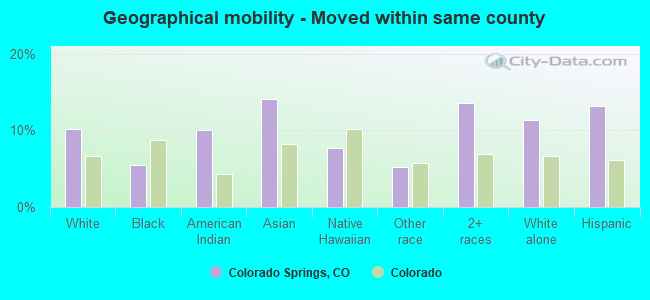
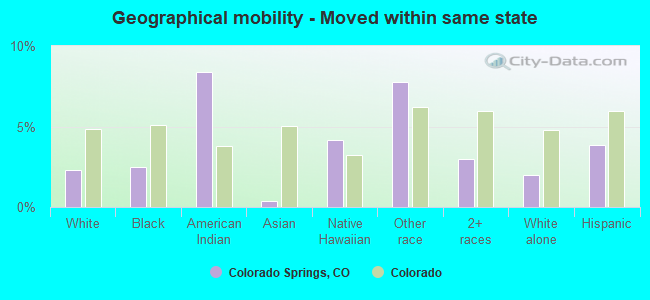
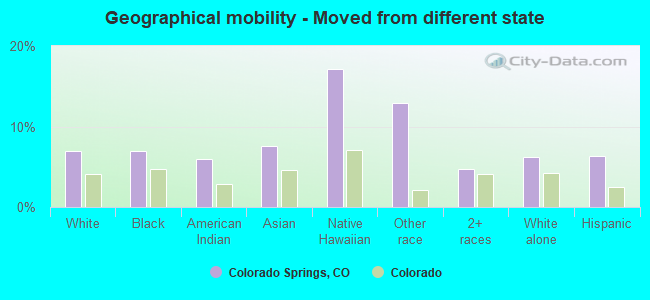
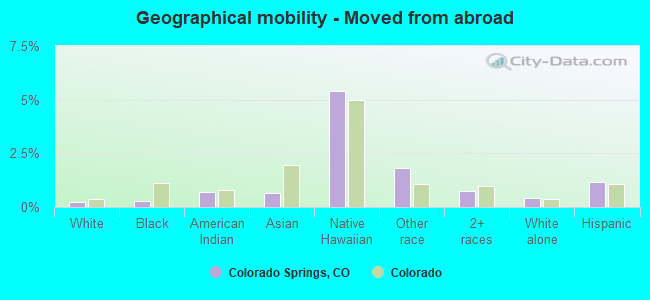
Geographical mobility in Colorado Springs Same house 1 year ago 277,612 80.1% White (Caucasian)26,840 85.6% Black or African American3,111 74.1% American Indian / Alaska Native11,742 78.3% Asian840 66.6% Native Hawaiian / Pacific Islander20,199 71.2% Other race60,039 75.5% Two or more races251,811 79.6% White alone, not Hispanic / Latino63,666 75.1% Hispanic or LatinoMoved within same county 35,494 10.2% White / Caucasian1,719 5.5% Black or African American419 10.0% American Indian / Alaska Native2,107 14.1% Asian97 7.7% Native Hawaiian / Pacific Islander1,498 5.3% Other race10,805 13.6% Two or more races35,845 11.3% White alone, not Hispanic / Latino11,131 13.1% Hispanic or LatinoMoved within same state 8,075 2.3% White / Caucasian774 2.5% Black or African American351 8.4% American Indian / Alaska Native60 0.4% Asian52 4.2% Native Hawaiian / Pacific Islander2,197 7.7% Other race2,385 3.0% Two or more races6,311 2.0% White alone, not Hispanic / Latino3,242 3.8% Hispanic or LatinoMoved from different state 23,984 6.9% White / Caucasian2,162 6.9% Black or African American248 5.9% American Indian / Alaska Native1,142 7.6% Asian217 17.2% Native Hawaiian / Pacific Islander3,672 12.9% Other race3,730 4.7% Two or more races19,645 6.2% White alone, not Hispanic / Latino5,320 6.3% Hispanic or LatinoMoved from abroad 811 0.2% White93 0.3% Black or African American30 0.7% American Indian / Alaska Native97 0.6% Asian68 5.4% Native Hawaiian / Pacific Islander520 1.8% Other race589 0.7% Two or more races1,280 0.4% White alone, not Hispanic / Latino990 1.2% Hispanic or Latino
Children Nativity (place of birth) in Colorado Springs
Children under 6 years - Living with two parents Both parents native 20,560 100.0% NativeBoth parents foreign-born 1,424 84.4% Native263 15.6% Foreign-bornOne native, one foreign-born parent 1,954 100.0% NativeChildren under 6 years - Living with one parent Native parent 7,297 100.0% NativeForeign-born parent 704 87.4% Native101 12.6% Foreign-bornChildren 6 to 17 years - Living with two parents Both parents native 33,989 98.4% Native552 1.6% Foreign-bornBoth parents foreign-born 2,678 75.3% Native877 24.7% Foreign-bornOne native, one foreign-born parent 3,235 92.8% Native251 7.2% Foreign-bornChildren 6 to 17 years - Living with one parent Native parent 19,153 100.0% NativeForeign-born parent 3,514 50.5% Native3,444 49.5% Foreign-born
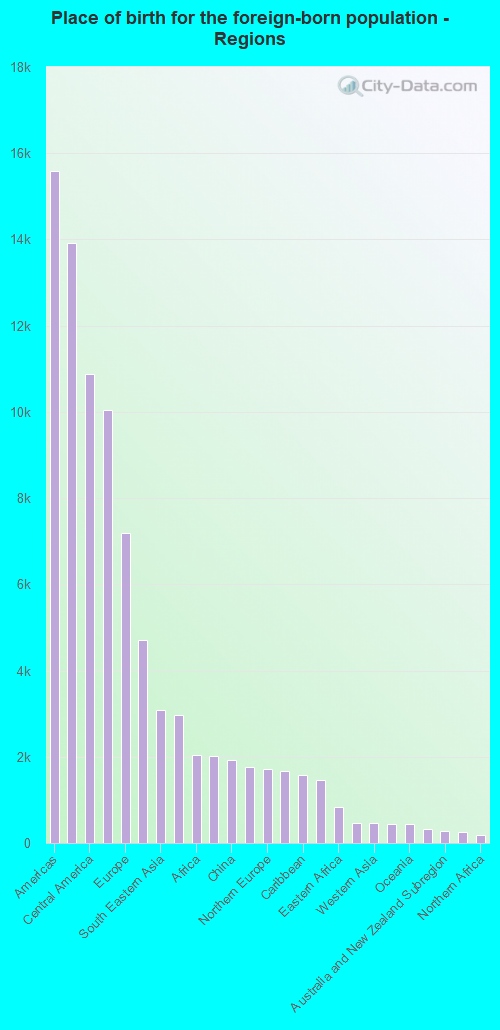
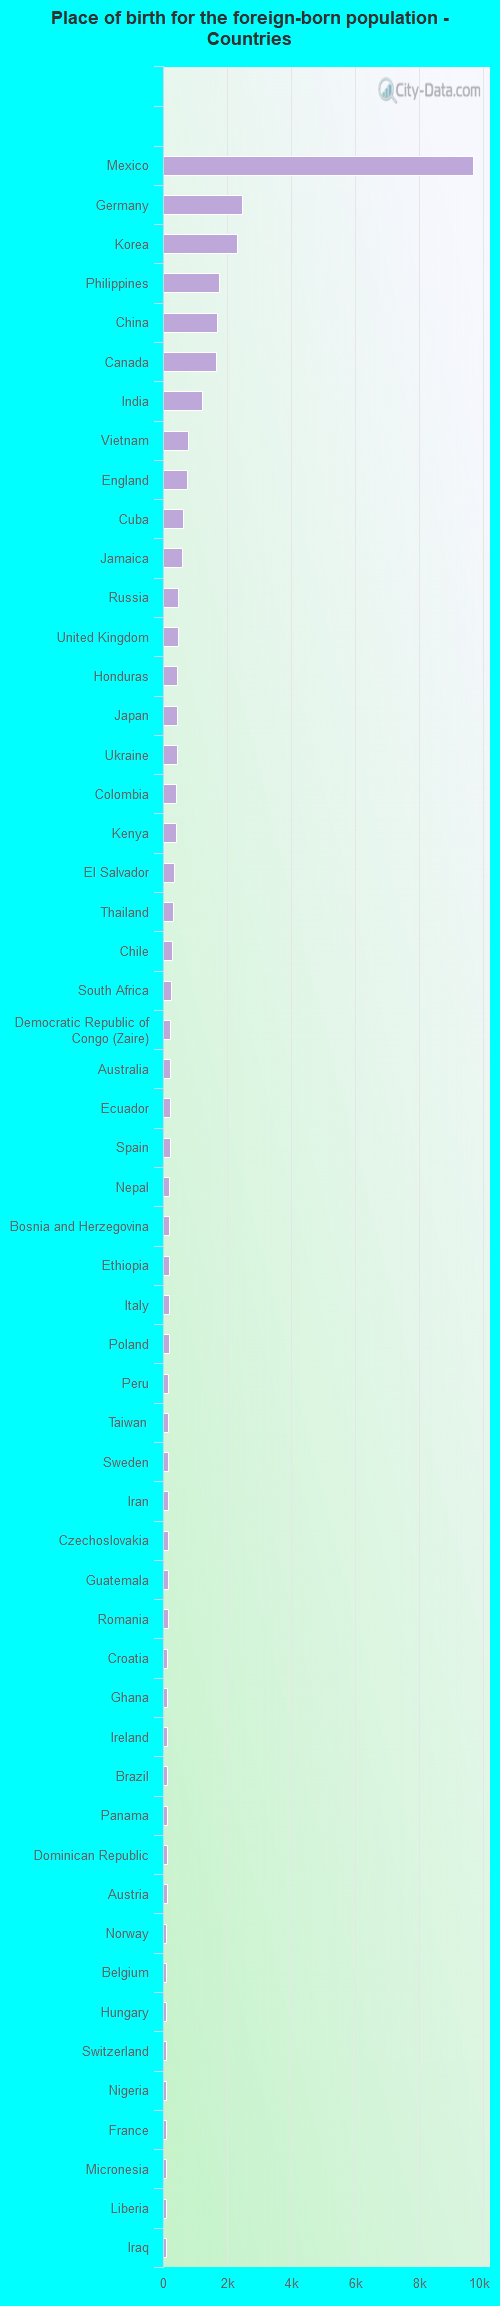
Place of birth for residents in Colorado Springs 15,592 Americas13,924 Latin America10,887 Central America10,033 Asia7,196 Europe4,701 Eastern Asia3,090 South Eastern Asia2,959 Western Europe2,047 Africa2,025 Eastern Europe1,927 China1,767 South Central Asia1,725 Northern Europe1,668 Northern America1,571 Caribbean1,465 South America832 Eastern Africa473 Southern Europe464 Western Asia444 Western Africa438 Oceania322 Middle Africa280 Australia and New Zealand Subregion246 Southern Africa174 Northern Africa9,689 Mexico2,466 Germany2,323 Korea1,739 Philippines1,689 China1,668 Canada1,225 India795 Vietnam750 England634 Cuba595 Jamaica467 Russia466 United Kingdom452 Honduras451 Japan443 Ukraine409 Colombia397 Kenya354 El Salvador307 Thailand294 Chile246 South Africa225 Democratic Republic of Congo (Zaire)212 Australia211 Ecuador203 Spain201 Nepal198 Bosnia and Herzegovina190 Ethiopia189 Italy188 Poland169 Peru169 Taiwan159 Sweden155 Iran154 Czechoslovakia147 Guatemala142 Romania129 Croatia123 Ghana123 Ireland122 Brazil122 Panama120 Dominican Republic115 Austria105 Norway103 Belgium102 Hungary101 Switzerland99 Nigeria95 France92 Micronesia91 Liberia91 Iraq85 Lebanon84 Israel83 Pakistan81 Cameroon77 Venezuela75 Netherlands69 Sudan69 Bolivia68 Argentina68 Hong Kong67 New Zealand63 Greece62 Cambodia60 Denmark59 Zimbabwe59 Turkey53 Trinidad and Tobago49 Jordan47 Morocco47 Costa Rica46 Haiti44 Kazakhstan42 Malaysia42 Nicaragua41 Burma39 Singapore36 Laos35 Guyana34 Lithuania34 Somalia31 Belize31 Serbia30 Scotland30 Bahamas27 Barbados26 Indonesia25 Belarus25 St. Vincent and the Grenadines24 Saudi Arabia21 Syria20 Uganda19 Uzbekistan17 West Indies17 Portugal16 Bulgaria16 Senegal16 Egypt15 Congo15 Afghanistan12 Latvia11 Sri Lanka10 Eritrea10 Dominica7 Uruguay
Grandparents responsible for own grandchildren in Colorado Springs
Grandparents (30 to 59 years) White / Caucasian 490 32.6% Responsible for grandchildren1,015 67.4% Not responsible for grandchildrenBlack or African American 90 29.7% Responsible for grandchildren213 70.3% Not responsible for grandchildrenAmerican Indian / Alaska Native 48 37.4% Responsible for grandchildren80 62.6% Not responsible for grandchildrenAsian 55 100.0% Not responsible for grandchildrenNative Hawaiian / Pacific Islander 7 15.9% Responsible for grandchildren37 84.1% Not responsible for grandchildrenOther race 155 41.6% Responsible for grandchildren218 58.4% Not responsible for grandchildrenTwo or more races 330 27.3% Responsible for grandchildren879 72.7% Not responsible for grandchildrenWhite alone, not Hispanic / Latino 552 32.7% Responsible for grandchildren1,133 67.3% Not responsible for grandchildrenHispanic or Latino 489 48.8% Responsible for grandchildren513 51.2% Not responsible for grandchildrenGrandparents (60 years and over) White / Caucasian 833 24.1% Responsible for grandchildren2,625 75.9% Not responsible for grandchildrenBlack or African American 59 34.1% Responsible for grandchildren114 65.9% Not responsible for grandchildrenAmerican Indian / Alaska Native 23 32.0% Responsible for grandchildren49 68.0% Not responsible for grandchildrenAsian 27 10.6% Responsible for grandchildren229 89.4% Not responsible for grandchildrenNative Hawaiian / Pacific Islander 5 28.5% Responsible for grandchildren12 71.5% Not responsible for grandchildrenOther race 93 46.6% Responsible for grandchildren107 53.4% Not responsible for grandchildrenTwo or more races 131 55.3% Responsible for grandchildren106 44.7% Not responsible for grandchildrenWhite alone, not Hispanic / Latino 790 21.1% Responsible for grandchildren2,951 78.9% Not responsible for grandchildrenHispanic or Latino 212 39.9% Responsible for grandchildren318 60.1% Not responsible for grandchildren
Zip codes: 80829 , 80831 , 80903 , 80904 , 80905 , 80906 , 80907 , 80909 , 80910 , 80911 , 80914 , 80917 , 80918 , 80919 , 80920 , 80923 , 80924 , 80925 , 80926 , 80927 , 80951 .