Races in Conway, Arkansas (AR) Detailed Stats
Data:
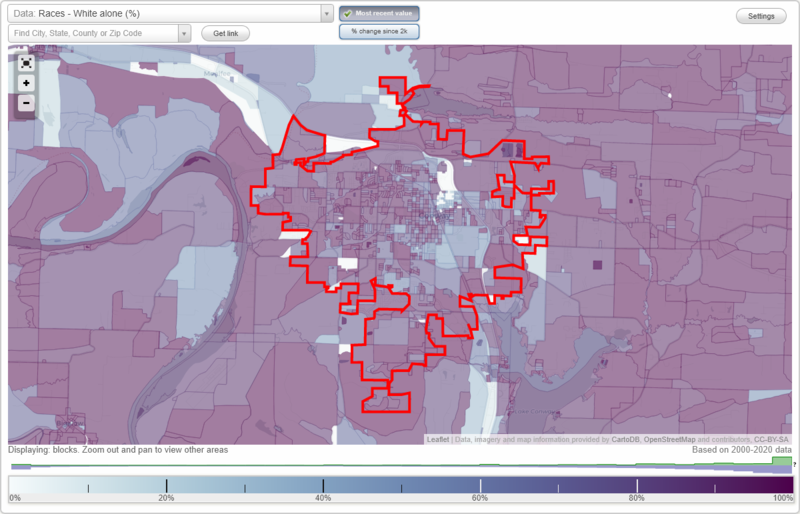
Races - White alone (%)
Races - White alone (% change since 2000)
Races - Black alone (%)
Races - Black alone (% change since 2000)
Races - American Indian alone (%)
Races - American Indian alone (% change since 2000)
Races - Asian alone (%)
Races - Asian alone (% change since 2000)
Races - Hispanic (%)
Races - Hispanic (% change since 2000)
Races - Native Hawaiian and Other Pacific Islander alone (%)
Races - Native Hawaiian and Other Pacific Islander alone (% change since 2000)
Races - Two or more races(%)
Races - Two or more races(% change since 2000)
Races - Other race alone (%)
Races - Other race alone (% change since 2000)
Racial diversity
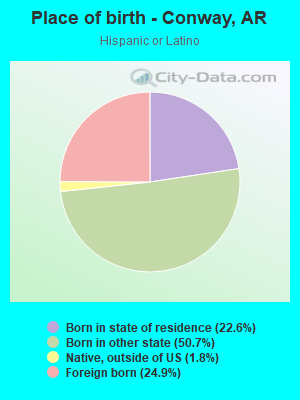
Place of birth - Born in state of residence (%)
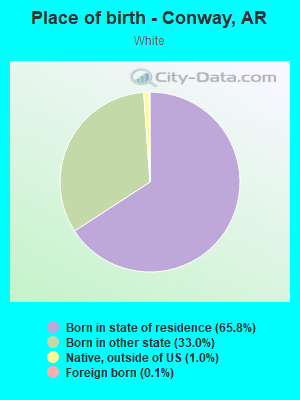
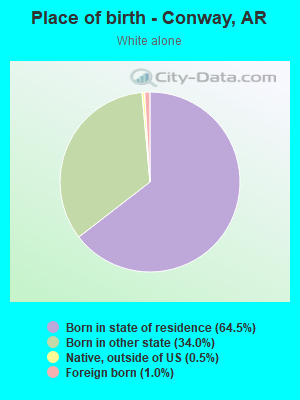
Place of birth - Born in state of residence (%) - White
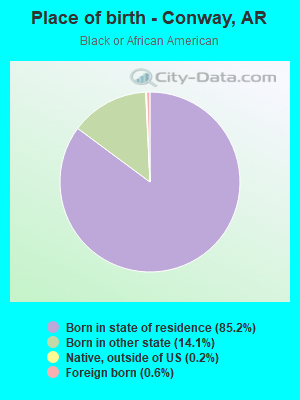
Place of birth - Born in state of residence (%) - Black or African American
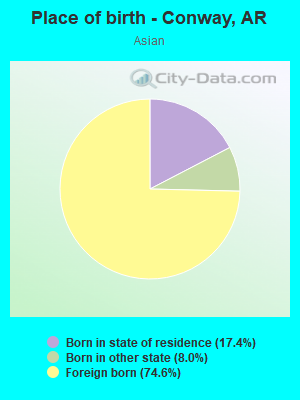
Place of birth - Born in state of residence (%) - Asian
Place of birth - Born in state of residence (%) - Hispanic or Latino
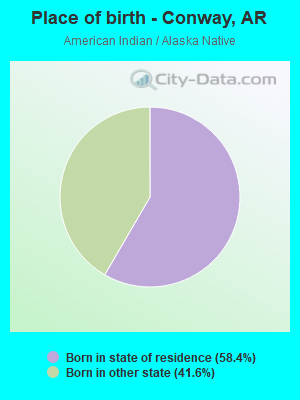
Place of birth - Born in state of residence (%) - American Indian and Alaska Native
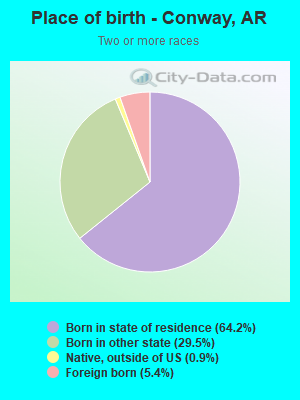
Place of birth - Born in state of residence (%) - Multirace
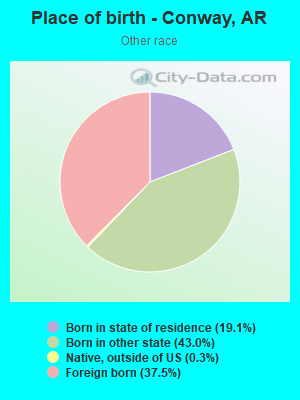
Place of birth - Born in state of residence (%) - Other Race
Place of birth - Born in other state (%)
Place of birth - Born in other state (%) - White
Place of birth - Born in other state (%) - Black or African American
Place of birth - Born in other state (%) - Asian
Place of birth - Born in other state (%) - Hispanic or Latino
Place of birth - Born in other state (%) - American Indian and Alaska Native
Place of birth - Born in other state (%) - Multirace
Place of birth - Born in other state (%) - Other Race
Place of birth - Native, outside of US (%)
Place of birth - Native, outside of US (%) - White
Place of birth - Native, outside of US (%) - Black or African American
Place of birth - Native, outside of US (%) - Asian
Place of birth - Native, outside of US (%) - Hispanic or Latino
Place of birth - Native, outside of US (%) - American Indian and Alaska Native
Place of birth - Native, outside of US (%) - Multirace
Place of birth - Native, outside of US (%) - Other Race
Place of birth - Foreign born (%)
Place of birth - Foreign born (%) - White
Place of birth - Foreign born (%) - Black or African American
Place of birth - Foreign born (%) - Asian
Place of birth - Foreign born (%) - Hispanic or Latino
Place of birth - Foreign born (%) - American Indian and Alaska Native
Place of birth - Foreign born (%) - Multirace
Place of birth - Foreign born (%) - Other Race
Residents speaking English at home (%)
Residents speaking English at home - Born in the United States (%)
Residents speaking English at home - Native, born elsewhere (%)
Residents speaking English at home - Foreign born (%)
Residents speaking Spanish at home (%)
Residents speaking Spanish at home - Born in the United States (%)
Residents speaking Spanish at home - Native, born elsewhere (%)
Residents speaking Spanish at home - Foreign born (%)
Residents speaking other language at home (%)
Residents speaking other language at home - Born in the United States (%)
Residents speaking other language at home - Native, born elsewhere (%)
Residents speaking other language at home - Foreign born (%)
Marital status - Never married (%)
Marital status - Now married (%)
Marital status - Separated (%)
Marital status - Widowed (%)
Marital status - Divorced (%)
Ancestries Reported - Arab (%)
Ancestries Reported - Czech (%)
Ancestries Reported - Danish (%)
Ancestries Reported - Dutch (%)
Ancestries Reported - English (%)
Ancestries Reported - French (%)
Ancestries Reported - French Canadian (%)
Ancestries Reported - German (%)
Ancestries Reported - Greek (%)
Ancestries Reported - Hungarian (%)
Ancestries Reported - Irish (%)
Ancestries Reported - Italian (%)
Ancestries Reported - Lithuanian (%)
Ancestries Reported - Norwegian (%)
Ancestries Reported - Polish (%)
Ancestries Reported - Portuguese (%)
Ancestries Reported - Russian (%)
Ancestries Reported - Scotch-Irish (%)
Ancestries Reported - Scottish (%)
Ancestries Reported - Slovak (%)
Ancestries Reported - Subsaharan African (%)
Ancestries Reported - Swedish (%)
Ancestries Reported - Swiss (%)
Ancestries Reported - Ukrainian (%)
Ancestries Reported - United States (%)
Ancestries Reported - Welsh (%)
Ancestries Reported - West Indian (%)
Ancestries Reported - Other (%)
Geographical mobility - Same house 1 year ago (%)
Geographical mobility - Same house 1 year ago (%) - White
Geographical mobility - Same house 1 year ago (%) - Black or African American
Geographical mobility - Same house 1 year ago (%) - Asian
Geographical mobility - Same house 1 year ago (%) - Hispanic or Latino
Geographical mobility - Same house 1 year ago (%) - American Indian and Alaska Native
Geographical mobility - Same house 1 year ago (%) - Multirace
Geographical mobility - Same house 1 year ago (%) - Other Race
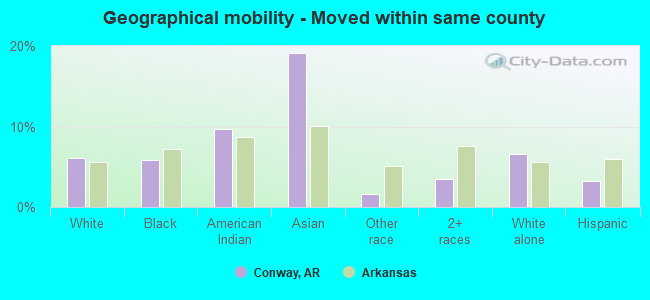
Geographical mobility - Moved within same county (%)
Geographical mobility - Moved within same county (%) - White
Geographical mobility - Moved within same county (%) - Black or African American
Geographical mobility - Moved within same county (%) - Asian
Geographical mobility - Moved within same county (%) - Hispanic or Latino
Geographical mobility - Moved within same county (%) - American Indian and Alaska Native
Geographical mobility - Moved within same county (%) - Multirace
Geographical mobility - Moved within same county (%) - Other Race
Geographical mobility - Moved from different county within same state (%)
Geographical mobility - Moved from different county within same state (%) - White
Geographical mobility - Moved from different county within same state (%) - Black or African American
Geographical mobility - Moved from different county within same state (%) - Asian
Geographical mobility - Moved from different county within same state (%) - Hispanic or Latino
Geographical mobility - Moved from different county within same state (%) - American Indian and Alaska Native
Geographical mobility - Moved from different county within same state (%) - Multirace
Geographical mobility - Moved from different county within same state (%) - Other Race
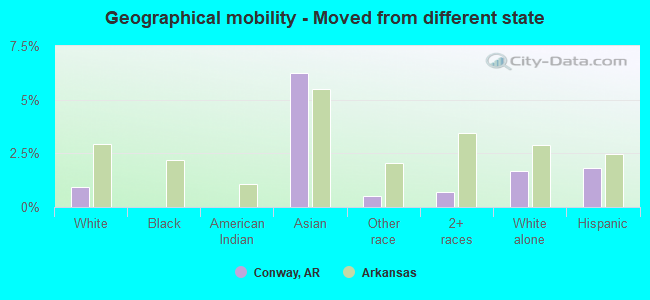
Geographical mobility - Moved from different state (%)
Geographical mobility - Moved from different state (%) - White
Geographical mobility - Moved from different state (%) - Black or African American
Geographical mobility - Moved from different state (%) - Asian
Geographical mobility - Moved from different state (%) - Hispanic or Latino
Geographical mobility - Moved from different state (%) - American Indian and Alaska Native
Geographical mobility - Moved from different state (%) - Multirace
Geographical mobility - Moved from different state (%) - Other Race
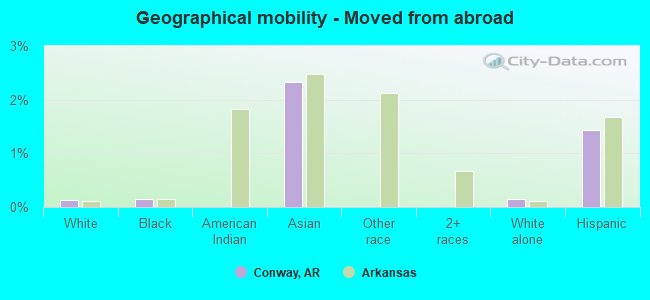
Geographical mobility - Moved from abroad (%)
Geographical mobility - Moved from abroad (%) - White
Geographical mobility - Moved from abroad (%) - Black or African American
Geographical mobility - Moved from abroad (%) - Asian
Geographical mobility - Moved from abroad (%) - Hispanic or Latino
Geographical mobility - Moved from abroad (%) - American Indian and Alaska Native
Geographical mobility - Moved from abroad (%) - Multirace
Geographical mobility - Moved from abroad (%) - Other Race
Place of birth for the foreign-born population - Ireland (%)
Place of birth for the foreign-born population - Denmark (%)
Place of birth for the foreign-born population - Norway (%)
Place of birth for the foreign-born population - Sweden (%)
Place of birth for the foreign-born population - United Kingdom (%)
Place of birth for the foreign-born population - England (%)
Place of birth for the foreign-born population - Scotland (%)
Place of birth for the foreign-born population - Other Northern Europe (%)
Place of birth for the foreign-born population - Austria (%)
Place of birth for the foreign-born population - Belgium (%)
Place of birth for the foreign-born population - France (%)
Place of birth for the foreign-born population - Germany (%)
Place of birth for the foreign-born population - Netherlands (%)
Place of birth for the foreign-born population - Switzerland (%)
Place of birth for the foreign-born population - Other Western Europe (%)
Place of birth for the foreign-born population - Greece (%)
Place of birth for the foreign-born population - Italy (%)
Place of birth for the foreign-born population - Portugal (%)
Place of birth for the foreign-born population - Spain (%)
Place of birth for the foreign-born population - Other Southern Europe (%)
Place of birth for the foreign-born population - Albania (%)
Place of birth for the foreign-born population - Belarus (%)
Place of birth for the foreign-born population - Bosnia and Herzegovina (%)
Place of birth for the foreign-born population - Bulgaria (%)
Place of birth for the foreign-born population - Croatia (%)
Place of birth for the foreign-born population - Czechoslovakia (%)
Place of birth for the foreign-born population - Hungary (%)
Place of birth for the foreign-born population - Latvia (%)
Place of birth for the foreign-born population - Lithuania (%)
Place of birth for the foreign-born population - North Macedonia (Macedonia) (%)
Place of birth for the foreign-born population - Moldova (%)
Place of birth for the foreign-born population - Poland (%)
Place of birth for the foreign-born population - Romania (%)
Place of birth for the foreign-born population - Russia (%)
Place of birth for the foreign-born population - Serbia (%)
Place of birth for the foreign-born population - Ukraine (%)
Place of birth for the foreign-born population - Other Eastern Europe (%)
Place of birth for the foreign-born population - China (%)
Place of birth for the foreign-born population - Hong Kong (%)
Place of birth for the foreign-born population - Taiwan (%)
Place of birth for the foreign-born population - Japan (%)
Place of birth for the foreign-born population - Korea (%)
Place of birth for the foreign-born population - Other Eastern Asia (%)
Place of birth for the foreign-born population - Afghanistan (%)
Place of birth for the foreign-born population - Bangladesh (%)
Place of birth for the foreign-born population - India (%)
Place of birth for the foreign-born population - Iran (%)
Place of birth for the foreign-born population - Kazakhstan (%)
Place of birth for the foreign-born population - Nepal (%)
Place of birth for the foreign-born population - Pakistan (%)
Place of birth for the foreign-born population - Sri Lanka (%)
Place of birth for the foreign-born population - Uzbekistan (%)
Place of birth for the foreign-born population - Other South Central Asia (%)
Place of birth for the foreign-born population - Burma (%)
Place of birth for the foreign-born population - Cambodia (%)
Place of birth for the foreign-born population - Indonesia (%)
Place of birth for the foreign-born population - Laos (%)
Place of birth for the foreign-born population - Malaysia (%)
Place of birth for the foreign-born population - Philippines (%)
Place of birth for the foreign-born population - Singapore (%)
Place of birth for the foreign-born population - Thailand (%)
Place of birth for the foreign-born population - Vietnam (%)
Place of birth for the foreign-born population - Other South Eastern Asia (%)
Place of birth for the foreign-born population - Armenia (%)
Place of birth for the foreign-born population - Iraq (%)
Place of birth for the foreign-born population - Israel (%)
Place of birth for the foreign-born population - Jordan (%)
Place of birth for the foreign-born population - Kuwait (%)
Place of birth for the foreign-born population - Lebanon (%)
Place of birth for the foreign-born population - Saudi Arabia (%)
Place of birth for the foreign-born population - Syria (%)
Place of birth for the foreign-born population - Turkey (%)
Place of birth for the foreign-born population - Yemen (%)
Place of birth for the foreign-born population - Other Western Asia (%)
Place of birth for the foreign-born population - Eritrea (%)
Place of birth for the foreign-born population - Ethiopia (%)
Place of birth for the foreign-born population - Kenya (%)
Place of birth for the foreign-born population - Somalia (%)
Place of birth for the foreign-born population - Uganda (%)
Place of birth for the foreign-born population - Zimbabwe (%)
Place of birth for the foreign-born population - Other Eastern Africa (%)
Place of birth for the foreign-born population - Cameroon (%)
Place of birth for the foreign-born population - Congo (%)
Place of birth for the foreign-born population - Democratic Republic of Congo (Zaire) (%)
Place of birth for the foreign-born population - Other Middle Africa (%)
Place of birth for the foreign-born population - Egypt (%)
Place of birth for the foreign-born population - Morocco (%)
Place of birth for the foreign-born population - Sudan (%)
Place of birth for the foreign-born population - Other Northern Africa (%)
Place of birth for the foreign-born population - South Africa (%)
Place of birth for the foreign-born population - Other Southern Africa (%)
Place of birth for the foreign-born population - Cabo Verde (%)
Place of birth for the foreign-born population - Ghana (%)
Place of birth for the foreign-born population - Liberia (%)
Place of birth for the foreign-born population - Nigeria (%)
Place of birth for the foreign-born population - Senegal (%)
Place of birth for the foreign-born population - Sierra Leone (%)
Place of birth for the foreign-born population - Other Western Africa (%)
Place of birth for the foreign-born population - Australia (%)
Place of birth for the foreign-born population - New Zealand (%)
Place of birth for the foreign-born population - Fiji (%)
Place of birth for the foreign-born population - Micronesia (%)
Place of birth for the foreign-born population - Bahamas (%)
Place of birth for the foreign-born population - Barbados (%)
Place of birth for the foreign-born population - Cuba (%)
Place of birth for the foreign-born population - Dominica (%)
Place of birth for the foreign-born population - Dominican Republic (%)
Place of birth for the foreign-born population - Grenada (%)
Place of birth for the foreign-born population - Haiti (%)
Place of birth for the foreign-born population - Jamaica (%)
Place of birth for the foreign-born population - St. Vincent and the Grenadines (%)
Place of birth for the foreign-born population - Trinidad and Tobago (%)
Place of birth for the foreign-born population - West Indies (%)
Place of birth for the foreign-born population - Other Caribbean (%)
Place of birth for the foreign-born population - Belize (%)
Place of birth for the foreign-born population - Costa Rica (%)
Place of birth for the foreign-born population - El Salvador (%)
Place of birth for the foreign-born population - Guatemala (%)
Place of birth for the foreign-born population - Honduras (%)
Place of birth for the foreign-born population - Mexico (%)
Place of birth for the foreign-born population - Nicaragua (%)
Place of birth for the foreign-born population - Panama (%)
Place of birth for the foreign-born population - Other Central America (%)
Place of birth for the foreign-born population - Argentina (%)
Place of birth for the foreign-born population - Bolivia (%)
Place of birth for the foreign-born population - Brazil (%)
Place of birth for the foreign-born population - Chile (%)
Place of birth for the foreign-born population - Colombia (%)
Place of birth for the foreign-born population - Ecuador (%)
Place of birth for the foreign-born population - Guyana (%)
Place of birth for the foreign-born population - Peru (%)
Place of birth for the foreign-born population - Uruguay (%)
Place of birth for the foreign-born population - Venezuela (%)
Place of birth for the foreign-born population - Other South America (%)
Place of birth for the foreign-born population - Canada (%)
Place of birth for the foreign-born population - Other Northern America (%)
Place of birth for the foreign-born population - Other (%)
Latest news about races in Conway, AR collected exclusively by city-data.com from local newspapers, TV, and radio stations
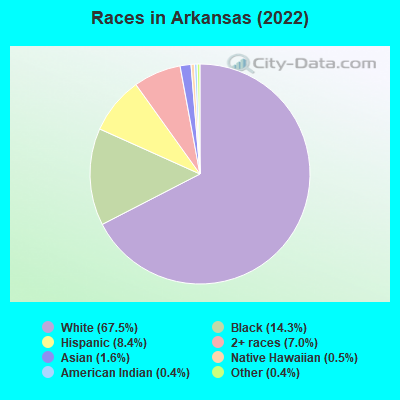
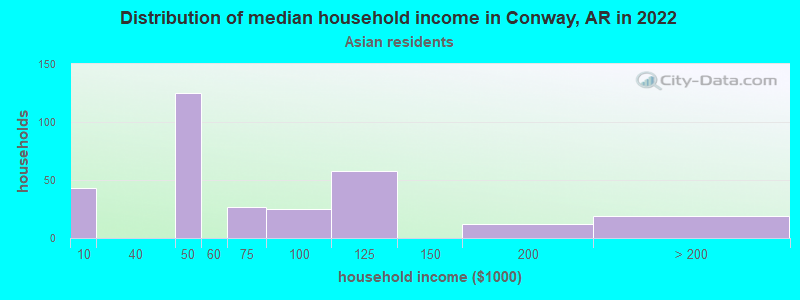
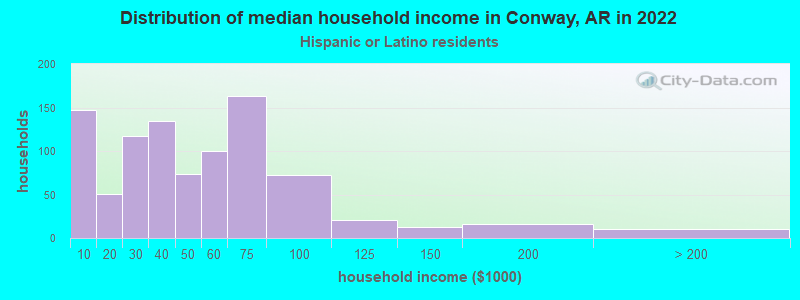
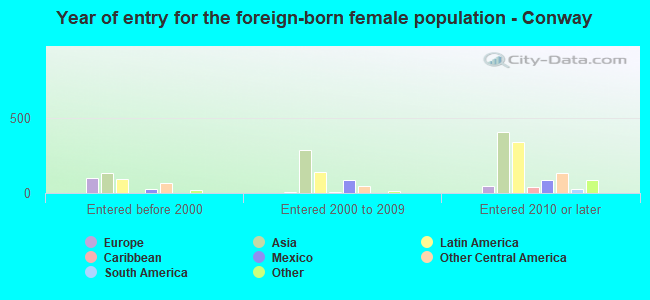
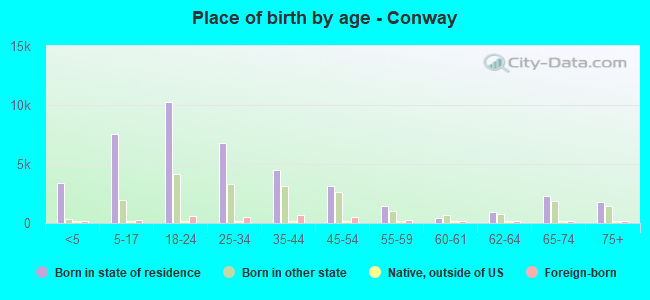
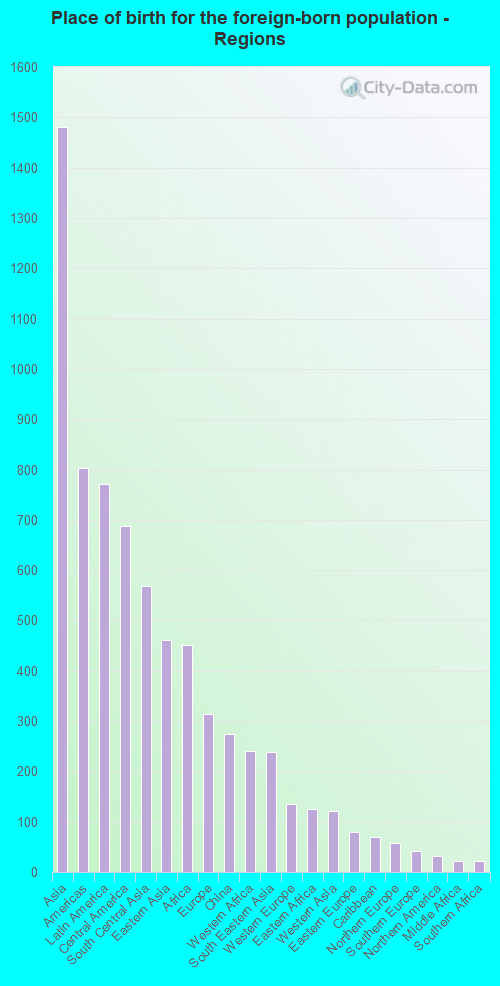
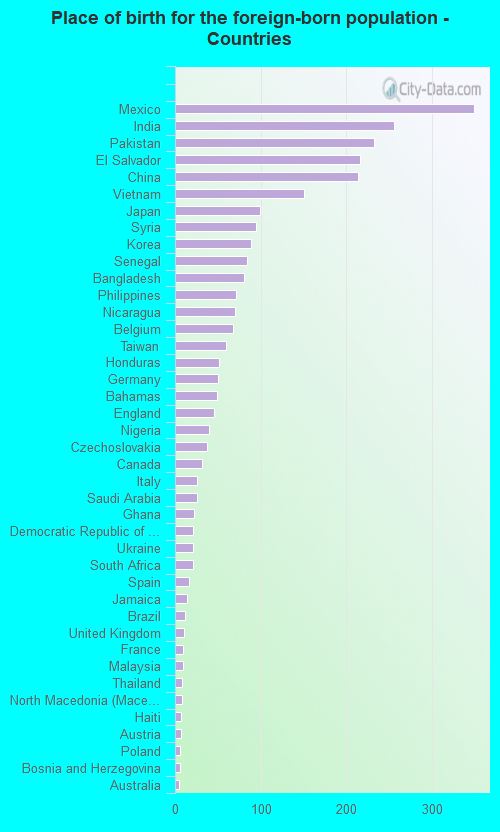
According to 2022 data, the most numerous races in Conway, AR are White alone (46,531 residents), Black alone (11,538 residents), and Hispanic (3,204 residents). 92.8% of Conway residents speak English at home. 4.5% of Conway, AR residents are foreign-born (2.1% born in Asia, 1.1% born in Latin America, 0.7% born in Africa, 0.5% born in Europe), which is 11.3% greater than the foreign-born rate of 4.0% across the entire state of Arkansas.
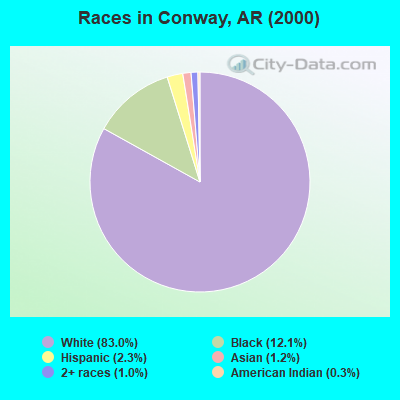
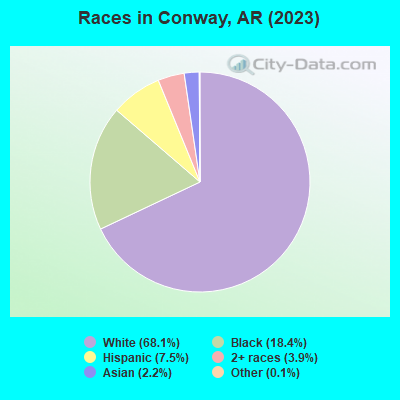
Race distribution in Conway
2000 2022
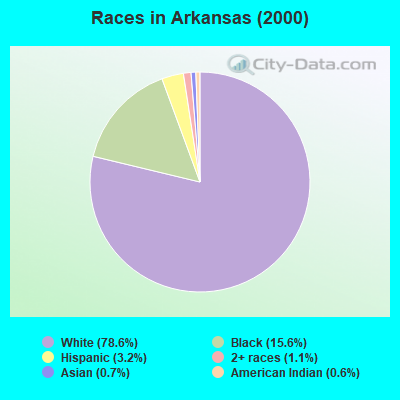
2,100,135 78.6% White alone 416,615 15.6% Black alone 86,866 3.2% Hispanic 30,364 1.1% Two or more races 19,892 0.7% Asian alone 16,702 0.6% American Indian alone 1,494 0.06% Native Hawaiian and Other 1,332 0.05% Other race alone
2,054,922 67.5% White alone 435,637 14.3% Black alone 255,416 8.4% Hispanic 213,684 7.0% Two or more races 47,592 1.6% Asian alone 14,176 0.5% Native Hawaiian and Other 12,680 0.4% American Indian alone 11,530 0.4% Other race alone
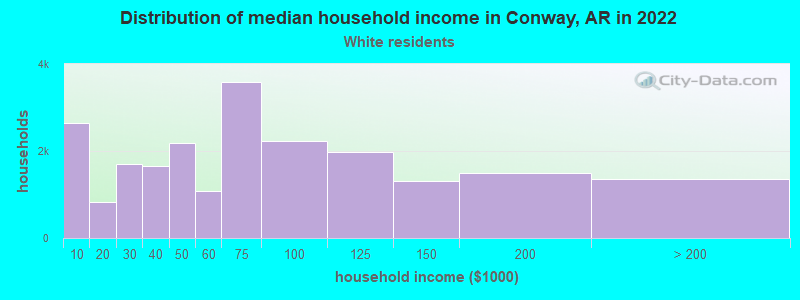
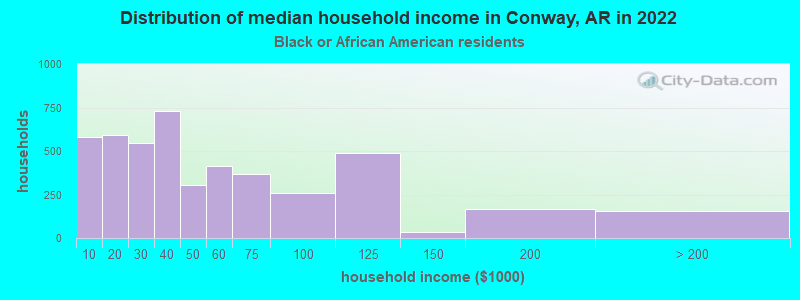
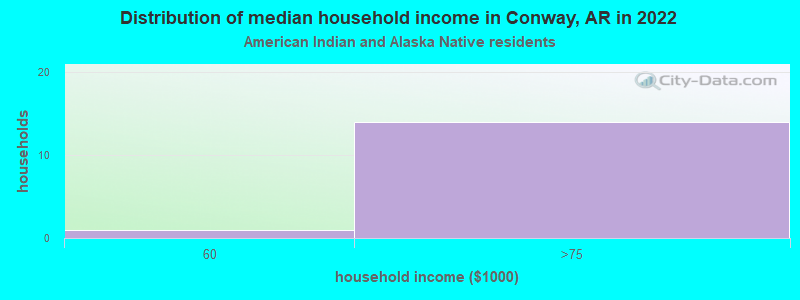
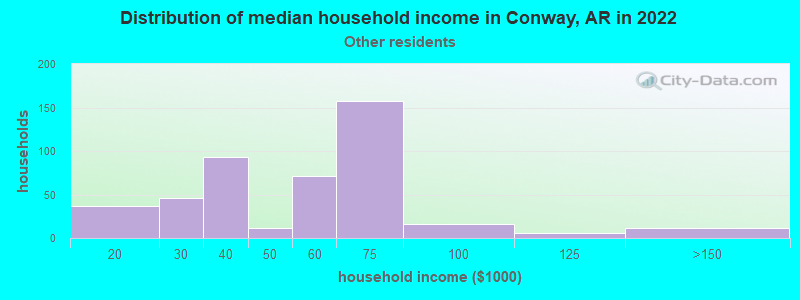
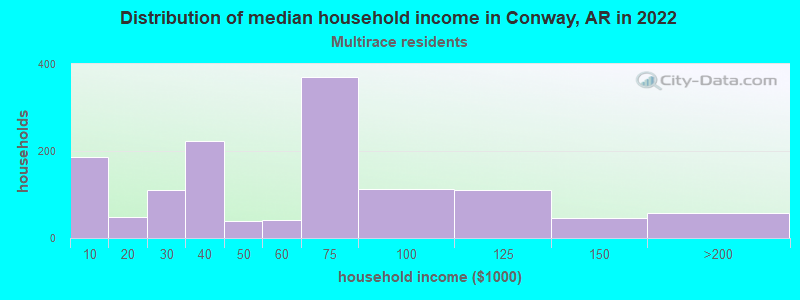
Income and house value in Conway Median household income in 2022 $65,695 White non-Hispanic householders$37,730 Black householders$19,001 American Indian and Alaska Native householders$88,094 Asian householders$43,034 Some other race householders$29,623 Two or more races householders$72,436 Hispanic or Latino race householdersMedian 2022 house value $270,233 White Non-Hispanic householders$213,412 Black or African American householders$254,761 American Indian or Alaska Native householders $264,097 Asian householders$146,721 Some other race householders$271,300 Two or more races householders$180,867 Hispanic or Latino householders
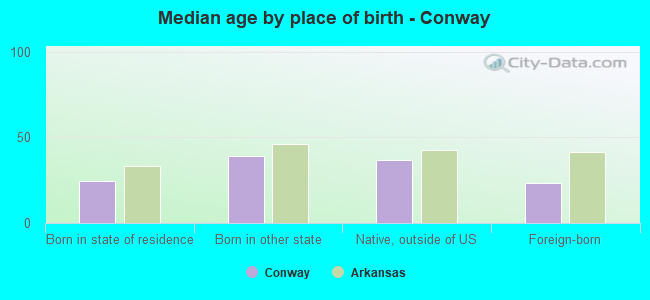
Median age by race in Conway
31.8 Median age for White residents29.9 34.2 24.0 Median age for Black or African American residents23.2 31.1 47.2 Median age for American Indian / Alaska Native residents62.5 47.4 25.8 Median age for Asian residents26.4 25.9 23.1 Median age for Other race residents22.7 Median age for Two or more races residents19.5 26.2 31.7 Median age for White alone residents30.2 34.4 21.7 Median age for Hispanic or Latino residents21.2 23.7
Owner/renter occupied households by race in Conway
House owners and renters - White residents 10,464 51.0% Owner occupied10,037 49.0% Renter occupiedHouse owners and renters - Black or African American residents 766 17.4% Owner occupied3,644 82.6% Renter occupiedHouse owners and renters - American Indian / Alaska Native residents 26 100.0% Owner occupiedHouse owners and renters - Asian residents 138 34.7% Owner occupied259 65.3% Renter occupiedHouse owners and renters - Other race residents 114 25.6% Owner occupied331 74.4% Renter occupiedHouse owners and renters - Two or more races residents 323 33.6% Owner occupied637 66.4% Renter occupiedHouse owners and renters - White alone residents 10,376 51.2% Owner occupied9,880 48.8% Renter occupiedHouse owners and renters - Hispanic or Latino residents 437 48.8% Owner occupied459 51.2% Renter occupied
Language usage in Conway
English speakers - Total 92.8% of residents of Conway speak English at home.
2.8% of residents speak Spanish at home 1,182 67.2% Speak English very well576 32.8% Speak English less than very well4.4% of residents speak other language at home 2,168 77.7% Speak English very well624 22.3% Speak English less than very well
English speakers - Born in the United States 94.7% of residents of Conway speak English at home.
3.3% of residents speak Spanish at home 641 92.2% Speak English very well54 7.8% Speak English less than very well1.9% of residents speak other language at home 314 77.3% Speak English very well92 22.7% Speak English less than very well
English speakers - Native, born elsewhere 85.7% of residents of Conway speak English at home.
7.6% of residents speak Spanish at home 15 60.0% Speak English very well10 40.0% Speak English less than very well4.9% of residents speak other language at home 16 100.0% Speak English very well
English speakers - Foreign-born 14.2% of residents of Conway speak English at home.
23.9% of residents speak Spanish at home 262 35.9% Speak English very well467 64.1% Speak English less than very well64.0% of residents speak other language at home 1,421 72.7% Speak English very well533 27.3% Speak English less than very well
White (Caucasian) - Speak only English Native:
98.5% (44,087)Foreign-born:
30.8% (150)
White (Caucasian) - Speak another language Native:
1.6% (695)Foreign-born:
69.0% (337)
Black or African American - Speak only English Native:
98.3% (10,320)Foreign-born:
9.7% (46)
Black or African American - Speak another language Native:
1.7% (181)Foreign-born:
100.0% (480)
Asian - Speak only English Native:
33.7% (100)Foreign-born:
11.9% (145)
Asian - Speak another language Native:
61.9% (184)Foreign-born:
87.1% (1,060)
Other race - Speak only English Native:
56.5% (481)Foreign-born:
6.9% (45)
Other race - Speak another language Native:
48.9% (417)Foreign-born:
90.9% (600)
Two or more races - Speak only English Native:
88.4% (3,478)Foreign-born:
59.2% (154)
Two or more races - Speak another language Native:
12.7% (498)Foreign-born:
58.1% (151)
White alone - Speak only English Native:
98.7% (43,385)Foreign-born:
45.2% (165)
White alone - Speak another language Native:
1.3% (578)Foreign-born:
50.3% (184)
Hispanic or Latino - Speak only English Native:
77.1% (2,042)Foreign-born:
5.9% (41)
Hispanic or Latino - Speak another language Native:
27.5% (729)Foreign-born:
96.2% (670)
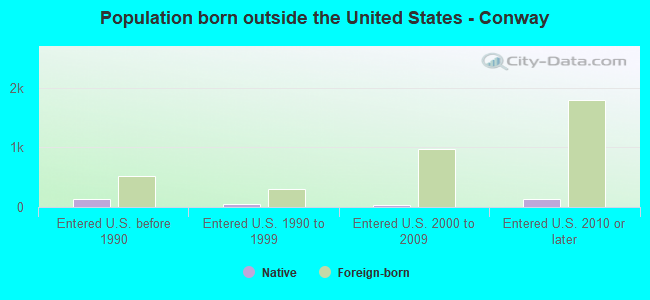
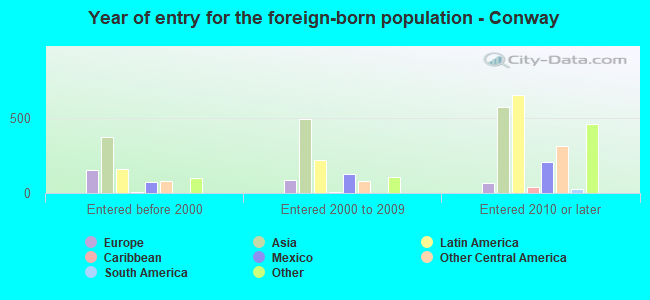
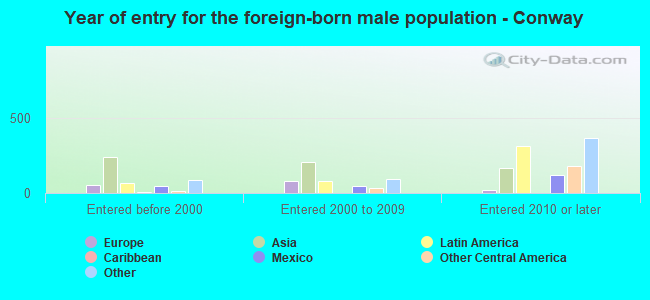
Foreign-born residents in Conway 3,058 residents are foreign born (2.1% Asia , 1.1% Latin America , 0.7% Africa , 0.5% Europe ).
This city:
4.5%Arkansas:
100.0%
Marital status for residents in Conway Marital status - White (Caucasian) population 15 years and over
Males 45.6% Never married42.5% Now married0.5% Separated0.3% Widowed11.1% DivorcedFemales 38.4% Never married35.2% Now married3.0% Separated9.6% Widowed13.8% DivorcedWomen who gave birth in the past 12 months Now married:
63.3% (607)Unmarried:
36.7% (353)
Women who did not give birth in the past 12 months Now married:
31.9% (4,334)Unmarried:
68.1% (9,266)
Marital status - Black or African American population 15 years and over
Males 68.0% Never married19.0% Now married5.7% Separated0.4% Widowed7.0% DivorcedFemales 61.7% Never married16.7% Now married0.7% Separated12.8% Widowed8.1% DivorcedWomen who gave birth in the past 12 months Now married:
18.2% (26)Unmarried:
81.8% (119)
Women who did not give birth in the past 12 months Now married:
30.4% (1,174)Unmarried:
69.6% (2,690)
Marital status - American Indian / Alaska Native population 15 years and over
Males 36.1% Never married38.1% Now married25.8% Separated0.0% Widowed0.0% DivorcedFemales 29.7% Never married27.0% Now married0.0% Separated0.0% Widowed43.2% DivorcedWomen who did not give birth in the past 12 months Now married:
0.0% (0)Unmarried:
100.0% (21)
Marital status - Asian population 15 years and over
Males 49.9% Never married39.8% Now married0.0% Separated0.0% Widowed10.3% DivorcedFemales 36.7% Never married53.0% Now married0.0% Separated8.8% Widowed1.4% DivorcedWomen who gave birth in the past 12 months Now married:
100.0% (38)Unmarried:
0.0% (0)
Women who did not give birth in the past 12 months Now married:
50.8% (249)Unmarried:
49.2% (241)
Marital status - Other race population 15 years and over
Males 59.3% Never married36.5% Now married0.0% Separated2.3% Widowed2.0% DivorcedFemales 32.4% Never married56.5% Now married7.8% Separated0.0% Widowed3.3% DivorcedWomen who gave birth in the past 12 months Now married:
100.0% (137)Unmarried:
0.0% (0)
Women who did not give birth in the past 12 months Now married:
43.9% (171)Unmarried:
56.1% (219)
Marital status - Two or more races population 15 years and over
Males 77.4% Never married20.3% Now married0.0% Separated0.0% Widowed2.3% DivorcedFemales 61.6% Never married18.8% Now married0.0% Separated8.5% Widowed11.1% DivorcedWomen who gave birth in the past 12 months Now married:
66.7% (105)Unmarried:
33.3% (52)
Women who did not give birth in the past 12 months Now married:
9.9% (160)Unmarried:
90.1% (1,451)
Marital status - White alone, not Hispanic / Latino population 15 years and over
Males 46.0% Never married42.2% Now married0.5% Separated0.3% Widowed11.0% DivorcedFemales 37.8% Never married35.3% Now married3.0% Separated9.8% Widowed14.0% DivorcedWomen who gave birth in the past 12 months Now married:
63.3% (619)Unmarried:
36.7% (359)
Women who did not give birth in the past 12 months Now married:
32.0% (4,316)Unmarried:
68.0% (9,160)
Marital status - Hispanic or Latino population 15 years and over
Males 49.1% Never married33.3% Now married0.9% Separated3.2% Widowed13.5% DivorcedFemales 39.4% Never married40.0% Now married4.7% Separated4.2% Widowed11.7% DivorcedWomen who gave birth in the past 12 months Now married:
100.0% (71)Unmarried:
0.0% (0)
Women who did not give birth in the past 12 months Now married:
30.5% (221)Unmarried:
69.5% (503)
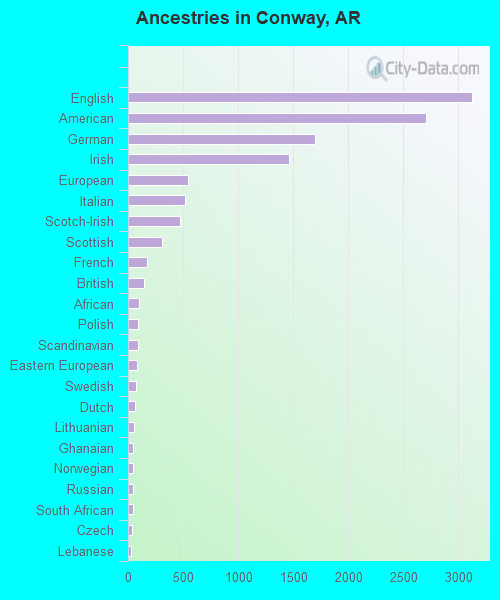
Ancestries in Conway
3,427 9.1% American2,121 5.6% English1,494 4.0% Irish1,425 3.8% German992 2.6% European572 1.5% African463 1.2% Scottish398 1.1% Italian304 0.8% Scotch-Irish276 0.7% Arab193 0.5% French164 0.4% Eastern European141 0.4% Swedish131 0.3% Polish109 0.3% Norwegian109 0.3% Nigerian108 0.3% Ghanaian87 0.2% Czech85 0.2% British71 0.2% French Canadian60 0.2% Dutch59 0.2% Scandinavian55 0.1% Hungarian52 0.1% Lithuanian48 0.1% Portuguese41 0.1% Welsh38 0.1% West Indian34 0.09% Jamaican27 0.07% Armenian25 0.07% Belgian20 0.05% Austrian19 0.05% Haitian18 0.05% South African17 0.05% Iranian15 0.04% Ukrainian14 0.04% Lebanese13 0.03% Brazilian11 0.03% Macedonian9 0.02% Slovak7 0.02% Greek5 0.01% Swiss4 0.01% Canadian2 0.01% Australian
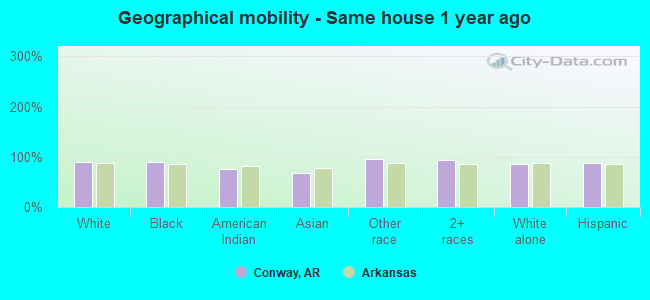
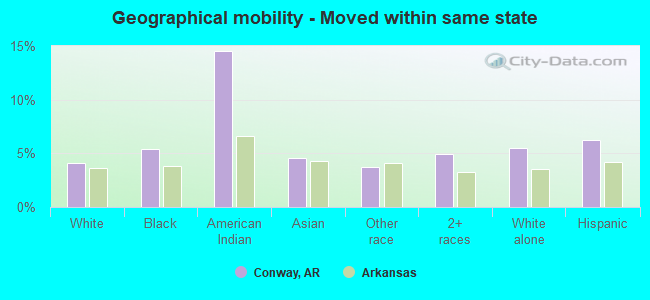
Geographical mobility in Conway Same house 1 year ago 43,258 88.8% White (Caucasian)10,821 90.0% Black or African American85 76.4% American Indian / Alaska Native1,092 68.4% Asian1,810 95.2% Other race4,646 93.6% Two or more races39,712 86.0% White alone, not Hispanic / Latino2,684 88.4% Hispanic or LatinoMoved within same county 2,981 6.1% White / Caucasian702 5.8% Black or African American11 9.7% American Indian / Alaska Native305 19.1% Asian32 1.7% Other race171 3.4% Two or more races3,047 6.6% White alone, not Hispanic / Latino97 3.2% Hispanic or LatinoMoved within same state 2,012 4.1% White / Caucasian654 5.4% Black or African American16 14.5% American Indian / Alaska Native73 4.6% Asian70 3.7% Other race244 4.9% Two or more races2,550 5.5% White alone, not Hispanic / Latino189 6.2% Hispanic or LatinoMoved from different state 461 0.9% White / Caucasian100 6.3% Asian9 0.5% Other race35 0.7% Two or more races768 1.7% White alone, not Hispanic / Latino55 1.8% Hispanic or LatinoMoved from abroad 60 0.1% White19 0.2% Black or African American37 2.3% Asian69 0.1% White alone, not Hispanic / Latino44 1.4% Hispanic or Latino
Children Nativity (place of birth) in Conway
Children under 6 years - Living with two parents Both parents native 2,820 100.0% NativeBoth parents foreign-born 263 94.3% Native16 5.7% Foreign-bornOne native, one foreign-born parent 61 100.0% NativeChildren under 6 years - Living with one parent Native parent 1,297 100.0% NativeForeign-born parent 12 100.0% NativeChildren 6 to 17 years - Living with two parents Both parents native 4,660 100.0% NativeBoth parents foreign-born 258 55.3% Native208 44.7% Foreign-bornOne native, one foreign-born parent 96 100.0% NativeChildren 6 to 17 years - Living with one parent Native parent 3,205 100.0% NativeForeign-born parent 117 55.1% Native95 44.9% Foreign-born
Grandparents responsible for own grandchildren in Conway
Grandparents (30 to 59 years) White / Caucasian 178 47.2% Responsible for grandchildren200 52.8% Not responsible for grandchildrenBlack or African American 26 73.4% Responsible for grandchildren10 26.6% Not responsible for grandchildrenWhite alone, not Hispanic / Latino 179 45.6% Responsible for grandchildren213 54.4% Not responsible for grandchildrenGrandparents (60 years and over) White / Caucasian 179 81.5% Responsible for grandchildren41 18.5% Not responsible for grandchildrenBlack or African American 19 65.5% Responsible for grandchildren10 34.5% Not responsible for grandchildrenWhite alone, not Hispanic / Latino 180 81.4% Responsible for grandchildren41 18.6% Not responsible for grandchildren