Races in Cookeville, Tennessee (TN) Detailed Stats
Data:
Races - White alone (%)
Races - White alone (% change since 2000)
Races - Black alone (%)
Races - Black alone (% change since 2000)
Races - American Indian alone (%)
Races - American Indian alone (% change since 2000)
Races - Asian alone (%)
Races - Asian alone (% change since 2000)
Races - Hispanic (%)
Races - Hispanic (% change since 2000)
Races - Native Hawaiian and Other Pacific Islander alone (%)
Races - Native Hawaiian and Other Pacific Islander alone (% change since 2000)
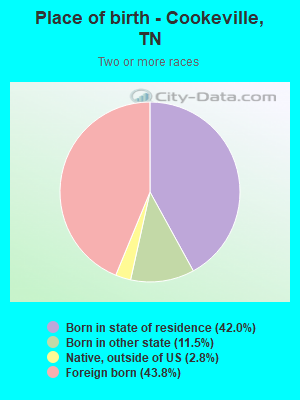
Races - Two or more races(%)
Races - Two or more races(% change since 2000)
Races - Other race alone (%)
Races - Other race alone (% change since 2000)
Racial diversity
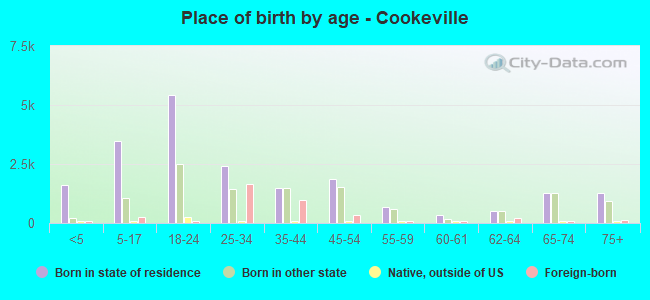
Place of birth - Born in state of residence (%)
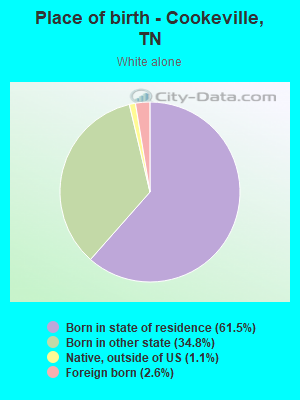
Place of birth - Born in state of residence (%) - White
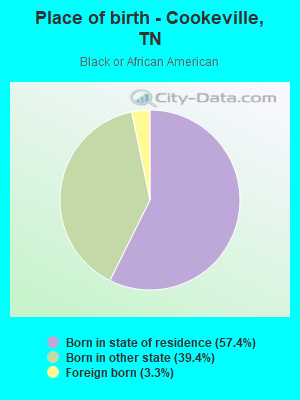
Place of birth - Born in state of residence (%) - Black or African American
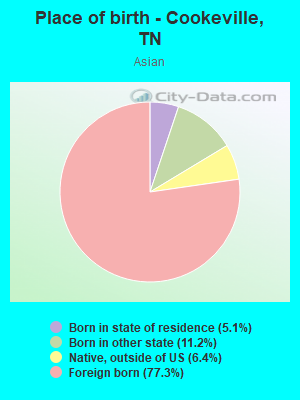
Place of birth - Born in state of residence (%) - Asian
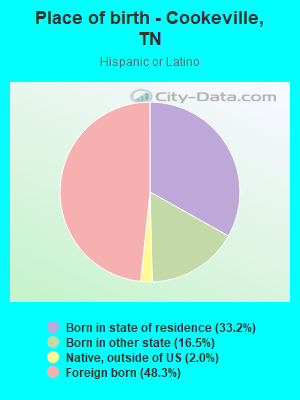
Place of birth - Born in state of residence (%) - Hispanic or Latino
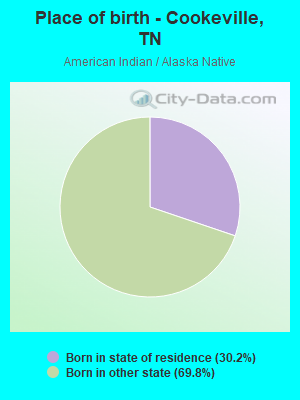
Place of birth - Born in state of residence (%) - American Indian and Alaska Native
Place of birth - Born in state of residence (%) - Multirace
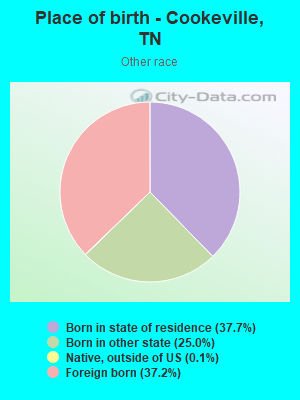
Place of birth - Born in state of residence (%) - Other Race
Place of birth - Born in other state (%)
Place of birth - Born in other state (%) - White
Place of birth - Born in other state (%) - Black or African American
Place of birth - Born in other state (%) - Asian
Place of birth - Born in other state (%) - Hispanic or Latino
Place of birth - Born in other state (%) - American Indian and Alaska Native
Place of birth - Born in other state (%) - Multirace
Place of birth - Born in other state (%) - Other Race
Place of birth - Native, outside of US (%)
Place of birth - Native, outside of US (%) - White
Place of birth - Native, outside of US (%) - Black or African American
Place of birth - Native, outside of US (%) - Asian
Place of birth - Native, outside of US (%) - Hispanic or Latino
Place of birth - Native, outside of US (%) - American Indian and Alaska Native
Place of birth - Native, outside of US (%) - Multirace
Place of birth - Native, outside of US (%) - Other Race
Place of birth - Foreign born (%)
Place of birth - Foreign born (%) - White
Place of birth - Foreign born (%) - Black or African American
Place of birth - Foreign born (%) - Asian
Place of birth - Foreign born (%) - Hispanic or Latino
Place of birth - Foreign born (%) - American Indian and Alaska Native
Place of birth - Foreign born (%) - Multirace
Place of birth - Foreign born (%) - Other Race
Residents speaking English at home (%)
Residents speaking English at home - Born in the United States (%)
Residents speaking English at home - Native, born elsewhere (%)
Residents speaking English at home - Foreign born (%)
Residents speaking Spanish at home (%)
Residents speaking Spanish at home - Born in the United States (%)
Residents speaking Spanish at home - Native, born elsewhere (%)
Residents speaking Spanish at home - Foreign born (%)
Residents speaking other language at home (%)
Residents speaking other language at home - Born in the United States (%)
Residents speaking other language at home - Native, born elsewhere (%)
Residents speaking other language at home - Foreign born (%)
Marital status - Never married (%)
Marital status - Now married (%)
Marital status - Separated (%)
Marital status - Widowed (%)
Marital status - Divorced (%)
Ancestries Reported - Arab (%)
Ancestries Reported - Czech (%)
Ancestries Reported - Danish (%)
Ancestries Reported - Dutch (%)
Ancestries Reported - English (%)
Ancestries Reported - French (%)
Ancestries Reported - French Canadian (%)
Ancestries Reported - German (%)
Ancestries Reported - Greek (%)
Ancestries Reported - Hungarian (%)
Ancestries Reported - Irish (%)
Ancestries Reported - Italian (%)
Ancestries Reported - Lithuanian (%)
Ancestries Reported - Norwegian (%)
Ancestries Reported - Polish (%)
Ancestries Reported - Portuguese (%)
Ancestries Reported - Russian (%)
Ancestries Reported - Scotch-Irish (%)
Ancestries Reported - Scottish (%)
Ancestries Reported - Slovak (%)
Ancestries Reported - Subsaharan African (%)
Ancestries Reported - Swedish (%)
Ancestries Reported - Swiss (%)
Ancestries Reported - Ukrainian (%)
Ancestries Reported - United States (%)
Ancestries Reported - Welsh (%)
Ancestries Reported - West Indian (%)
Ancestries Reported - Other (%)
Geographical mobility - Same house 1 year ago (%)
Geographical mobility - Same house 1 year ago (%) - White
Geographical mobility - Same house 1 year ago (%) - Black or African American
Geographical mobility - Same house 1 year ago (%) - Asian
Geographical mobility - Same house 1 year ago (%) - Hispanic or Latino
Geographical mobility - Same house 1 year ago (%) - American Indian and Alaska Native
Geographical mobility - Same house 1 year ago (%) - Multirace
Geographical mobility - Same house 1 year ago (%) - Other Race
Geographical mobility - Moved within same county (%)
Geographical mobility - Moved within same county (%) - White
Geographical mobility - Moved within same county (%) - Black or African American
Geographical mobility - Moved within same county (%) - Asian
Geographical mobility - Moved within same county (%) - Hispanic or Latino
Geographical mobility - Moved within same county (%) - American Indian and Alaska Native
Geographical mobility - Moved within same county (%) - Multirace
Geographical mobility - Moved within same county (%) - Other Race
Geographical mobility - Moved from different county within same state (%)
Geographical mobility - Moved from different county within same state (%) - White
Geographical mobility - Moved from different county within same state (%) - Black or African American
Geographical mobility - Moved from different county within same state (%) - Asian
Geographical mobility - Moved from different county within same state (%) - Hispanic or Latino
Geographical mobility - Moved from different county within same state (%) - American Indian and Alaska Native
Geographical mobility - Moved from different county within same state (%) - Multirace
Geographical mobility - Moved from different county within same state (%) - Other Race
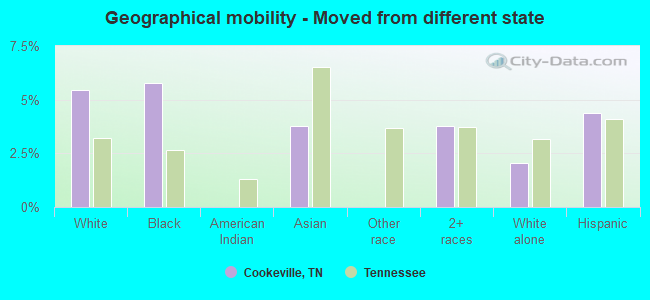
Geographical mobility - Moved from different state (%)
Geographical mobility - Moved from different state (%) - White
Geographical mobility - Moved from different state (%) - Black or African American
Geographical mobility - Moved from different state (%) - Asian
Geographical mobility - Moved from different state (%) - Hispanic or Latino
Geographical mobility - Moved from different state (%) - American Indian and Alaska Native
Geographical mobility - Moved from different state (%) - Multirace
Geographical mobility - Moved from different state (%) - Other Race
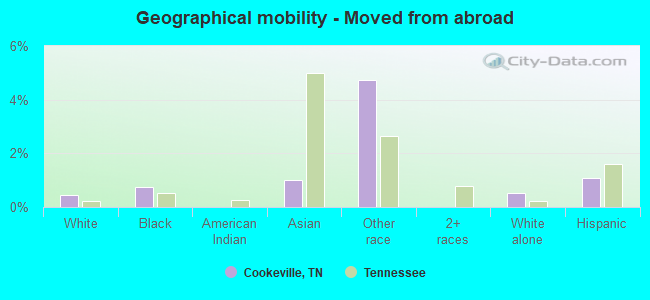
Geographical mobility - Moved from abroad (%)
Geographical mobility - Moved from abroad (%) - White
Geographical mobility - Moved from abroad (%) - Black or African American
Geographical mobility - Moved from abroad (%) - Asian
Geographical mobility - Moved from abroad (%) - Hispanic or Latino
Geographical mobility - Moved from abroad (%) - American Indian and Alaska Native
Geographical mobility - Moved from abroad (%) - Multirace
Geographical mobility - Moved from abroad (%) - Other Race
Place of birth for the foreign-born population - Ireland (%)
Place of birth for the foreign-born population - Denmark (%)
Place of birth for the foreign-born population - Norway (%)
Place of birth for the foreign-born population - Sweden (%)
Place of birth for the foreign-born population - United Kingdom (%)
Place of birth for the foreign-born population - England (%)
Place of birth for the foreign-born population - Scotland (%)
Place of birth for the foreign-born population - Other Northern Europe (%)
Place of birth for the foreign-born population - Austria (%)
Place of birth for the foreign-born population - Belgium (%)
Place of birth for the foreign-born population - France (%)
Place of birth for the foreign-born population - Germany (%)
Place of birth for the foreign-born population - Netherlands (%)
Place of birth for the foreign-born population - Switzerland (%)
Place of birth for the foreign-born population - Other Western Europe (%)
Place of birth for the foreign-born population - Greece (%)
Place of birth for the foreign-born population - Italy (%)
Place of birth for the foreign-born population - Portugal (%)
Place of birth for the foreign-born population - Spain (%)
Place of birth for the foreign-born population - Other Southern Europe (%)
Place of birth for the foreign-born population - Albania (%)
Place of birth for the foreign-born population - Belarus (%)
Place of birth for the foreign-born population - Bosnia and Herzegovina (%)
Place of birth for the foreign-born population - Bulgaria (%)
Place of birth for the foreign-born population - Croatia (%)
Place of birth for the foreign-born population - Czechoslovakia (%)
Place of birth for the foreign-born population - Hungary (%)
Place of birth for the foreign-born population - Latvia (%)
Place of birth for the foreign-born population - Lithuania (%)
Place of birth for the foreign-born population - North Macedonia (Macedonia) (%)
Place of birth for the foreign-born population - Moldova (%)
Place of birth for the foreign-born population - Poland (%)
Place of birth for the foreign-born population - Romania (%)
Place of birth for the foreign-born population - Russia (%)
Place of birth for the foreign-born population - Serbia (%)
Place of birth for the foreign-born population - Ukraine (%)
Place of birth for the foreign-born population - Other Eastern Europe (%)
Place of birth for the foreign-born population - China (%)
Place of birth for the foreign-born population - Hong Kong (%)
Place of birth for the foreign-born population - Taiwan (%)
Place of birth for the foreign-born population - Japan (%)
Place of birth for the foreign-born population - Korea (%)
Place of birth for the foreign-born population - Other Eastern Asia (%)
Place of birth for the foreign-born population - Afghanistan (%)
Place of birth for the foreign-born population - Bangladesh (%)
Place of birth for the foreign-born population - India (%)
Place of birth for the foreign-born population - Iran (%)
Place of birth for the foreign-born population - Kazakhstan (%)
Place of birth for the foreign-born population - Nepal (%)
Place of birth for the foreign-born population - Pakistan (%)
Place of birth for the foreign-born population - Sri Lanka (%)
Place of birth for the foreign-born population - Uzbekistan (%)
Place of birth for the foreign-born population - Other South Central Asia (%)
Place of birth for the foreign-born population - Burma (%)
Place of birth for the foreign-born population - Cambodia (%)
Place of birth for the foreign-born population - Indonesia (%)
Place of birth for the foreign-born population - Laos (%)
Place of birth for the foreign-born population - Malaysia (%)
Place of birth for the foreign-born population - Philippines (%)
Place of birth for the foreign-born population - Singapore (%)
Place of birth for the foreign-born population - Thailand (%)
Place of birth for the foreign-born population - Vietnam (%)
Place of birth for the foreign-born population - Other South Eastern Asia (%)
Place of birth for the foreign-born population - Armenia (%)
Place of birth for the foreign-born population - Iraq (%)
Place of birth for the foreign-born population - Israel (%)
Place of birth for the foreign-born population - Jordan (%)
Place of birth for the foreign-born population - Kuwait (%)
Place of birth for the foreign-born population - Lebanon (%)
Place of birth for the foreign-born population - Saudi Arabia (%)
Place of birth for the foreign-born population - Syria (%)
Place of birth for the foreign-born population - Turkey (%)
Place of birth for the foreign-born population - Yemen (%)
Place of birth for the foreign-born population - Other Western Asia (%)
Place of birth for the foreign-born population - Eritrea (%)
Place of birth for the foreign-born population - Ethiopia (%)
Place of birth for the foreign-born population - Kenya (%)
Place of birth for the foreign-born population - Somalia (%)
Place of birth for the foreign-born population - Uganda (%)
Place of birth for the foreign-born population - Zimbabwe (%)
Place of birth for the foreign-born population - Other Eastern Africa (%)
Place of birth for the foreign-born population - Cameroon (%)
Place of birth for the foreign-born population - Congo (%)
Place of birth for the foreign-born population - Democratic Republic of Congo (Zaire) (%)
Place of birth for the foreign-born population - Other Middle Africa (%)
Place of birth for the foreign-born population - Egypt (%)
Place of birth for the foreign-born population - Morocco (%)
Place of birth for the foreign-born population - Sudan (%)
Place of birth for the foreign-born population - Other Northern Africa (%)
Place of birth for the foreign-born population - South Africa (%)
Place of birth for the foreign-born population - Other Southern Africa (%)
Place of birth for the foreign-born population - Cabo Verde (%)
Place of birth for the foreign-born population - Ghana (%)
Place of birth for the foreign-born population - Liberia (%)
Place of birth for the foreign-born population - Nigeria (%)
Place of birth for the foreign-born population - Senegal (%)
Place of birth for the foreign-born population - Sierra Leone (%)
Place of birth for the foreign-born population - Other Western Africa (%)
Place of birth for the foreign-born population - Australia (%)
Place of birth for the foreign-born population - New Zealand (%)
Place of birth for the foreign-born population - Fiji (%)
Place of birth for the foreign-born population - Micronesia (%)
Place of birth for the foreign-born population - Bahamas (%)
Place of birth for the foreign-born population - Barbados (%)
Place of birth for the foreign-born population - Cuba (%)
Place of birth for the foreign-born population - Dominica (%)
Place of birth for the foreign-born population - Dominican Republic (%)
Place of birth for the foreign-born population - Grenada (%)
Place of birth for the foreign-born population - Haiti (%)
Place of birth for the foreign-born population - Jamaica (%)
Place of birth for the foreign-born population - St. Vincent and the Grenadines (%)
Place of birth for the foreign-born population - Trinidad and Tobago (%)
Place of birth for the foreign-born population - West Indies (%)
Place of birth for the foreign-born population - Other Caribbean (%)
Place of birth for the foreign-born population - Belize (%)
Place of birth for the foreign-born population - Costa Rica (%)
Place of birth for the foreign-born population - El Salvador (%)
Place of birth for the foreign-born population - Guatemala (%)
Place of birth for the foreign-born population - Honduras (%)
Place of birth for the foreign-born population - Mexico (%)
Place of birth for the foreign-born population - Nicaragua (%)
Place of birth for the foreign-born population - Panama (%)
Place of birth for the foreign-born population - Other Central America (%)
Place of birth for the foreign-born population - Argentina (%)
Place of birth for the foreign-born population - Bolivia (%)
Place of birth for the foreign-born population - Brazil (%)
Place of birth for the foreign-born population - Chile (%)
Place of birth for the foreign-born population - Colombia (%)
Place of birth for the foreign-born population - Ecuador (%)
Place of birth for the foreign-born population - Guyana (%)
Place of birth for the foreign-born population - Peru (%)
Place of birth for the foreign-born population - Uruguay (%)
Place of birth for the foreign-born population - Venezuela (%)
Place of birth for the foreign-born population - Other South America (%)
Place of birth for the foreign-born population - Canada (%)
Place of birth for the foreign-born population - Other Northern America (%)
Place of birth for the foreign-born population - Other (%)
Latest news about races in Cookeville, TN collected exclusively by city-data.com from local newspapers, TV, and radio stations
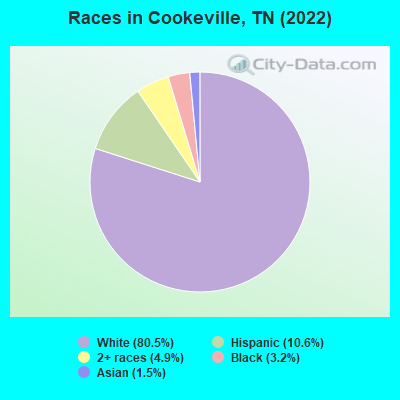
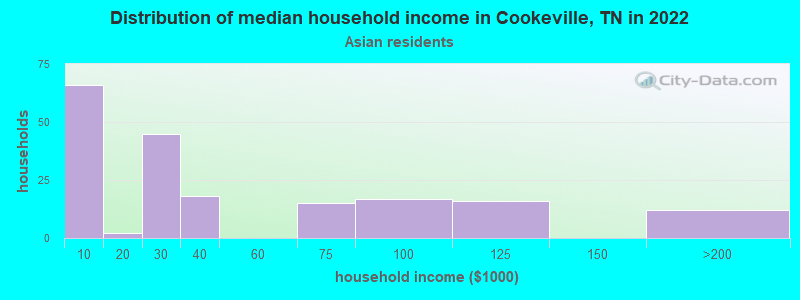
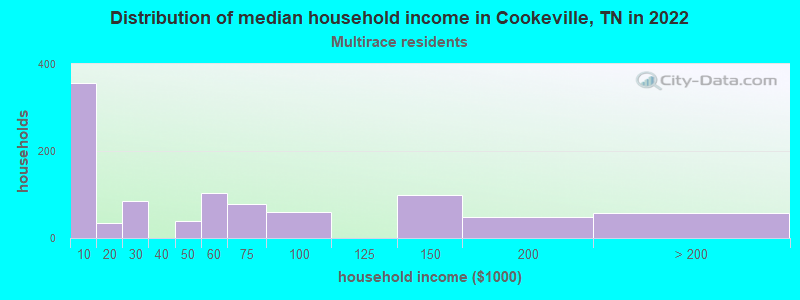
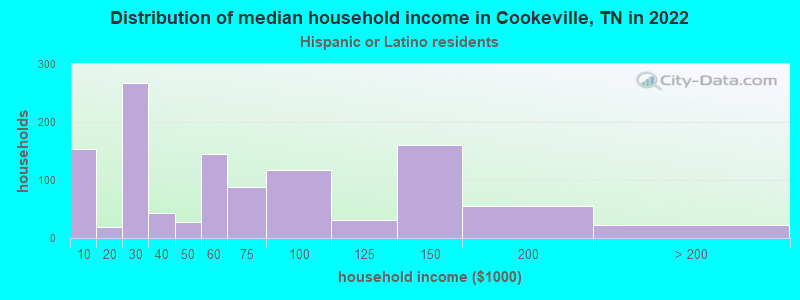
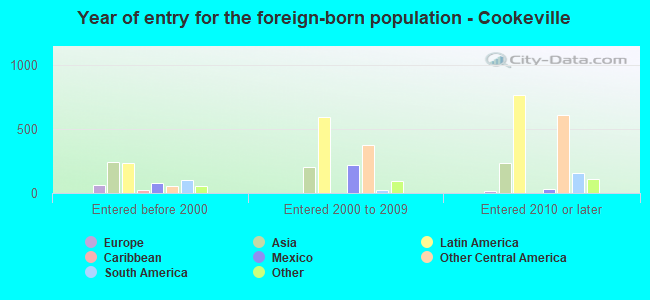
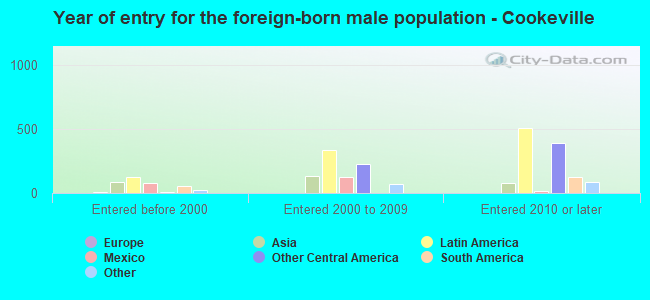
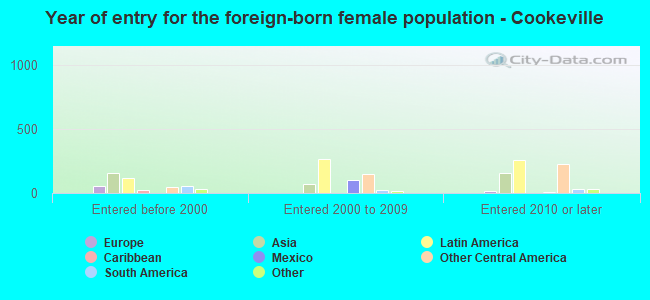
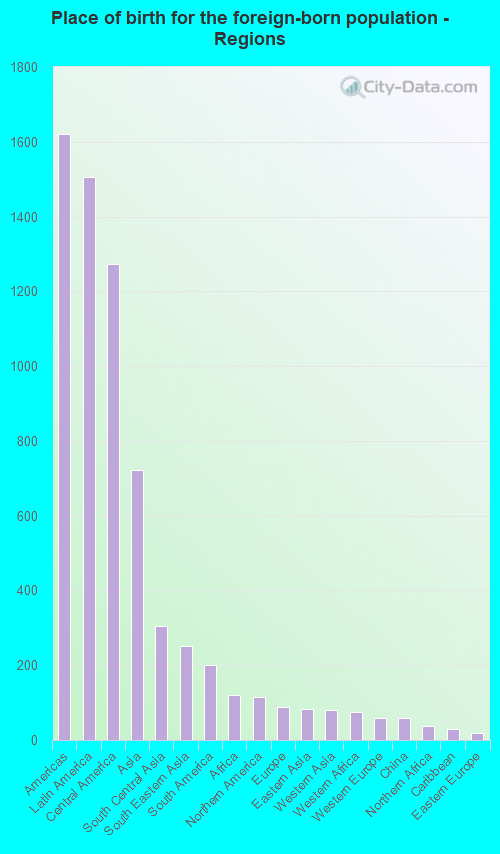
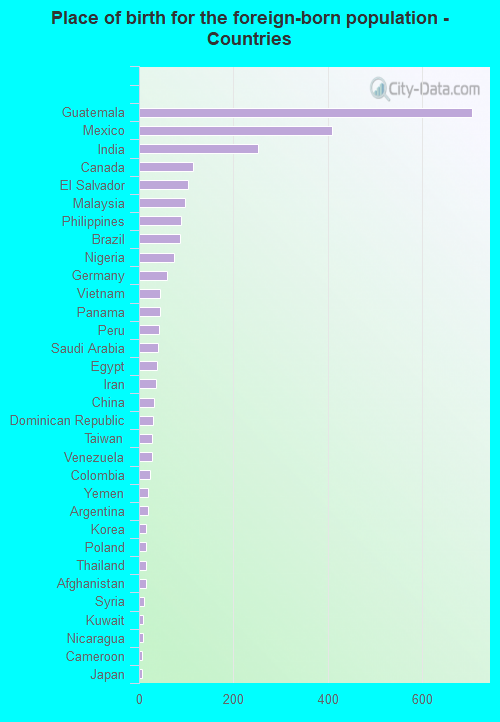
According to 2022 data, the most numerous races in Cookeville, TN are White alone (28,682 residents), Black alone (1,133 residents), and Hispanic (3,785 residents). 90.3% of Cookeville residents speak English at home. 7.1% of Cookeville, TN residents are foreign-born (4.1% born in Latin America, 2.0% born in Asia), which is 29.6% greater than the foreign-born rate of 5.0% across the entire state of Tennessee.
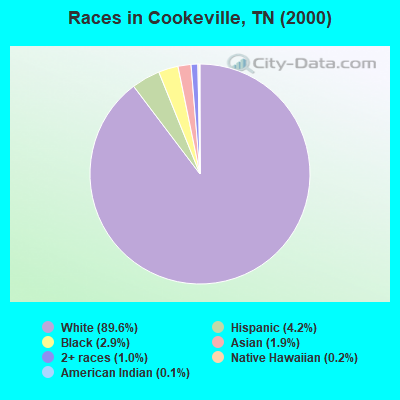
Race distribution in Cookeville
2000 2022
4,505,930 79.2% White alone 928,204 16.3% Black alone 123,838 2.2% Hispanic 54,824 1.0% Two or more races 56,077 1.0% Asian alone 13,820 0.2% American Indian alone 4,780 0.08% Other race alone 1,810 0.03% Native Hawaiian and Other
5,070,026 71.9% White alone 1,089,738 15.5% Black alone 442,629 6.3% Hispanic 279,381 4.0% Two or more races 131,817 1.9% Asian alone 26,972 0.4% Other race alone 6,387 0.09% American Indian alone 4,389 0.06% Native Hawaiian and Other
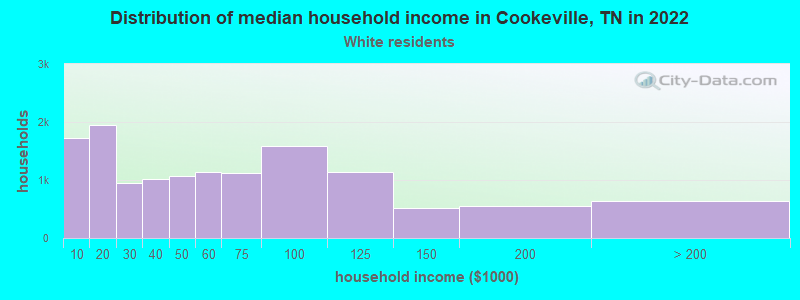
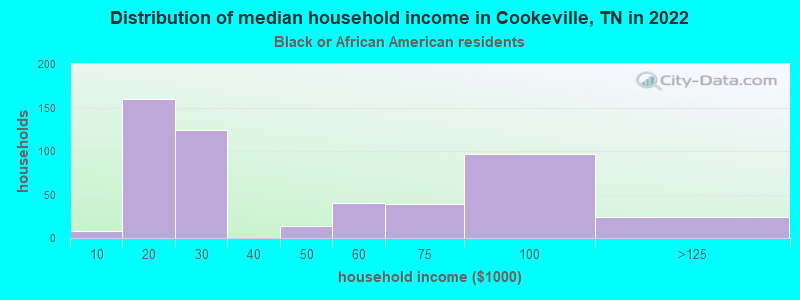
Income and house value in Cookeville Median household income in 2022 $49,965 White non-Hispanic householders$28,896 Black householders$53,487 Hispanic or Latino race householdersMedian 2022 house value $327,222 White Non-Hispanic householders$232,048 Black or African American householders$517,253 American Indian or Alaska Native householders $593,329 Asian householders$392,157 Two or more races householders$437,676 Hispanic or Latino householders
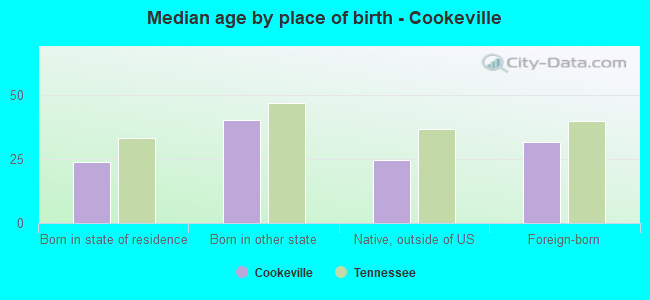
Median age by race in Cookeville
30.9 Median age for White residents27.9 32.7 44.0 Median age for Black or African American residents39.3 53.8 -681,948,423.4 Median age for American Indian / Alaska Native residents-633,911,367.4 -801,477,376.9 26.4 Median age for Asian residents24.9 44.4 -666,666,666.0 Median age for Native Hawaiian / Pacific Islander residents-666,666,666.0 -666,666,666.0 17.4 Median age for Other race residents35.4 14.6 25.0 Median age for Two or more races residents20.0 33.8 31.0 Median age for White alone residents27.6 33.4 22.8 Median age for Hispanic or Latino residents21.9 26.6
Owner/renter occupied households by race in Cookeville
House owners and renters - White residents 5,536 41.6% Owner occupied7,769 58.4% Renter occupiedHouse owners and renters - Black or African American residents 53 10.1% Owner occupied469 89.9% Renter occupiedHouse owners and renters - American Indian / Alaska Native residents 11 100.0% Owner occupiedHouse owners and renters - Asian residents 146 83.8% Owner occupied28 16.2% Renter occupiedHouse owners and renters - Other race residents 86 23.8% Owner occupied275 76.2% Renter occupiedHouse owners and renters - Two or more races residents 255 24.6% Owner occupied782 75.4% Renter occupiedHouse owners and renters - White alone residents 5,434 41.7% Owner occupied7,603 58.3% Renter occupiedHouse owners and renters - Hispanic or Latino residents 289 22.0% Owner occupied1,026 78.0% Renter occupied
Language usage in Cookeville
English speakers - Total 90.3% of residents of Cookeville speak English at home.
6.2% of residents speak Spanish at home 1,169 56.0% Speak English very well919 44.0% Speak English less than very well3.6% of residents speak other language at home 991 82.5% Speak English very well210 17.5% Speak English less than very well
English speakers - Born in the United States 94.7% of residents of Cookeville speak English at home.
3.2% of residents speak Spanish at home 366 100.0% Speak English very well2.0% of residents speak other language at home 228 100.0% Speak English very well
English speakers - Native, born elsewhere 76.8% of residents of Cookeville speak English at home.
20.4% of residents speak Spanish at home 1 1.4% Speak English very well72 98.6% Speak English less than very well5.3% of residents speak other language at home 19 100.0% Speak English less than very well
English speakers - Foreign-born 24.0% of residents of Cookeville speak English at home.
45.5% of residents speak Spanish at home 512 44.2% Speak English very well647 55.8% Speak English less than very well29.9% of residents speak other language at home 568 74.4% Speak English very well195 25.6% Speak English less than very well
White (Caucasian) - Speak only English Native:
98.6% (27,407)Foreign-born:
27.2% (244)
White (Caucasian) - Speak another language Native:
2.0% (544)Foreign-born:
69.2% (622)
Black or African American - Speak only English Native:
98.0% (1,081)Foreign-born:
65.0% (26)
Black or African American - Speak another language Native:
2.0% (22)Foreign-born:
37.4% (15)
Asian - Speak only English Native:
45.6% (46)Foreign-born:
22.5% (94)
Asian - Speak another language Native:
55.1% (56)Foreign-born:
77.4% (322)
Other race - Speak only English Native:
25.3% (173)Foreign-born:
27.0% (126)
Other race - Speak another language Native:
72.9% (497)Foreign-born:
62.6% (292)
Two or more races - Speak only English Native:
83.0% (946)Foreign-born:
16.9% (204)
Two or more races - Speak another language Native:
18.6% (212)Foreign-born:
83.2% (1,002)
White alone - Speak only English Native:
99.2% (27,058)Foreign-born:
31.9% (240)
White alone - Speak another language Native:
0.6% (150)Foreign-born:
30.3% (228)
Hispanic or Latino - Speak only English Native:
43.7% (743)Foreign-born:
17.2% (323)
Hispanic or Latino - Speak another language Native:
57.7% (981)Foreign-born:
83.6% (1,575)
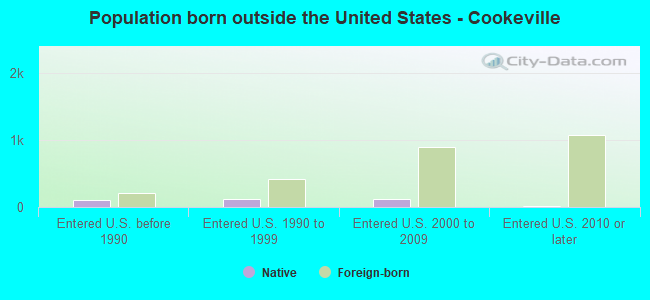
Foreign-born residents in Cookeville 2,554 residents are foreign born (4.1% Latin America , 2.0% Asia ).
This city:
7.1%Tennessee:
5.4%
Marital status for residents in Cookeville Marital status - White (Caucasian) population 15 years and over
Males 48.5% Never married38.3% Now married1.7% Separated2.6% Widowed8.9% DivorcedFemales 39.4% Never married37.4% Now married0.7% Separated9.5% Widowed13.0% DivorcedWomen who gave birth in the past 12 months Now married:
65.8% (244)Unmarried:
34.2% (127)
Women who did not give birth in the past 12 months Now married:
32.8% (2,624)Unmarried:
67.2% (5,377)
Marital status - Black or African American population 15 years and over
Males 78.4% Never married11.8% Now married1.4% Separated0.8% Widowed7.6% DivorcedFemales 70.8% Never married9.6% Now married0.0% Separated6.9% Widowed12.7% DivorcedWomen who did not give birth in the past 12 months Now married:
2.1% (8)Unmarried:
97.9% (361)
Marital status - Asian population 15 years and over
Males 17.1% Never married77.9% Now married0.0% Separated0.0% Widowed5.0% DivorcedFemales 31.6% Never married52.3% Now married0.0% Separated0.0% Widowed16.0% DivorcedWomen who gave birth in the past 12 months Now married:
100.0% (6)Unmarried:
0.0% (0)
Women who did not give birth in the past 12 months Now married:
36.8% (55)Unmarried:
63.2% (95)
Marital status - Other race population 15 years and over
Males 23.2% Never married51.8% Now married0.0% Separated0.0% Widowed25.0% DivorcedFemales 45.0% Never married31.2% Now married17.9% Separated0.0% Widowed6.0% DivorcedWomen who gave birth in the past 12 months Now married:
0.0% (0)Unmarried:
100.0% (37)
Women who did not give birth in the past 12 months Now married:
56.5% (255)Unmarried:
43.5% (196)
Marital status - Two or more races population 15 years and over
Males 50.3% Never married42.8% Now married1.6% Separated0.0% Widowed5.4% DivorcedFemales 38.1% Never married50.0% Now married3.2% Separated3.5% Widowed5.2% DivorcedWomen who gave birth in the past 12 months Now married:
100.0% (28)Unmarried:
0.0% (0)
Women who did not give birth in the past 12 months Now married:
44.9% (350)Unmarried:
55.1% (429)
Marital status - White alone, not Hispanic / Latino population 15 years and over
Males 49.3% Never married36.9% Now married1.7% Separated2.7% Widowed9.3% DivorcedFemales 38.7% Never married37.4% Now married0.8% Separated9.7% Widowed13.4% DivorcedWomen who gave birth in the past 12 months Now married:
77.2% (225)Unmarried:
22.8% (67)
Women who did not give birth in the past 12 months Now married:
32.6% (2,560)Unmarried:
67.4% (5,295)
Marital status - Hispanic or Latino population 15 years and over
Males 36.8% Never married55.2% Now married0.0% Separated0.0% Widowed8.0% DivorcedFemales 57.6% Never married27.6% Now married9.6% Separated0.9% Widowed4.2% DivorcedWomen who gave birth in the past 12 months Now married:
20.5% (27)Unmarried:
79.5% (104)
Women who did not give birth in the past 12 months Now married:
39.0% (376)Unmarried:
61.0% (588)
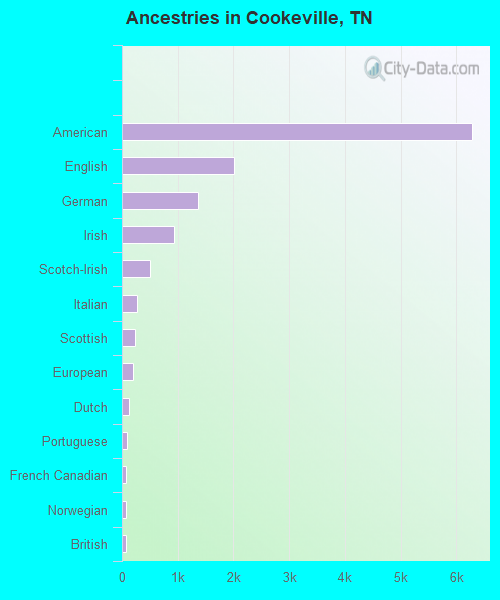
Ancestries in Cookeville
6,274 34.6% American2,003 11.0% English1,362 7.5% German928 5.1% Irish494 2.7% Scotch-Irish272 1.5% Italian234 1.3% Scottish200 1.1% European119 0.7% Dutch86 0.5% Portuguese77 0.4% French Canadian70 0.4% Norwegian64 0.4% British53 0.3% French51 0.3% Arab49 0.3% Polish46 0.3% Pennsylvania German44 0.2% Lebanese32 0.2% Egyptian30 0.2% Austrian27 0.1% Iranian27 0.1% Nigerian26 0.1% Greek26 0.1% Swedish20 0.1% Scandinavian19 0.1% Syrian18 0.10% Northern European17 0.09% Celtic17 0.09% Australian16 0.09% Slavic16 0.09% Ukrainian15 0.08% Palestinian15 0.08% Czech13 0.07% Welsh11 0.06% Eastern European9 0.05% Russian9 0.05% Danish7 0.04% Canadian5 0.03% Slovak5 0.03% Swiss
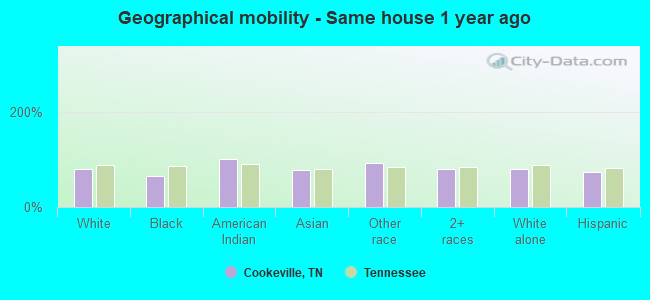
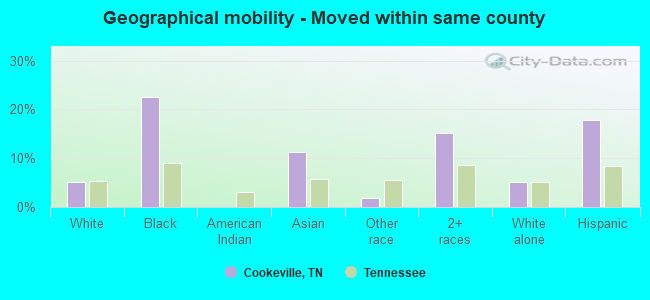
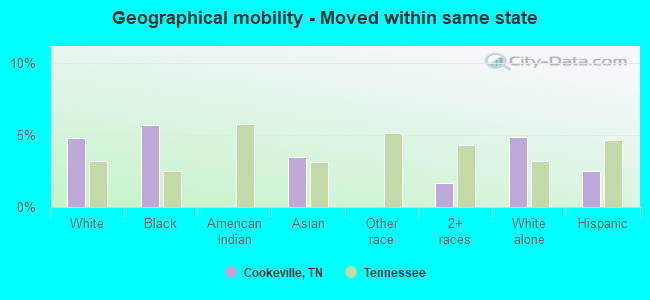
Geographical mobility in Cookeville Same house 1 year ago 23,830 80.1% White (Caucasian)789 64.4% Black or African American21 100.0% American Indian / Alaska Native415 76.8% Asian1,160 93.5% Other race2,466 78.8% Two or more races23,200 80.3% White alone, not Hispanic / Latino2,733 74.0% Hispanic or LatinoMoved within same county 1,524 5.1% White / Caucasian277 22.6% Black or African American60 11.2% Asian23 1.8% Other race477 15.2% Two or more races1,480 5.1% White alone, not Hispanic / Latino655 17.7% Hispanic or LatinoMoved within same state 1,434 4.8% White / Caucasian70 5.7% Black or African American19 3.5% Asian52 1.7% Two or more races1,401 4.8% White alone, not Hispanic / Latino94 2.5% Hispanic or LatinoMoved from different state 1,627 5.5% White / Caucasian71 5.8% Black or African American20 3.8% Asian118 3.8% Two or more races590 2.0% White alone, not Hispanic / Latino162 4.4% Hispanic or LatinoMoved from abroad 131 0.4% White9 0.7% Black or African American6 1.0% Asian59 4.7% Other race156 0.5% White alone, not Hispanic / Latino40 1.1% Hispanic or Latino
Children Nativity (place of birth) in Cookeville
Children under 6 years - Living with two parents Both parents native 1,160 100.0% NativeBoth parents foreign-born 289 100.0% NativeOne native, one foreign-born parent 113 100.0% NativeChildren under 6 years - Living with one parent Native parent 332 100.0% NativeForeign-born parent 158 100.0% NativeChildren 6 to 17 years - Living with two parents Both parents native 1,857 100.0% NativeBoth parents foreign-born 139 100.0% NativeOne native, one foreign-born parent 230 100.0% NativeChildren 6 to 17 years - Living with one parent Native parent 1,101 94.7% Native61 5.3% Foreign-bornForeign-born parent 498 68.1% Native234 31.9% Foreign-born
Grandparents responsible for own grandchildren in Cookeville
Grandparents (30 to 59 years) White / Caucasian 52 32.0% Responsible for grandchildren110 68.0% Not responsible for grandchildrenWhite alone, not Hispanic / Latino 52 31.5% Responsible for grandchildren113 68.5% Not responsible for grandchildrenGrandparents (60 years and over) White / Caucasian 11 5.3% Responsible for grandchildren188 94.7% Not responsible for grandchildrenWhite alone, not Hispanic / Latino 11 5.3% Responsible for grandchildren188 94.7% Not responsible for grandchildren