Races in Copake, New York (NY) Detailed Stats
Ancestries, Foreign-born residents, place of birth

Recent posts about races in Copake, New York on our local forum with over 2,400,000 registered users:
 | For those interested in Technology and Economic activity in Upstate NY... (2804 replies) |
| Should I relocate to Hudson, NY?? (18 replies) |
| Cabin or cottage upstate new york (8 replies) |
4.0% of Copake, NY residents are foreign-born (2.1% born in Europe, 1.3% born in North America, 0.5% born in Latin America), which is 454.7% less than the foreign-born rate of 22.0% across the entire state of New York.
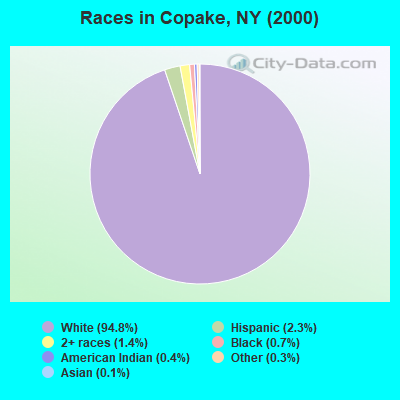
Race distribution in Copake

- 3,10994.8%White alone
- 752.3%Hispanic
- 451.4%Two or more races
- 230.7%Black alone
- 130.4%American Indian alone
- 90.3%Other race alone
- 40.1%Asian alone
2000
2022
-
- 11,760,98162.0%White alone
- 2,867,58315.1%Hispanic
- 2,812,62314.8%Black alone
- 1,035,9265.5%Asian alone
- 366,1161.9%Two or more races
- 75,4990.4%Other race alone
- 52,4990.3%American Indian alone
- 5,2300.03%Native Hawaiian and Other
Pacific Islander alone

-
- 10,408,93352.9%White alone
- 3,867,29919.7%Hispanic
- 2,633,84013.4%Black alone
- 1,776,2869.0%Asian alone
- 732,6703.7%Two or more races
- 216,1101.1%Other race alone
- 35,0820.2%American Indian alone
- 6,9310.04%Native Hawaiian and Other
Pacific Islander alone

Income and house value in Copake
- Median household income in 2022
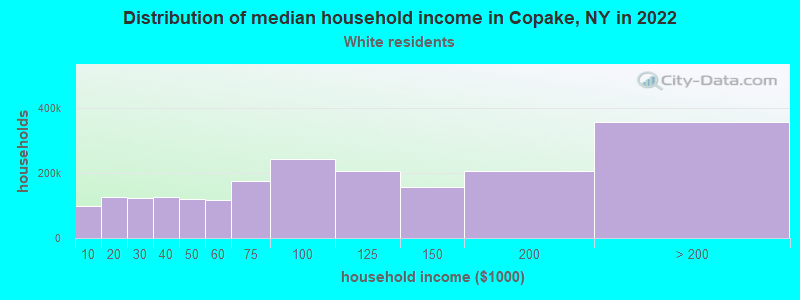
- $75,313White non-Hispanic householders
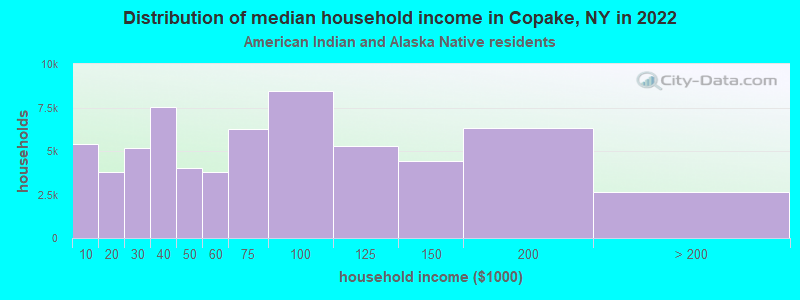
- $149,241American Indian and Alaska Native householders
- $56,671Some other race householders
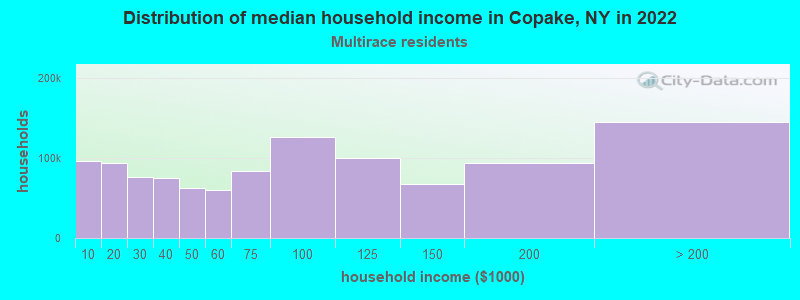
- over $200,000Two or more races householders
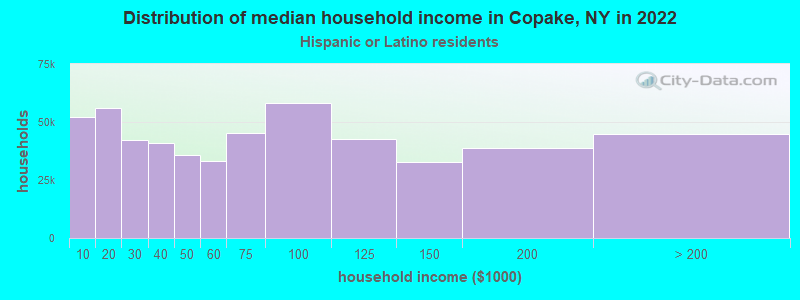
- $48,939Hispanic or Latino race householders
- Median 2022 house value
- $285,101White Non-Hispanic householders
- $146,273American Indian or Alaska Native householders
- $237,495Two or more races householders
- $227,921Hispanic or Latino householders
Household income for White non-Hispanic householders
Household income for American Indian and Alaska Native householders
Household income for Two or more races householders
Household income for Hispanic or Latino race householders
Foreign-born residents in Copake
130 residents are foreign born (2.1% Europe, 1.3% North America, 0.5% Latin America).
| This city: | 4.0% |
| New York: | 20.4% |
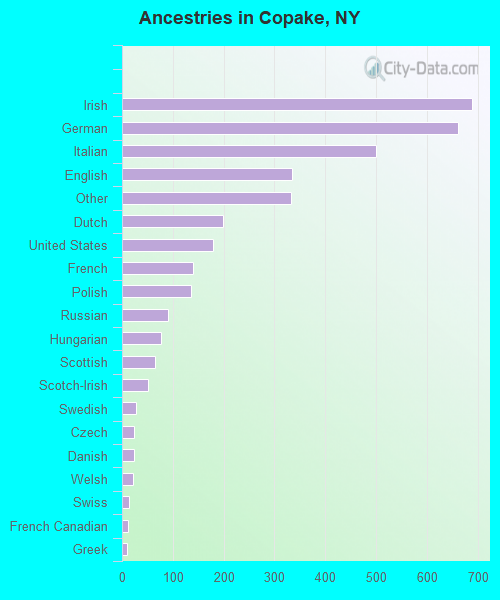
Ancestries in Copake

- 68819.1%Irish
- 66218.4%German
- 49913.9%Italian
- 3349.3%English
- 3329.2%Other
- 1985.5%Dutch
- 1795.0%United States
- 1393.9%French
- 1353.8%Polish
- 902.5%Russian
- 762.1%Hungarian
- 641.8%Scottish
- 521.4%Scotch-Irish
- 270.8%Swedish
- 240.7%Czech
- 240.7%Danish
- 220.6%Welsh
- 140.4%Swiss
- 110.3%French Canadian
- 90.3%Greek
- 50.1%Lithuanian
- 40.1%Slovak
- 40.1%Ukrainian
- 30.08%Norwegian
Zip codes: 12516.