Races in Crystal, Maine (ME) Detailed Stats
Ancestries, Foreign-born residents, place of birth

Recent posts about races in Crystal, Maine on our local forum with over 2,400,000 registered users:

0.7% of Crystal, ME residents are foreign-born , which is 327.5% less than the foreign-born rate of 3.0% across the entire state of Maine.
Race distribution in Crystal
2000
2022

- 1,230,29796.5%White alone
- 11,7310.9%Two or more races
- 9,3600.7%Hispanic
- 9,0140.7%Asian alone
- 6,4400.5%Black alone
- 6,9110.5%American Indian alone
- 8360.07%Other race alone
- 3340.03%Native Hawaiian and Other
Pacific Islander alone

-
- 1,249,23390.2%White alone
- 58,3574.2%Two or more races
- 28,7172.1%Hispanic
- 21,5831.6%Black alone
- 16,1511.2%Asian alone
- 5,8730.4%Other race alone
- 5,2050.4%American Indian alone
- 2210.02%Native Hawaiian and Other
Pacific Islander alone

Income and house value in Crystal
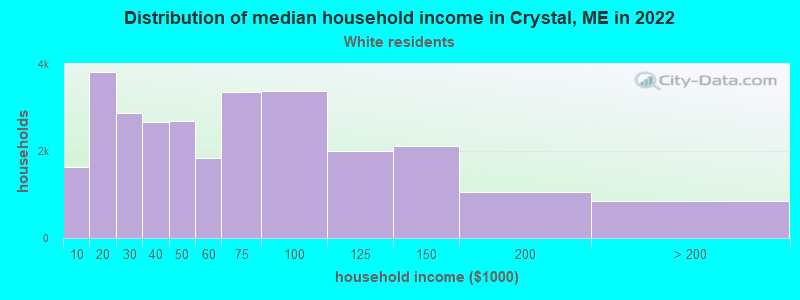
- Median household income in 2022
- $51,166White non-Hispanic householders
- Median 2022 house value
- $115,734White Non-Hispanic householders
Household income for White non-Hispanic householders
Foreign-born residents in Crystal
2 residents are foreign born
| This city: | 0.7% |
| Maine: | 2.9% |
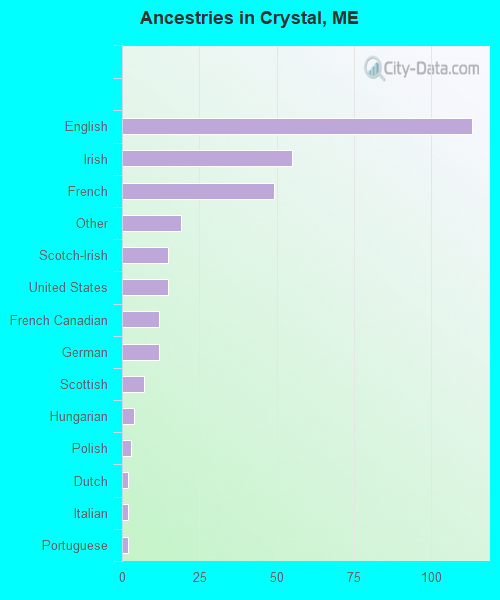
Ancestries in Crystal

- 11336.5%English
- 5517.7%Irish
- 4915.8%French
- 196.1%Other
- 154.8%Scotch-Irish
- 154.8%United States
- 123.9%French Canadian
- 123.9%German
- 72.3%Scottish
- 41.3%Hungarian
- 31.0%Polish
- 20.6%Dutch
- 20.6%Italian
- 20.6%Portuguese
Zip codes: 04747.