Races in Danville, Alabama (AL) Detailed Stats
Ancestries, Foreign-born residents, place of birth
Race distribution in Danville

- 5,74895.4%White alone
- 1182.0%Black alone
- 721.2%Two or more races
- 490.8%American Indian alone
- 340.6%Hispanic
- 40.07%Other race alone
- 30.05%Asian alone
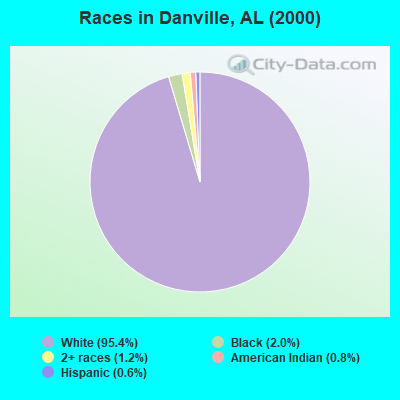
2000
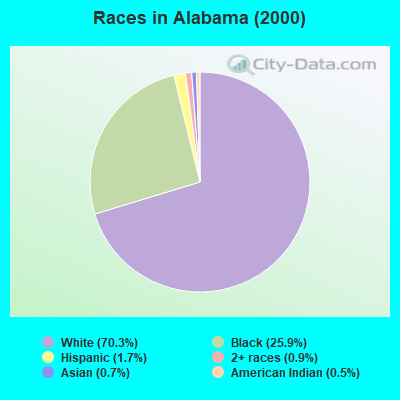
2022
-
- 3,125,81970.3%White alone
- 1,150,07625.9%Black alone
- 75,8301.7%Hispanic
- 39,0860.9%Two or more races
- 30,9890.7%Asian alone
- 21,6180.5%American Indian alone
- 2,6230.06%Other race alone
- 1,0590.02%Native Hawaiian and Other
Pacific Islander alone
-
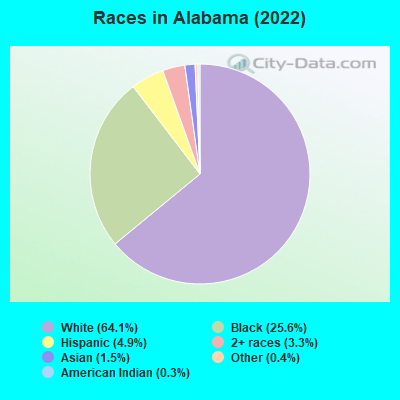
- 3,250,18264.1%White alone
- 1,296,50025.6%Black alone
- 246,4774.9%Hispanic
- 169,8803.3%Two or more races
- 76,6821.5%Asian alone
- 19,9270.4%Other race alone
- 12,6940.3%American Indian alone
- 1,9540.04%Native Hawaiian and Other
Pacific Islander alone
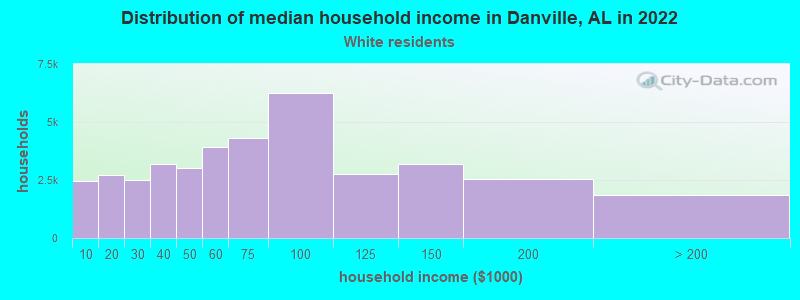
Income and house value in Danville
- Median household income in 2022
- $69,257White non-Hispanic householders
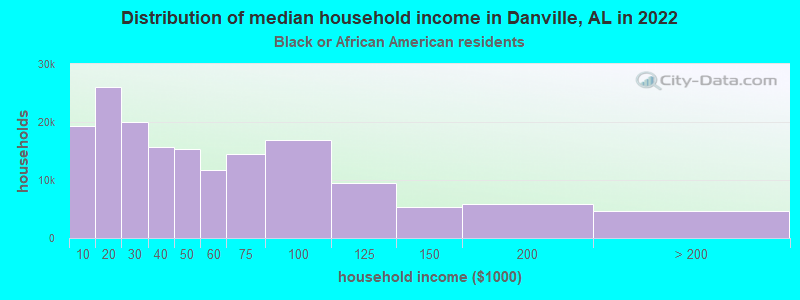
- $26,479Black householders
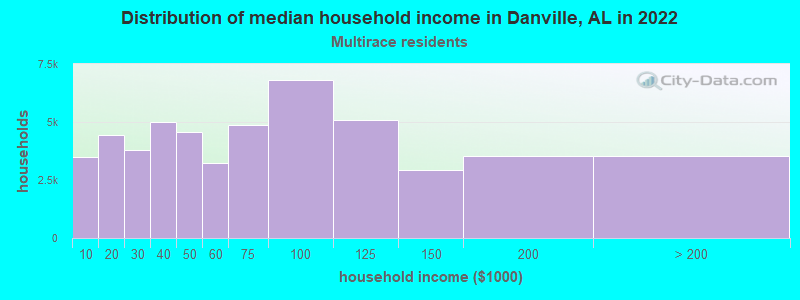
- $73,412Two or more races householders
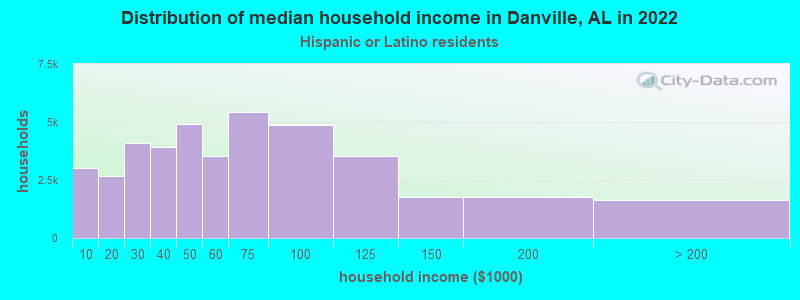
- $67,477Hispanic or Latino race householders
- Median 2022 house value
- $234,688White Non-Hispanic householders
- $137,513Two or more races householders
Household income for White non-Hispanic householders
Household income for Black householders
Household income for Two or more races householders
Household income for Hispanic or Latino race householders
Zip code: 35640