Races in Del Aire, California (CA) Detailed Stats
Data:
Races - White alone (%)
Races - White alone (% change since 2000)
Races - Black alone (%)
Races - Black alone (% change since 2000)
Races - American Indian alone (%)
Races - American Indian alone (% change since 2000)
Races - Asian alone (%)
Races - Asian alone (% change since 2000)
Races - Hispanic (%)
Races - Hispanic (% change since 2000)
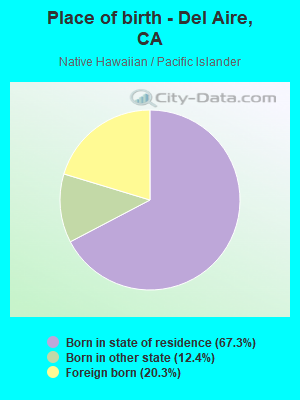
Races - Native Hawaiian and Other Pacific Islander alone (%)
Races - Native Hawaiian and Other Pacific Islander alone (% change since 2000)
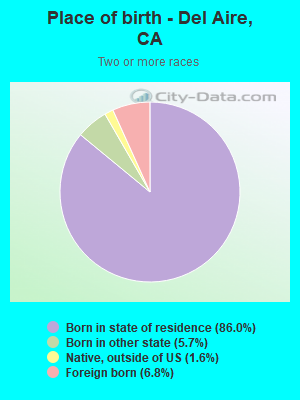
Races - Two or more races(%)
Races - Two or more races(% change since 2000)
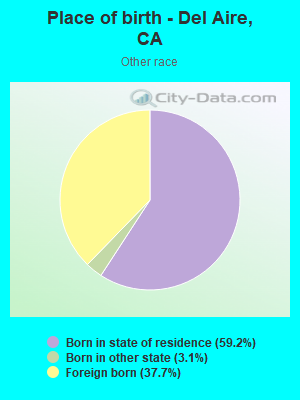
Races - Other race alone (%)
Races - Other race alone (% change since 2000)
Racial diversity
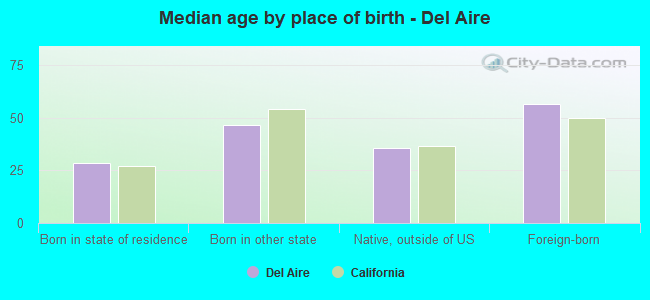
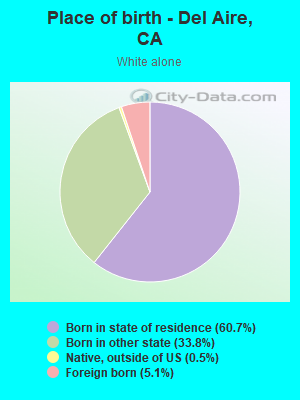
Place of birth - Born in state of residence (%)
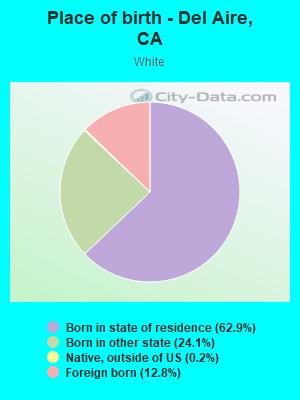
Place of birth - Born in state of residence (%) - White
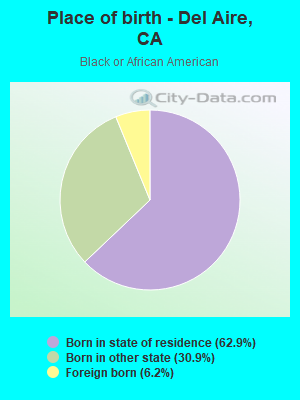
Place of birth - Born in state of residence (%) - Black or African American
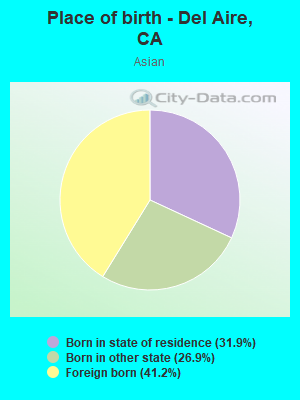
Place of birth - Born in state of residence (%) - Asian
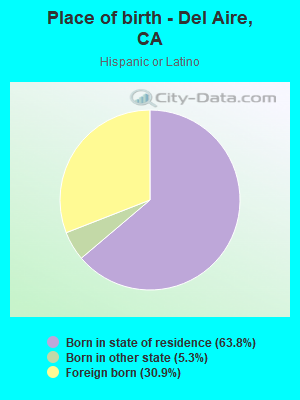
Place of birth - Born in state of residence (%) - Hispanic or Latino
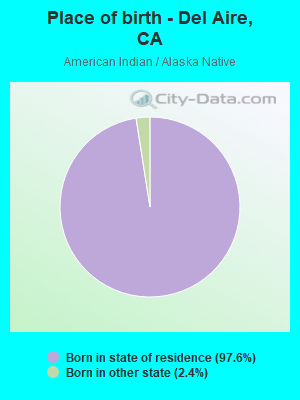
Place of birth - Born in state of residence (%) - American Indian and Alaska Native
Place of birth - Born in state of residence (%) - Multirace
Place of birth - Born in state of residence (%) - Other Race
Place of birth - Born in other state (%)
Place of birth - Born in other state (%) - White
Place of birth - Born in other state (%) - Black or African American
Place of birth - Born in other state (%) - Asian
Place of birth - Born in other state (%) - Hispanic or Latino
Place of birth - Born in other state (%) - American Indian and Alaska Native
Place of birth - Born in other state (%) - Multirace
Place of birth - Born in other state (%) - Other Race
Place of birth - Native, outside of US (%)
Place of birth - Native, outside of US (%) - White
Place of birth - Native, outside of US (%) - Black or African American
Place of birth - Native, outside of US (%) - Asian
Place of birth - Native, outside of US (%) - Hispanic or Latino
Place of birth - Native, outside of US (%) - American Indian and Alaska Native
Place of birth - Native, outside of US (%) - Multirace
Place of birth - Native, outside of US (%) - Other Race
Place of birth - Foreign born (%)
Place of birth - Foreign born (%) - White
Place of birth - Foreign born (%) - Black or African American
Place of birth - Foreign born (%) - Asian
Place of birth - Foreign born (%) - Hispanic or Latino
Place of birth - Foreign born (%) - American Indian and Alaska Native
Place of birth - Foreign born (%) - Multirace
Place of birth - Foreign born (%) - Other Race
Residents speaking English at home (%)
Residents speaking English at home - Born in the United States (%)
Residents speaking English at home - Native, born elsewhere (%)
Residents speaking English at home - Foreign born (%)
Residents speaking Spanish at home (%)
Residents speaking Spanish at home - Born in the United States (%)
Residents speaking Spanish at home - Native, born elsewhere (%)
Residents speaking Spanish at home - Foreign born (%)
Residents speaking other language at home (%)
Residents speaking other language at home - Born in the United States (%)
Residents speaking other language at home - Native, born elsewhere (%)
Residents speaking other language at home - Foreign born (%)
Marital status - Never married (%)
Marital status - Now married (%)
Marital status - Separated (%)
Marital status - Widowed (%)
Marital status - Divorced (%)
Ancestries Reported - Arab (%)
Ancestries Reported - Czech (%)
Ancestries Reported - Danish (%)
Ancestries Reported - Dutch (%)
Ancestries Reported - English (%)
Ancestries Reported - French (%)
Ancestries Reported - French Canadian (%)
Ancestries Reported - German (%)
Ancestries Reported - Greek (%)
Ancestries Reported - Hungarian (%)
Ancestries Reported - Irish (%)
Ancestries Reported - Italian (%)
Ancestries Reported - Lithuanian (%)
Ancestries Reported - Norwegian (%)
Ancestries Reported - Polish (%)
Ancestries Reported - Portuguese (%)
Ancestries Reported - Russian (%)
Ancestries Reported - Scotch-Irish (%)
Ancestries Reported - Scottish (%)
Ancestries Reported - Slovak (%)
Ancestries Reported - Subsaharan African (%)
Ancestries Reported - Swedish (%)
Ancestries Reported - Swiss (%)
Ancestries Reported - Ukrainian (%)
Ancestries Reported - United States (%)
Ancestries Reported - Welsh (%)
Ancestries Reported - West Indian (%)
Ancestries Reported - Other (%)
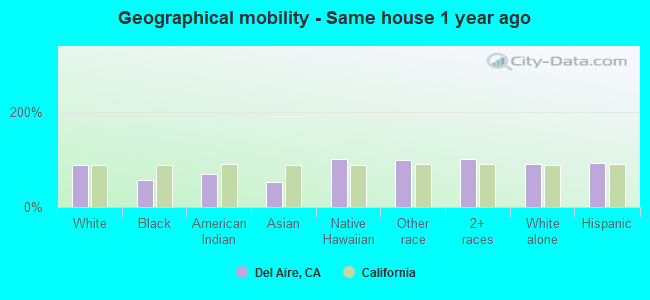
Geographical mobility - Same house 1 year ago (%)
Geographical mobility - Same house 1 year ago (%) - White
Geographical mobility - Same house 1 year ago (%) - Black or African American
Geographical mobility - Same house 1 year ago (%) - Asian
Geographical mobility - Same house 1 year ago (%) - Hispanic or Latino
Geographical mobility - Same house 1 year ago (%) - American Indian and Alaska Native
Geographical mobility - Same house 1 year ago (%) - Multirace
Geographical mobility - Same house 1 year ago (%) - Other Race
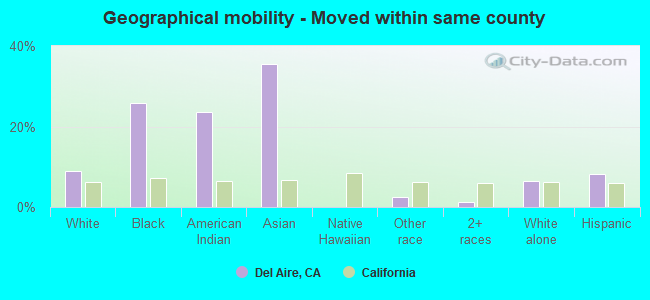
Geographical mobility - Moved within same county (%)
Geographical mobility - Moved within same county (%) - White
Geographical mobility - Moved within same county (%) - Black or African American
Geographical mobility - Moved within same county (%) - Asian
Geographical mobility - Moved within same county (%) - Hispanic or Latino
Geographical mobility - Moved within same county (%) - American Indian and Alaska Native
Geographical mobility - Moved within same county (%) - Multirace
Geographical mobility - Moved within same county (%) - Other Race
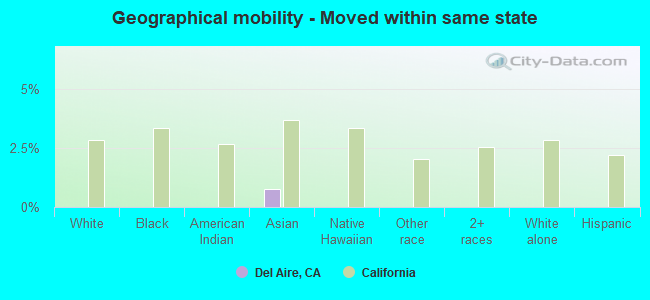
Geographical mobility - Moved from different county within same state (%)
Geographical mobility - Moved from different county within same state (%) - White
Geographical mobility - Moved from different county within same state (%) - Black or African American
Geographical mobility - Moved from different county within same state (%) - Asian
Geographical mobility - Moved from different county within same state (%) - Hispanic or Latino
Geographical mobility - Moved from different county within same state (%) - American Indian and Alaska Native
Geographical mobility - Moved from different county within same state (%) - Multirace
Geographical mobility - Moved from different county within same state (%) - Other Race
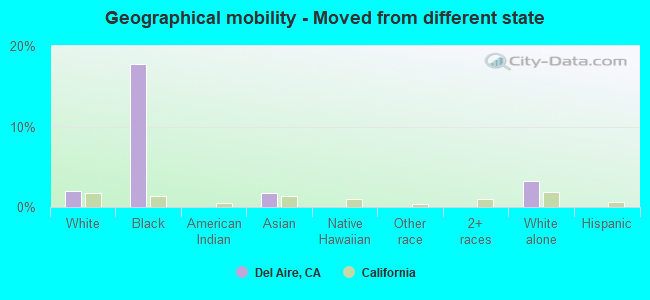
Geographical mobility - Moved from different state (%)
Geographical mobility - Moved from different state (%) - White
Geographical mobility - Moved from different state (%) - Black or African American
Geographical mobility - Moved from different state (%) - Asian
Geographical mobility - Moved from different state (%) - Hispanic or Latino
Geographical mobility - Moved from different state (%) - American Indian and Alaska Native
Geographical mobility - Moved from different state (%) - Multirace
Geographical mobility - Moved from different state (%) - Other Race
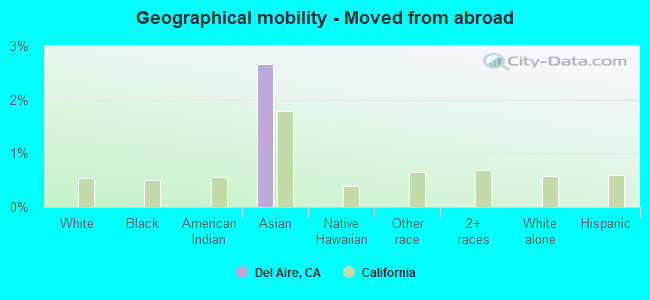
Geographical mobility - Moved from abroad (%)
Geographical mobility - Moved from abroad (%) - White
Geographical mobility - Moved from abroad (%) - Black or African American
Geographical mobility - Moved from abroad (%) - Asian
Geographical mobility - Moved from abroad (%) - Hispanic or Latino
Geographical mobility - Moved from abroad (%) - American Indian and Alaska Native
Geographical mobility - Moved from abroad (%) - Multirace
Geographical mobility - Moved from abroad (%) - Other Race
Place of birth for the foreign-born population - Ireland (%)
Place of birth for the foreign-born population - Denmark (%)
Place of birth for the foreign-born population - Norway (%)
Place of birth for the foreign-born population - Sweden (%)
Place of birth for the foreign-born population - United Kingdom (%)
Place of birth for the foreign-born population - England (%)
Place of birth for the foreign-born population - Scotland (%)
Place of birth for the foreign-born population - Other Northern Europe (%)
Place of birth for the foreign-born population - Austria (%)
Place of birth for the foreign-born population - Belgium (%)
Place of birth for the foreign-born population - France (%)
Place of birth for the foreign-born population - Germany (%)
Place of birth for the foreign-born population - Netherlands (%)
Place of birth for the foreign-born population - Switzerland (%)
Place of birth for the foreign-born population - Other Western Europe (%)
Place of birth for the foreign-born population - Greece (%)
Place of birth for the foreign-born population - Italy (%)
Place of birth for the foreign-born population - Portugal (%)
Place of birth for the foreign-born population - Spain (%)
Place of birth for the foreign-born population - Other Southern Europe (%)
Place of birth for the foreign-born population - Albania (%)
Place of birth for the foreign-born population - Belarus (%)
Place of birth for the foreign-born population - Bosnia and Herzegovina (%)
Place of birth for the foreign-born population - Bulgaria (%)
Place of birth for the foreign-born population - Croatia (%)
Place of birth for the foreign-born population - Czechoslovakia (%)
Place of birth for the foreign-born population - Hungary (%)
Place of birth for the foreign-born population - Latvia (%)
Place of birth for the foreign-born population - Lithuania (%)
Place of birth for the foreign-born population - North Macedonia (Macedonia) (%)
Place of birth for the foreign-born population - Moldova (%)
Place of birth for the foreign-born population - Poland (%)
Place of birth for the foreign-born population - Romania (%)
Place of birth for the foreign-born population - Russia (%)
Place of birth for the foreign-born population - Serbia (%)
Place of birth for the foreign-born population - Ukraine (%)
Place of birth for the foreign-born population - Other Eastern Europe (%)
Place of birth for the foreign-born population - China (%)
Place of birth for the foreign-born population - Hong Kong (%)
Place of birth for the foreign-born population - Taiwan (%)
Place of birth for the foreign-born population - Japan (%)
Place of birth for the foreign-born population - Korea (%)
Place of birth for the foreign-born population - Other Eastern Asia (%)
Place of birth for the foreign-born population - Afghanistan (%)
Place of birth for the foreign-born population - Bangladesh (%)
Place of birth for the foreign-born population - India (%)
Place of birth for the foreign-born population - Iran (%)
Place of birth for the foreign-born population - Kazakhstan (%)
Place of birth for the foreign-born population - Nepal (%)
Place of birth for the foreign-born population - Pakistan (%)
Place of birth for the foreign-born population - Sri Lanka (%)
Place of birth for the foreign-born population - Uzbekistan (%)
Place of birth for the foreign-born population - Other South Central Asia (%)
Place of birth for the foreign-born population - Burma (%)
Place of birth for the foreign-born population - Cambodia (%)
Place of birth for the foreign-born population - Indonesia (%)
Place of birth for the foreign-born population - Laos (%)
Place of birth for the foreign-born population - Malaysia (%)
Place of birth for the foreign-born population - Philippines (%)
Place of birth for the foreign-born population - Singapore (%)
Place of birth for the foreign-born population - Thailand (%)
Place of birth for the foreign-born population - Vietnam (%)
Place of birth for the foreign-born population - Other South Eastern Asia (%)
Place of birth for the foreign-born population - Armenia (%)
Place of birth for the foreign-born population - Iraq (%)
Place of birth for the foreign-born population - Israel (%)
Place of birth for the foreign-born population - Jordan (%)
Place of birth for the foreign-born population - Kuwait (%)
Place of birth for the foreign-born population - Lebanon (%)
Place of birth for the foreign-born population - Saudi Arabia (%)
Place of birth for the foreign-born population - Syria (%)
Place of birth for the foreign-born population - Turkey (%)
Place of birth for the foreign-born population - Yemen (%)
Place of birth for the foreign-born population - Other Western Asia (%)
Place of birth for the foreign-born population - Eritrea (%)
Place of birth for the foreign-born population - Ethiopia (%)
Place of birth for the foreign-born population - Kenya (%)
Place of birth for the foreign-born population - Somalia (%)
Place of birth for the foreign-born population - Uganda (%)
Place of birth for the foreign-born population - Zimbabwe (%)
Place of birth for the foreign-born population - Other Eastern Africa (%)
Place of birth for the foreign-born population - Cameroon (%)
Place of birth for the foreign-born population - Congo (%)
Place of birth for the foreign-born population - Democratic Republic of Congo (Zaire) (%)
Place of birth for the foreign-born population - Other Middle Africa (%)
Place of birth for the foreign-born population - Egypt (%)
Place of birth for the foreign-born population - Morocco (%)
Place of birth for the foreign-born population - Sudan (%)
Place of birth for the foreign-born population - Other Northern Africa (%)
Place of birth for the foreign-born population - South Africa (%)
Place of birth for the foreign-born population - Other Southern Africa (%)
Place of birth for the foreign-born population - Cabo Verde (%)
Place of birth for the foreign-born population - Ghana (%)
Place of birth for the foreign-born population - Liberia (%)
Place of birth for the foreign-born population - Nigeria (%)
Place of birth for the foreign-born population - Senegal (%)
Place of birth for the foreign-born population - Sierra Leone (%)
Place of birth for the foreign-born population - Other Western Africa (%)
Place of birth for the foreign-born population - Australia (%)
Place of birth for the foreign-born population - New Zealand (%)
Place of birth for the foreign-born population - Fiji (%)
Place of birth for the foreign-born population - Micronesia (%)
Place of birth for the foreign-born population - Bahamas (%)
Place of birth for the foreign-born population - Barbados (%)
Place of birth for the foreign-born population - Cuba (%)
Place of birth for the foreign-born population - Dominica (%)
Place of birth for the foreign-born population - Dominican Republic (%)
Place of birth for the foreign-born population - Grenada (%)
Place of birth for the foreign-born population - Haiti (%)
Place of birth for the foreign-born population - Jamaica (%)
Place of birth for the foreign-born population - St. Vincent and the Grenadines (%)
Place of birth for the foreign-born population - Trinidad and Tobago (%)
Place of birth for the foreign-born population - West Indies (%)
Place of birth for the foreign-born population - Other Caribbean (%)
Place of birth for the foreign-born population - Belize (%)
Place of birth for the foreign-born population - Costa Rica (%)
Place of birth for the foreign-born population - El Salvador (%)
Place of birth for the foreign-born population - Guatemala (%)
Place of birth for the foreign-born population - Honduras (%)
Place of birth for the foreign-born population - Mexico (%)
Place of birth for the foreign-born population - Nicaragua (%)
Place of birth for the foreign-born population - Panama (%)
Place of birth for the foreign-born population - Other Central America (%)
Place of birth for the foreign-born population - Argentina (%)
Place of birth for the foreign-born population - Bolivia (%)
Place of birth for the foreign-born population - Brazil (%)
Place of birth for the foreign-born population - Chile (%)
Place of birth for the foreign-born population - Colombia (%)
Place of birth for the foreign-born population - Ecuador (%)
Place of birth for the foreign-born population - Guyana (%)
Place of birth for the foreign-born population - Peru (%)
Place of birth for the foreign-born population - Uruguay (%)
Place of birth for the foreign-born population - Venezuela (%)
Place of birth for the foreign-born population - Other South America (%)
Place of birth for the foreign-born population - Canada (%)
Place of birth for the foreign-born population - Other Northern America (%)
Place of birth for the foreign-born population - Other (%)
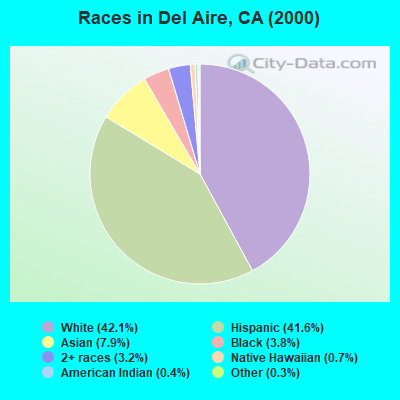
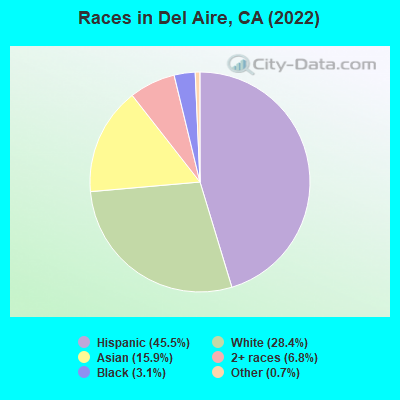
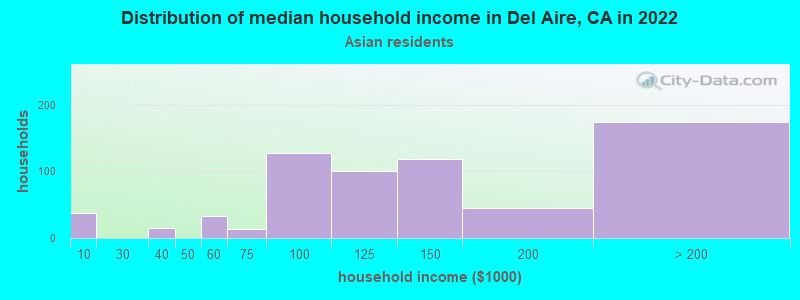
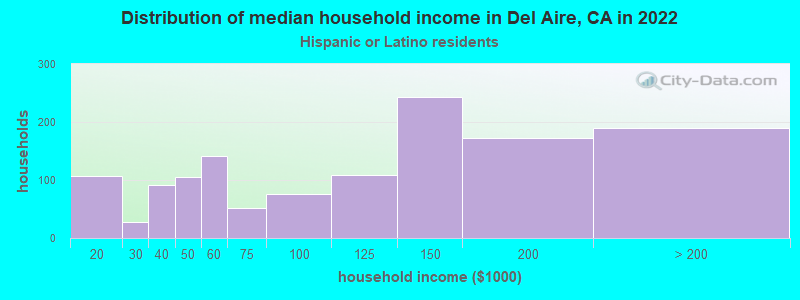
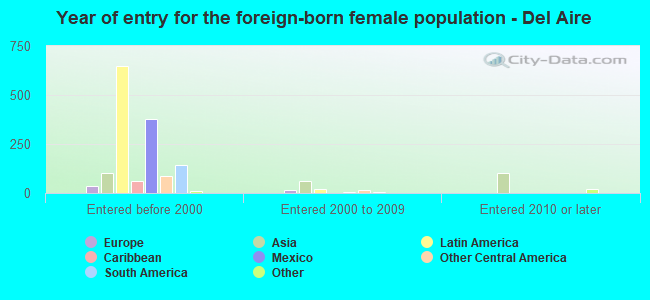
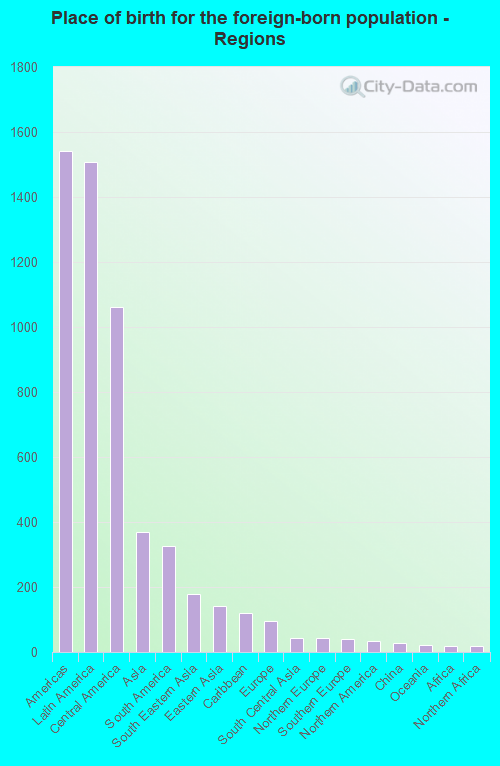
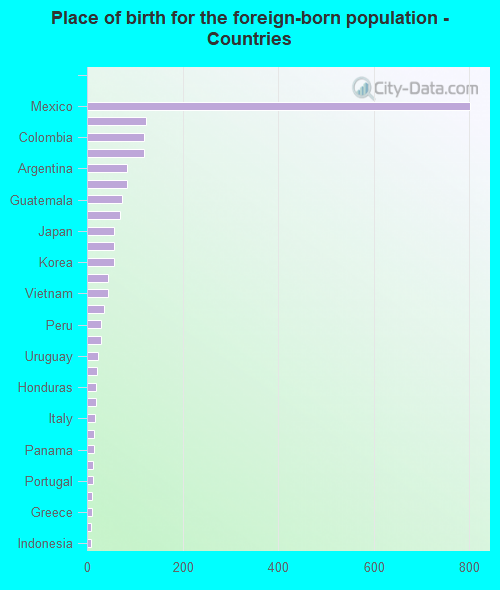
According to 2022 data, the most numerous races in Del Aire, CA are Hispanic (4,618 residents), White alone (2,918 residents), and Asian alone (833 residents). 57.1% of Del Aire residents speak English at home. 20.6% of Del Aire, CA residents are foreign-born (14.9% born in Latin America, 3.7% born in Asia), which is 26.4% less than the foreign-born rate of 26.0% across the entire state of California.
Race distribution in Del Aire
2000 2022
15,816,790 46.7% White alone 10,966,556 32.4% Hispanic 3,648,860 10.8% Asian alone 2,181,926 6.4% Black alone 903,115 2.7% Two or more races 178,984 0.5% American Indian alone 103,736 0.3% Native Hawaiian and Other 71,681 0.2% Other race alone
15,732,184 40.3% Hispanic 13,160,426 33.7% White alone 5,957,867 15.3% Asian alone 2,025,218 5.2% Black alone 1,663,222 4.3% Two or more races 251,618 0.6% Other race alone 135,777 0.3% Native Hawaiian and Other 103,030 0.3% American Indian alone
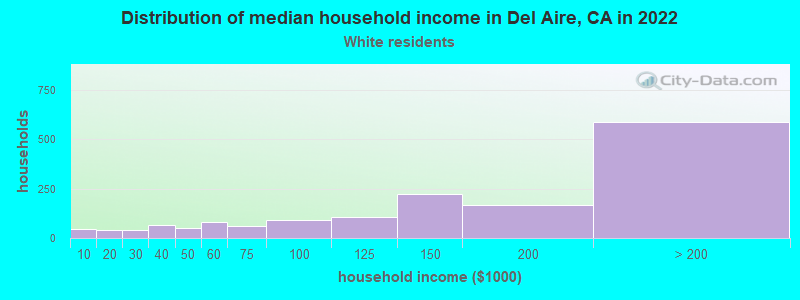
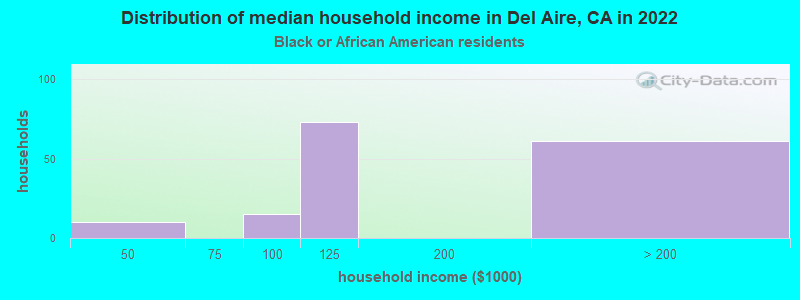
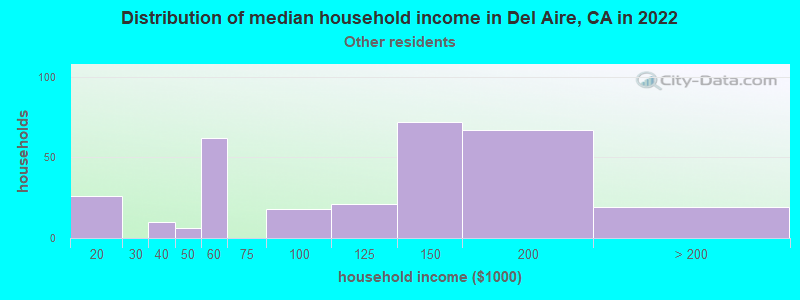
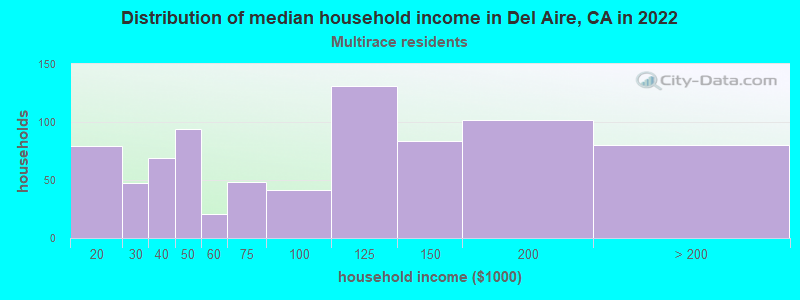
Income and house value in Del Aire Median household income in 2022 $142,290 White non-Hispanic householders$85,549 Black householders$65,594 American Indian and Alaska Native householders$164,660 Asian householders$160,576 Native Hawaiian and other Pacific Islander householders$148,267 Some other race householders$115,389 Two or more races householders$144,613 Hispanic or Latino race householdersMedian 2022 house value $678,467 White Non-Hispanic householders$664,430 Black or African American householders$809,841 American Indian or Alaska Native householders $658,671 Asian householders$674,868 Native Hawaiian and other Pacific Islander householders$660,830 Some other race householders$693,224 Two or more races householders$675,227 Hispanic or Latino householders
Median age by race in Del Aire
41.0 Median age for White residents40.1 42.2 41.8 Median age for Black or African American residents42.2 39.9 33.3 Median age for American Indian / Alaska Native residents35.8 5.5 35.7 Median age for Asian residents34.9 36.3 19.3 Median age for Native Hawaiian / Pacific Islander residents34.1 Median age for Other race residents30.4 39.0 17.3 Median age for Two or more races residents13.4 26.2 39.7 Median age for White alone residents38.7 43.1 33.2 Median age for Hispanic or Latino residents32.4 33.8
Owner/renter occupied households by race in Del Aire
House owners and renters - White residents 1,275 71.7% Owner occupied503 28.3% Renter occupiedHouse owners and renters - Black or African American residents 106 32.0% Owner occupied225 68.0% Renter occupiedHouse owners and renters - American Indian / Alaska Native residents 12 100.0% Owner occupiedHouse owners and renters - Asian residents 135 35.8% Owner occupied242 64.2% Renter occupiedHouse owners and renters - Native Hawaiian / Pacific Islander residents 13 100.0% Renter occupiedHouse owners and renters - Other race residents 459 85.0% Owner occupied81 15.0% Renter occupiedHouse owners and renters - Two or more races residents 134 55.0% Owner occupied110 45.0% Renter occupiedHouse owners and renters - White alone residents 868 69.8% Owner occupied376 30.2% Renter occupiedHouse owners and renters - Hispanic or Latino residents 995 77.3% Owner occupied292 22.7% Renter occupied
Language usage in Del Aire
English speakers - Total 57.1% of residents of Del Aire speak English at home.
34.6% of residents speak Spanish at home 2,550 76.1% Speak English very well801 23.9% Speak English less than very well8.4% of residents speak other language at home 547 67.0% Speak English very well269 33.0% Speak English less than very well
English speakers - Born in the United States 85.8% of residents of Del Aire speak English at home.
5.7% of residents speak Spanish at home 86 84.3% Speak English very well16 15.7% Speak English less than very well8.9% of residents speak other language at home 160 100.0% Speak English very well
All residents speak only English at home
English speakers - Foreign-born 11.9% of residents of Del Aire speak English at home.
68.5% of residents speak Spanish at home 663 48.5% Speak English very well705 51.5% Speak English less than very well18.8% of residents speak other language at home 120 32.0% Speak English very well255 68.0% Speak English less than very well
White (Caucasian) - Speak only English Native:
77.5% (3,024)Foreign-born:
18.1% (107)
White (Caucasian) - Speak another language Native:
20.1% (785)Foreign-born:
81.7% (484)
Asian - Speak only English Native:
30.0% (152)Foreign-born:
16.9% (59)
Asian - Speak another language Native:
68.1% (346)Foreign-born:
83.7% (294)
Other race - Speak only English Native:
23.7% (274)Foreign-born:
5.5% (40)
Other race - Speak another language Native:
75.2% (869)Foreign-born:
94.5% (686)
Two or more races - Speak only English Native:
70.4% (1,245)Foreign-born:
28.2% (37)
Two or more races - Speak another language Native:
17.5% (309)Foreign-born:
54.4% (71)
White alone - Speak only English Native:
93.9% (2,443)Foreign-born:
55.7% (85)
White alone - Speak another language Native:
6.1% (159)Foreign-born:
42.6% (65)
Hispanic or Latino - Speak only English Native:
37.5% (1,182)Foreign-born:
6.3% (88)
Hispanic or Latino - Speak another language Native:
62.2% (1,960)Foreign-born:
93.8% (1,313)
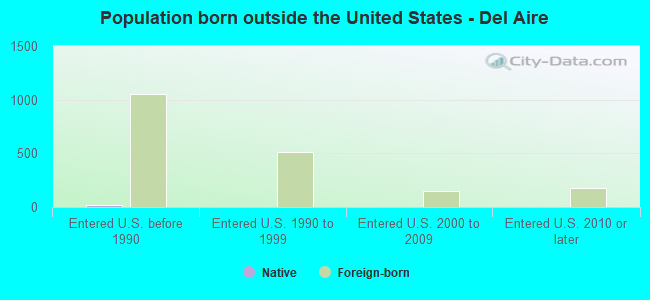
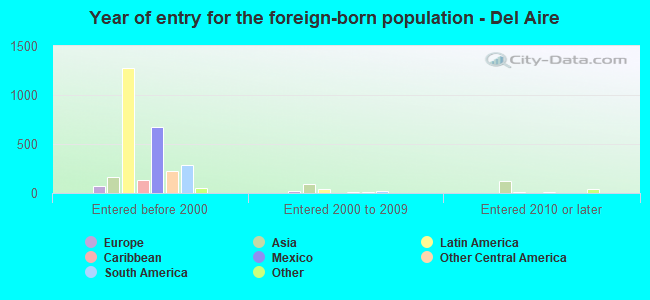
Foreign-born residents in Del Aire 2,050 residents are foreign born (14.9% Latin America , 3.7% Asia ).
This city:
20.6%California:
100.0%
Marital status for residents in Del Aire Marital status - White (Caucasian) population 15 years and over
Males 35.9% Never married54.3% Now married0.5% Separated2.7% Widowed6.6% DivorcedFemales 29.7% Never married49.1% Now married1.4% Separated9.1% Widowed10.7% DivorcedWomen who gave birth in the past 12 months Now married:
82.4% (44)Unmarried:
17.6% (9)
Women who did not give birth in the past 12 months Now married:
45.0% (446)Unmarried:
55.0% (545)
Marital status - Black or African American population 15 years and over
Males 38.2% Never married40.6% Now married6.4% Separated8.7% Widowed6.2% DivorcedFemales 37.6% Never married32.4% Now married0.0% Separated0.0% Widowed30.0% DivorcedWomen who did not give birth in the past 12 months Now married:
11.4% (12)Unmarried:
88.6% (93)
Marital status - American Indian / Alaska Native population 15 years and over
Males 0.0% Never married86.4% Now married13.6% Separated0.0% Widowed0.0% DivorcedFemales 0.0% Never married100.0% Now married0.0% Separated0.0% Widowed0.0% DivorcedWomen who gave birth in the past 12 months Now married:
100.0% (16)Unmarried:
0.0% (0)
Women who did not give birth in the past 12 months Now married:
100.0% (12)Unmarried:
0.0% (0)
Marital status - Asian population 15 years and over
Males 59.0% Never married18.9% Now married0.0% Separated16.7% Widowed5.4% DivorcedFemales 34.6% Never married47.2% Now married0.0% Separated10.9% Widowed7.3% DivorcedWomen who gave birth in the past 12 months Now married:
100.0% (13)Unmarried:
0.0% (0)
Women who did not give birth in the past 12 months Now married:
44.8% (136)Unmarried:
55.2% (168)
Marital status - Native Hawaiian / Pacific Islander population 15 years and over
Males 70.7% Never married29.3% Now married0.0% Separated0.0% Widowed0.0% DivorcedFemales 57.7% Never married42.3% Now married0.0% Separated0.0% Widowed0.0% DivorcedWomen who did not give birth in the past 12 months Now married:
0.0% (0)Unmarried:
100.0% (14)
Marital status - Other race population 15 years and over
Males 44.0% Never married53.1% Now married0.0% Separated0.0% Widowed2.9% DivorcedFemales 35.2% Never married50.9% Now married6.4% Separated0.8% Widowed6.7% DivorcedWomen who gave birth in the past 12 months Now married:
73.2% (44)Unmarried:
26.8% (16)
Women who did not give birth in the past 12 months Now married:
48.5% (222)Unmarried:
51.5% (236)
Marital status - Two or more races population 15 years and over
Males 57.5% Never married42.5% Now married0.0% Separated0.0% Widowed0.0% DivorcedFemales 21.6% Never married66.8% Now married0.0% Separated5.3% Widowed6.3% DivorcedWomen who did not give birth in the past 12 months Now married:
73.4% (365)Unmarried:
26.6% (132)
Marital status - White alone, not Hispanic / Latino population 15 years and over
Males 37.3% Never married51.2% Now married0.9% Separated2.5% Widowed8.2% DivorcedFemales 26.0% Never married54.3% Now married1.8% Separated8.9% Widowed8.9% DivorcedWomen who gave birth in the past 12 months Now married:
79.7% (43)Unmarried:
20.3% (11)
Women who did not give birth in the past 12 months Now married:
54.4% (298)Unmarried:
45.6% (250)
Marital status - Hispanic or Latino population 15 years and over
Males 39.2% Never married55.8% Now married0.0% Separated1.6% Widowed3.4% DivorcedFemales 34.7% Never married46.2% Now married3.0% Separated5.6% Widowed10.4% DivorcedWomen who gave birth in the past 12 months Now married:
80.3% (61)Unmarried:
19.7% (15)
Women who did not give birth in the past 12 months Now married:
40.8% (454)Unmarried:
59.2% (660)
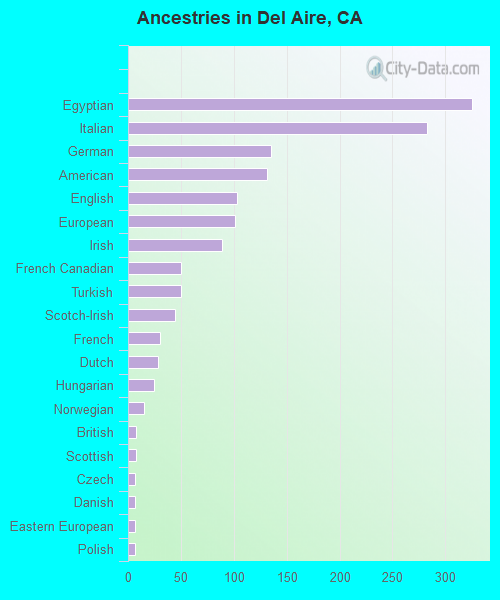
Ancestries in Del Aire
238 4.4% English180 3.3% Irish135 2.5% German114 2.1% American75 1.4% Italian54 1.0% European42 0.8% Scotch-Irish28 0.5% Dutch22 0.4% French22 0.4% Scottish19 0.4% Norwegian16 0.3% Greek15 0.3% British15 0.3% African11 0.2% Armenian11 0.2% Hungarian7 0.1% Eastern European7 0.1% French Canadian
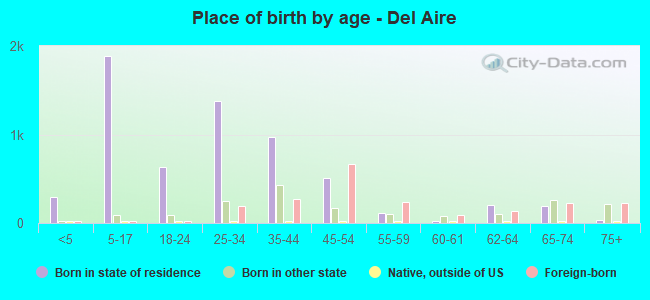
Children Nativity (place of birth) in Del Aire
Children under 6 years - Living with two parents Both parents native 242 100.0% NativeBoth parents foreign-born 13 100.0% NativeOne native, one foreign-born parent 126 100.0% NativeChildren under 6 years - Living with one parent Native parent 44 89.4% Native5 10.6% Foreign-bornChildren 6 to 17 years - Living with two parents Both parents native 628 100.0% NativeBoth parents foreign-born 404 100.0% NativeOne native, one foreign-born parent 376 100.0% NativeChildren 6 to 17 years - Living with one parent Native parent 328 100.0% NativeForeign-born parent 53 53.3% Native46 46.7% Foreign-born
Grandparents responsible for own grandchildren in Del Aire
Grandparents (30 to 59 years) White / Caucasian 22 100.0% Not responsible for grandchildrenNative Hawaiian / Pacific Islander 10 43.6% Responsible for grandchildren13 56.4% Not responsible for grandchildrenOther race 14 53.0% Responsible for grandchildren13 47.0% Not responsible for grandchildrenHispanic or Latino 11 20.3% Responsible for grandchildren45 79.7% Not responsible for grandchildren
Grandparents (60 years and over) White / Caucasian 10 100.0% Responsible for grandchildrenOther race 17 100.0% Not responsible for grandchildrenHispanic or Latino 26 100.0% Not responsible for grandchildren