Races in Deming, New Mexico (NM) Detailed Stats
Data:
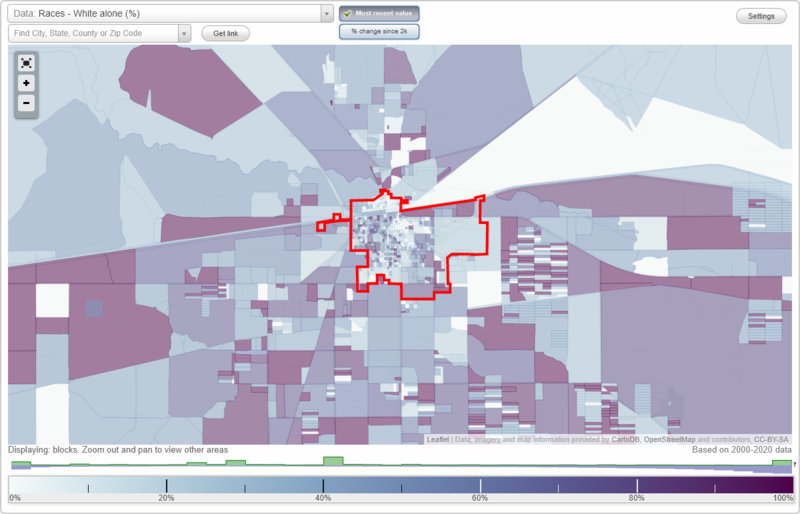
Races - White alone (%)
Races - White alone (% change since 2000)
Races - Black alone (%)
Races - Black alone (% change since 2000)
Races - American Indian alone (%)
Races - American Indian alone (% change since 2000)
Races - Asian alone (%)
Races - Asian alone (% change since 2000)
Races - Hispanic (%)
Races - Hispanic (% change since 2000)
Races - Native Hawaiian and Other Pacific Islander alone (%)
Races - Native Hawaiian and Other Pacific Islander alone (% change since 2000)
Races - Two or more races(%)
Races - Two or more races(% change since 2000)
Races - Other race alone (%)
Races - Other race alone (% change since 2000)
Racial diversity
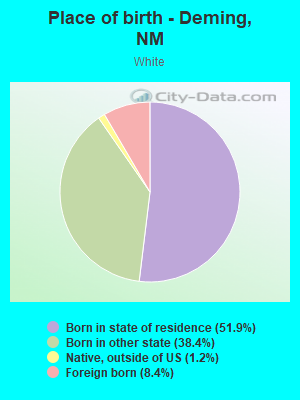
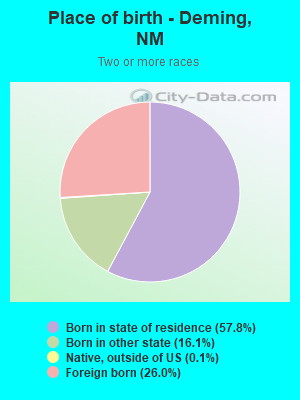
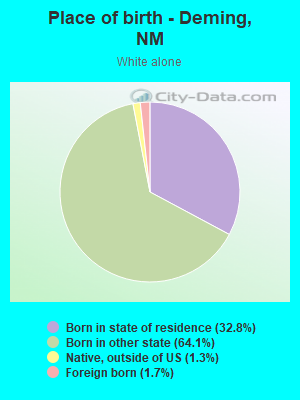
Place of birth - Born in state of residence (%)
Place of birth - Born in state of residence (%) - White
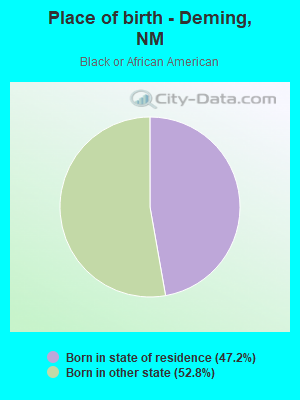
Place of birth - Born in state of residence (%) - Black or African American
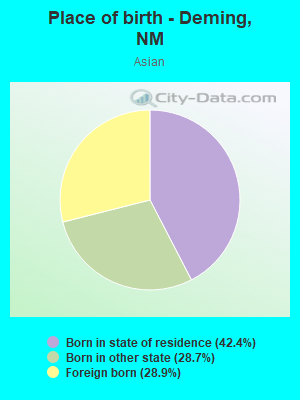
Place of birth - Born in state of residence (%) - Asian
Place of birth - Born in state of residence (%) - Hispanic or Latino
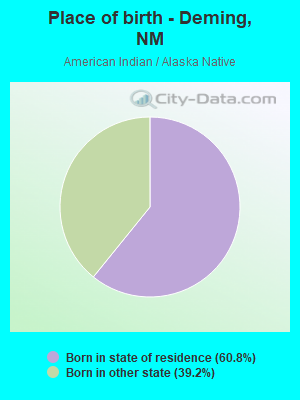
Place of birth - Born in state of residence (%) - American Indian and Alaska Native
Place of birth - Born in state of residence (%) - Multirace
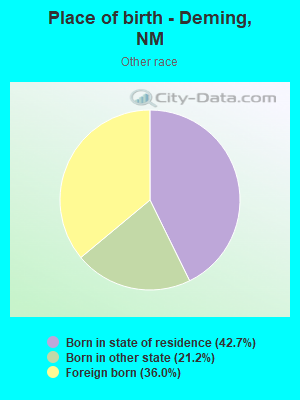
Place of birth - Born in state of residence (%) - Other Race
Place of birth - Born in other state (%)
Place of birth - Born in other state (%) - White
Place of birth - Born in other state (%) - Black or African American
Place of birth - Born in other state (%) - Asian
Place of birth - Born in other state (%) - Hispanic or Latino
Place of birth - Born in other state (%) - American Indian and Alaska Native
Place of birth - Born in other state (%) - Multirace
Place of birth - Born in other state (%) - Other Race
Place of birth - Native, outside of US (%)
Place of birth - Native, outside of US (%) - White
Place of birth - Native, outside of US (%) - Black or African American
Place of birth - Native, outside of US (%) - Asian
Place of birth - Native, outside of US (%) - Hispanic or Latino
Place of birth - Native, outside of US (%) - American Indian and Alaska Native
Place of birth - Native, outside of US (%) - Multirace
Place of birth - Native, outside of US (%) - Other Race
Place of birth - Foreign born (%)
Place of birth - Foreign born (%) - White
Place of birth - Foreign born (%) - Black or African American
Place of birth - Foreign born (%) - Asian
Place of birth - Foreign born (%) - Hispanic or Latino
Place of birth - Foreign born (%) - American Indian and Alaska Native
Place of birth - Foreign born (%) - Multirace
Place of birth - Foreign born (%) - Other Race
Residents speaking English at home (%)
Residents speaking English at home - Born in the United States (%)
Residents speaking English at home - Native, born elsewhere (%)
Residents speaking English at home - Foreign born (%)
Residents speaking Spanish at home (%)
Residents speaking Spanish at home - Born in the United States (%)
Residents speaking Spanish at home - Native, born elsewhere (%)
Residents speaking Spanish at home - Foreign born (%)
Residents speaking other language at home (%)
Residents speaking other language at home - Born in the United States (%)
Residents speaking other language at home - Native, born elsewhere (%)
Residents speaking other language at home - Foreign born (%)
Marital status - Never married (%)
Marital status - Now married (%)
Marital status - Separated (%)
Marital status - Widowed (%)
Marital status - Divorced (%)
Ancestries Reported - Arab (%)
Ancestries Reported - Czech (%)
Ancestries Reported - Danish (%)
Ancestries Reported - Dutch (%)
Ancestries Reported - English (%)
Ancestries Reported - French (%)
Ancestries Reported - French Canadian (%)
Ancestries Reported - German (%)
Ancestries Reported - Greek (%)
Ancestries Reported - Hungarian (%)
Ancestries Reported - Irish (%)
Ancestries Reported - Italian (%)
Ancestries Reported - Lithuanian (%)
Ancestries Reported - Norwegian (%)
Ancestries Reported - Polish (%)
Ancestries Reported - Portuguese (%)
Ancestries Reported - Russian (%)
Ancestries Reported - Scotch-Irish (%)
Ancestries Reported - Scottish (%)
Ancestries Reported - Slovak (%)
Ancestries Reported - Subsaharan African (%)
Ancestries Reported - Swedish (%)
Ancestries Reported - Swiss (%)
Ancestries Reported - Ukrainian (%)
Ancestries Reported - United States (%)
Ancestries Reported - Welsh (%)
Ancestries Reported - West Indian (%)
Ancestries Reported - Other (%)
Geographical mobility - Same house 1 year ago (%)
Geographical mobility - Same house 1 year ago (%) - White
Geographical mobility - Same house 1 year ago (%) - Black or African American
Geographical mobility - Same house 1 year ago (%) - Asian
Geographical mobility - Same house 1 year ago (%) - Hispanic or Latino
Geographical mobility - Same house 1 year ago (%) - American Indian and Alaska Native
Geographical mobility - Same house 1 year ago (%) - Multirace
Geographical mobility - Same house 1 year ago (%) - Other Race
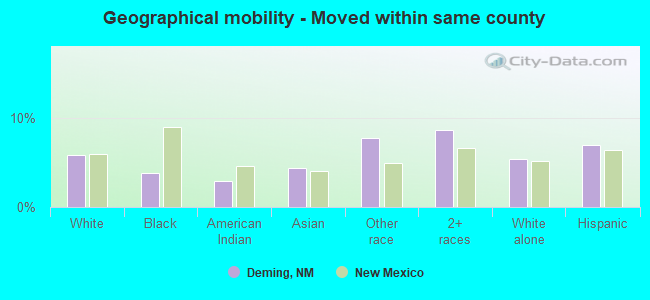
Geographical mobility - Moved within same county (%)
Geographical mobility - Moved within same county (%) - White
Geographical mobility - Moved within same county (%) - Black or African American
Geographical mobility - Moved within same county (%) - Asian
Geographical mobility - Moved within same county (%) - Hispanic or Latino
Geographical mobility - Moved within same county (%) - American Indian and Alaska Native
Geographical mobility - Moved within same county (%) - Multirace
Geographical mobility - Moved within same county (%) - Other Race
Geographical mobility - Moved from different county within same state (%)
Geographical mobility - Moved from different county within same state (%) - White
Geographical mobility - Moved from different county within same state (%) - Black or African American
Geographical mobility - Moved from different county within same state (%) - Asian
Geographical mobility - Moved from different county within same state (%) - Hispanic or Latino
Geographical mobility - Moved from different county within same state (%) - American Indian and Alaska Native
Geographical mobility - Moved from different county within same state (%) - Multirace
Geographical mobility - Moved from different county within same state (%) - Other Race
Geographical mobility - Moved from different state (%)
Geographical mobility - Moved from different state (%) - White
Geographical mobility - Moved from different state (%) - Black or African American
Geographical mobility - Moved from different state (%) - Asian
Geographical mobility - Moved from different state (%) - Hispanic or Latino
Geographical mobility - Moved from different state (%) - American Indian and Alaska Native
Geographical mobility - Moved from different state (%) - Multirace
Geographical mobility - Moved from different state (%) - Other Race
Geographical mobility - Moved from abroad (%)
Geographical mobility - Moved from abroad (%) - White
Geographical mobility - Moved from abroad (%) - Black or African American
Geographical mobility - Moved from abroad (%) - Asian
Geographical mobility - Moved from abroad (%) - Hispanic or Latino
Geographical mobility - Moved from abroad (%) - American Indian and Alaska Native
Geographical mobility - Moved from abroad (%) - Multirace
Geographical mobility - Moved from abroad (%) - Other Race
Place of birth for the foreign-born population - Ireland (%)
Place of birth for the foreign-born population - Denmark (%)
Place of birth for the foreign-born population - Norway (%)
Place of birth for the foreign-born population - Sweden (%)
Place of birth for the foreign-born population - United Kingdom (%)
Place of birth for the foreign-born population - England (%)
Place of birth for the foreign-born population - Scotland (%)
Place of birth for the foreign-born population - Other Northern Europe (%)
Place of birth for the foreign-born population - Austria (%)
Place of birth for the foreign-born population - Belgium (%)
Place of birth for the foreign-born population - France (%)
Place of birth for the foreign-born population - Germany (%)
Place of birth for the foreign-born population - Netherlands (%)
Place of birth for the foreign-born population - Switzerland (%)
Place of birth for the foreign-born population - Other Western Europe (%)
Place of birth for the foreign-born population - Greece (%)
Place of birth for the foreign-born population - Italy (%)
Place of birth for the foreign-born population - Portugal (%)
Place of birth for the foreign-born population - Spain (%)
Place of birth for the foreign-born population - Other Southern Europe (%)
Place of birth for the foreign-born population - Albania (%)
Place of birth for the foreign-born population - Belarus (%)
Place of birth for the foreign-born population - Bosnia and Herzegovina (%)
Place of birth for the foreign-born population - Bulgaria (%)
Place of birth for the foreign-born population - Croatia (%)
Place of birth for the foreign-born population - Czechoslovakia (%)
Place of birth for the foreign-born population - Hungary (%)
Place of birth for the foreign-born population - Latvia (%)
Place of birth for the foreign-born population - Lithuania (%)
Place of birth for the foreign-born population - North Macedonia (Macedonia) (%)
Place of birth for the foreign-born population - Moldova (%)
Place of birth for the foreign-born population - Poland (%)
Place of birth for the foreign-born population - Romania (%)
Place of birth for the foreign-born population - Russia (%)
Place of birth for the foreign-born population - Serbia (%)
Place of birth for the foreign-born population - Ukraine (%)
Place of birth for the foreign-born population - Other Eastern Europe (%)
Place of birth for the foreign-born population - China (%)
Place of birth for the foreign-born population - Hong Kong (%)
Place of birth for the foreign-born population - Taiwan (%)
Place of birth for the foreign-born population - Japan (%)
Place of birth for the foreign-born population - Korea (%)
Place of birth for the foreign-born population - Other Eastern Asia (%)
Place of birth for the foreign-born population - Afghanistan (%)
Place of birth for the foreign-born population - Bangladesh (%)
Place of birth for the foreign-born population - India (%)
Place of birth for the foreign-born population - Iran (%)
Place of birth for the foreign-born population - Kazakhstan (%)
Place of birth for the foreign-born population - Nepal (%)
Place of birth for the foreign-born population - Pakistan (%)
Place of birth for the foreign-born population - Sri Lanka (%)
Place of birth for the foreign-born population - Uzbekistan (%)
Place of birth for the foreign-born population - Other South Central Asia (%)
Place of birth for the foreign-born population - Burma (%)
Place of birth for the foreign-born population - Cambodia (%)
Place of birth for the foreign-born population - Indonesia (%)
Place of birth for the foreign-born population - Laos (%)
Place of birth for the foreign-born population - Malaysia (%)
Place of birth for the foreign-born population - Philippines (%)
Place of birth for the foreign-born population - Singapore (%)
Place of birth for the foreign-born population - Thailand (%)
Place of birth for the foreign-born population - Vietnam (%)
Place of birth for the foreign-born population - Other South Eastern Asia (%)
Place of birth for the foreign-born population - Armenia (%)
Place of birth for the foreign-born population - Iraq (%)
Place of birth for the foreign-born population - Israel (%)
Place of birth for the foreign-born population - Jordan (%)
Place of birth for the foreign-born population - Kuwait (%)
Place of birth for the foreign-born population - Lebanon (%)
Place of birth for the foreign-born population - Saudi Arabia (%)
Place of birth for the foreign-born population - Syria (%)
Place of birth for the foreign-born population - Turkey (%)
Place of birth for the foreign-born population - Yemen (%)
Place of birth for the foreign-born population - Other Western Asia (%)
Place of birth for the foreign-born population - Eritrea (%)
Place of birth for the foreign-born population - Ethiopia (%)
Place of birth for the foreign-born population - Kenya (%)
Place of birth for the foreign-born population - Somalia (%)
Place of birth for the foreign-born population - Uganda (%)
Place of birth for the foreign-born population - Zimbabwe (%)
Place of birth for the foreign-born population - Other Eastern Africa (%)
Place of birth for the foreign-born population - Cameroon (%)
Place of birth for the foreign-born population - Congo (%)
Place of birth for the foreign-born population - Democratic Republic of Congo (Zaire) (%)
Place of birth for the foreign-born population - Other Middle Africa (%)
Place of birth for the foreign-born population - Egypt (%)
Place of birth for the foreign-born population - Morocco (%)
Place of birth for the foreign-born population - Sudan (%)
Place of birth for the foreign-born population - Other Northern Africa (%)
Place of birth for the foreign-born population - South Africa (%)
Place of birth for the foreign-born population - Other Southern Africa (%)
Place of birth for the foreign-born population - Cabo Verde (%)
Place of birth for the foreign-born population - Ghana (%)
Place of birth for the foreign-born population - Liberia (%)
Place of birth for the foreign-born population - Nigeria (%)
Place of birth for the foreign-born population - Senegal (%)
Place of birth for the foreign-born population - Sierra Leone (%)
Place of birth for the foreign-born population - Other Western Africa (%)
Place of birth for the foreign-born population - Australia (%)
Place of birth for the foreign-born population - New Zealand (%)
Place of birth for the foreign-born population - Fiji (%)
Place of birth for the foreign-born population - Micronesia (%)
Place of birth for the foreign-born population - Bahamas (%)
Place of birth for the foreign-born population - Barbados (%)
Place of birth for the foreign-born population - Cuba (%)
Place of birth for the foreign-born population - Dominica (%)
Place of birth for the foreign-born population - Dominican Republic (%)
Place of birth for the foreign-born population - Grenada (%)
Place of birth for the foreign-born population - Haiti (%)
Place of birth for the foreign-born population - Jamaica (%)
Place of birth for the foreign-born population - St. Vincent and the Grenadines (%)
Place of birth for the foreign-born population - Trinidad and Tobago (%)
Place of birth for the foreign-born population - West Indies (%)
Place of birth for the foreign-born population - Other Caribbean (%)
Place of birth for the foreign-born population - Belize (%)
Place of birth for the foreign-born population - Costa Rica (%)
Place of birth for the foreign-born population - El Salvador (%)
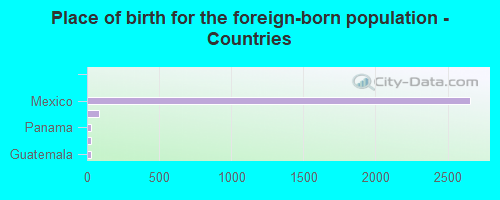
Place of birth for the foreign-born population - Guatemala (%)
Place of birth for the foreign-born population - Honduras (%)
Place of birth for the foreign-born population - Mexico (%)
Place of birth for the foreign-born population - Nicaragua (%)
Place of birth for the foreign-born population - Panama (%)
Place of birth for the foreign-born population - Other Central America (%)
Place of birth for the foreign-born population - Argentina (%)
Place of birth for the foreign-born population - Bolivia (%)
Place of birth for the foreign-born population - Brazil (%)
Place of birth for the foreign-born population - Chile (%)
Place of birth for the foreign-born population - Colombia (%)
Place of birth for the foreign-born population - Ecuador (%)
Place of birth for the foreign-born population - Guyana (%)
Place of birth for the foreign-born population - Peru (%)
Place of birth for the foreign-born population - Uruguay (%)
Place of birth for the foreign-born population - Venezuela (%)
Place of birth for the foreign-born population - Other South America (%)
Place of birth for the foreign-born population - Canada (%)
Place of birth for the foreign-born population - Other Northern America (%)
Place of birth for the foreign-born population - Other (%)
Latest news about races in Deming, NM collected exclusively by city-data.com from local newspapers, TV, and radio stations
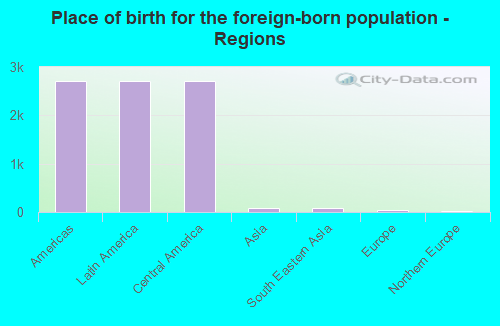
According to 2022 data, the most numerous races in Deming, NM are Hispanic (11,153 residents), White alone (2,982 residents), and American Indian alone (93 residents). 44.7% of Deming residents speak English at home. 19.3% of Deming, NM residents are foreign-born (18.1% born in Latin America), which is 53.3% greater than the foreign-born rate of 9.0% across the entire state of New Mexico.
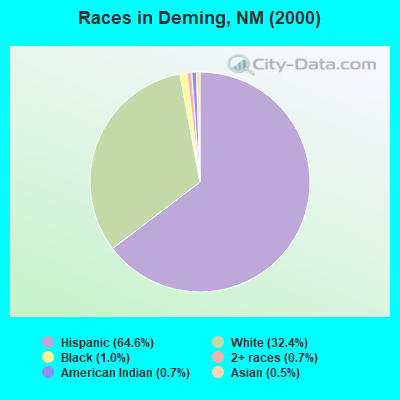
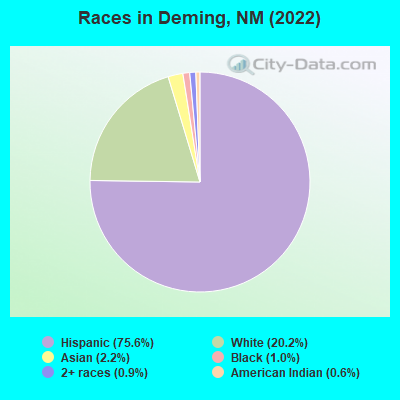
Race distribution in Deming
2000 2022
813,495 44.7% White alone 765,386 42.1% Hispanic 161,460 8.9% American Indian alone 30,654 1.7% Black alone 25,793 1.4% Two or more races 18,257 1.0% Asian alone 3,009 0.2% Other race alone 992 0.05% Native Hawaiian and Other
1,059,867 50.2% Hispanic 735,478 34.8% White alone 171,808 8.1% American Indian alone 65,084 3.1% Two or more races 36,870 1.7% Black alone 35,870 1.7% Asian alone 7,582 0.4% Other race alone 785 0.04% Native Hawaiian and Other
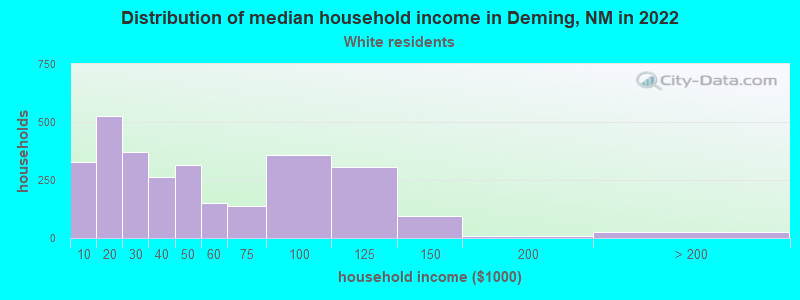
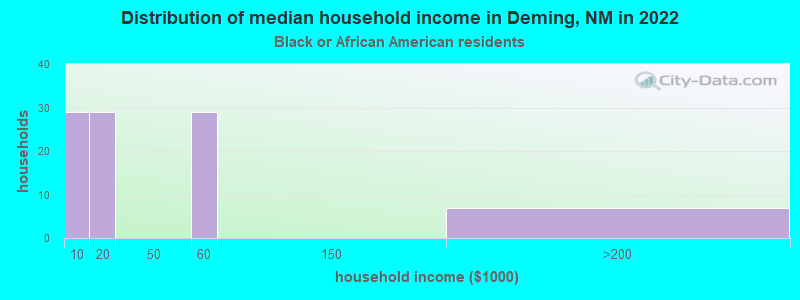
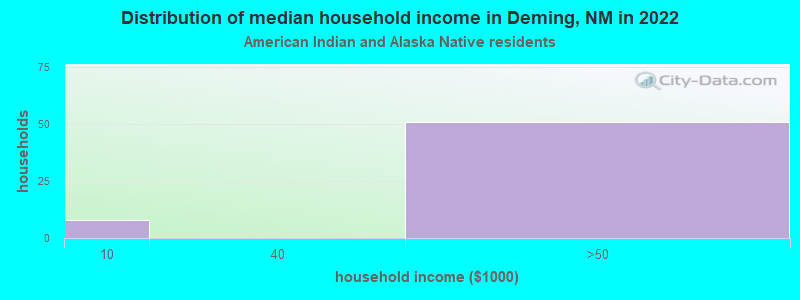
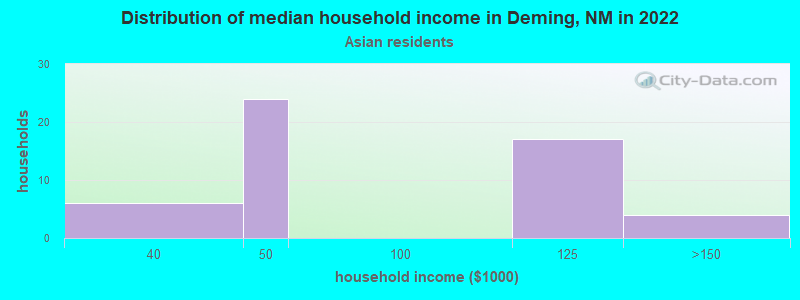
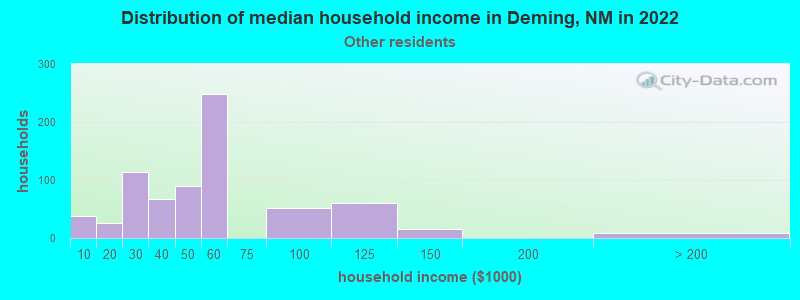
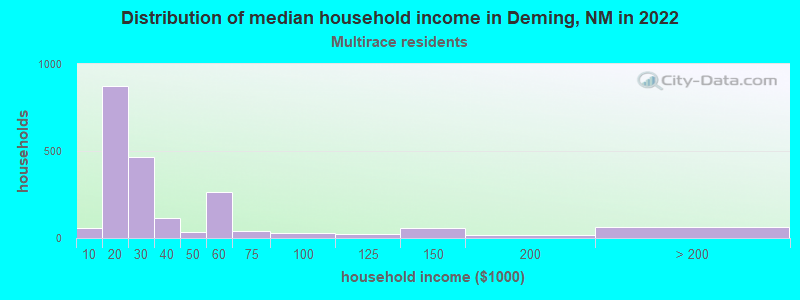
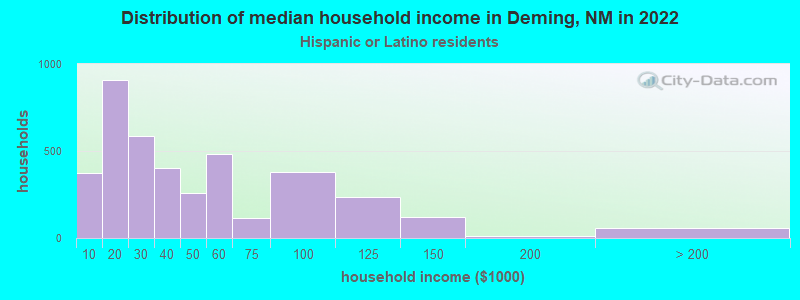
Income and house value in Deming Median household income in 2022 $41,180 White non-Hispanic householders$50,328 Some other race householders$21,799 Two or more races householders$32,206 Hispanic or Latino race householdersMedian 2022 house value $151,713 White Non-Hispanic householders$82,098 Black or African American householders$79,348 American Indian or Alaska Native householders$115,319 Some other race householders$132,035 Two or more races householders$130,977 Hispanic or Latino householders
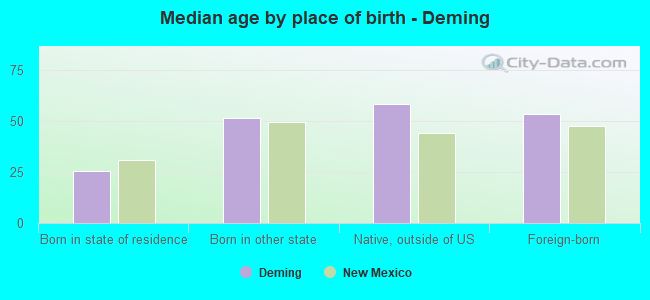
Median age by race in Deming
38.1 Median age for White residents36.7 43.8 32.7 Median age for Black or African American residents33.1 -670,719,350.9 76.0 Median age for American Indian / Alaska Native residents87.4 54.4 11.7 Median age for Asian residents4.0 28.9 -658,511,722.1 Median age for Native Hawaiian / Pacific Islander residents-685,897,435.2 -659,380,691.5 46.8 Median age for Other race residents52.6 39.7 40.0 Median age for Two or more races residents41.2 35.7 60.6 Median age for White alone residents60.9 61.1 33.3 Median age for Hispanic or Latino residents32.5 33.7
Owner/renter occupied households by race in Deming
House owners and renters - White residents 1,774 61.4% Owner occupied1,116 38.6% Renter occupiedHouse owners and renters - Black or African American residents 6 7.1% Owner occupied85 92.9% Renter occupiedHouse owners and renters - American Indian / Alaska Native residents 80 100.0% Owner occupiedHouse owners and renters - Asian residents 26 53.0% Owner occupied23 47.0% Renter occupiedHouse owners and renters - Other race residents 493 67.3% Owner occupied239 32.7% Renter occupiedHouse owners and renters - Two or more races residents 1,488 73.8% Owner occupied527 26.2% Renter occupiedHouse owners and renters - White alone residents 861 60.5% Owner occupied561 39.5% Renter occupiedHouse owners and renters - Hispanic or Latino residents 2,602 66.8% Owner occupied1,293 33.2% Renter occupied
Language usage in Deming
English speakers - Total 44.7% of residents of Deming speak English at home.
54.2% of residents speak Spanish at home 4,639 63.6% Speak English very well2,652 36.4% Speak English less than very well1.0% of residents speak other language at home 96 68.6% Speak English very well44 31.4% Speak English less than very well
English speakers - Born in the United States 65.8% of residents of Deming speak English at home.
33.4% of residents speak Spanish at home 939 70.1% Speak English very well400 29.9% Speak English less than very well2.4% of residents speak other language at home 43 43.9% Speak English very well55 56.1% Speak English less than very well
English speakers - Native, born elsewhere 38.2% of residents of Deming speak English at home.
57.3% of residents speak Spanish at home 26 41.3% Speak English very well37 58.7% Speak English less than very well
English speakers - Foreign-born 7.1% of residents of Deming speak English at home.
88.6% of residents speak Spanish at home 655 26.8% Speak English very well1,788 73.2% Speak English less than very well2.4% of residents speak other language at home 56 83.6% Speak English very well11 16.4% Speak English less than very well
White (Caucasian) - Speak only English Native:
66.9% (3,927)Foreign-born:
22.4% (126)
White (Caucasian) - Speak another language Native:
22.9% (1,346)Foreign-born:
100.0% (562)
Asian - Speak only English Native:
63.4% (77)Foreign-born:
25.2% (23)
Asian - Speak another language Native:
36.5% (44)Foreign-born:
75.6% (69)
Other race - Speak another language Native:
52.2% (498)Foreign-born:
98.8% (603)
Two or more races - Speak another language Native:
75.2% (2,635)Foreign-born:
98.0% (1,331)
White alone - Speak only English Native:
90.6% (2,569)Foreign-born:
100.0% (51)
Hispanic or Latino - Speak only English Native:
38.3% (2,849)Foreign-born:
5.1% (131)
Hispanic or Latino - Speak another language Native:
60.9% (4,530)Foreign-born:
93.4% (2,418)
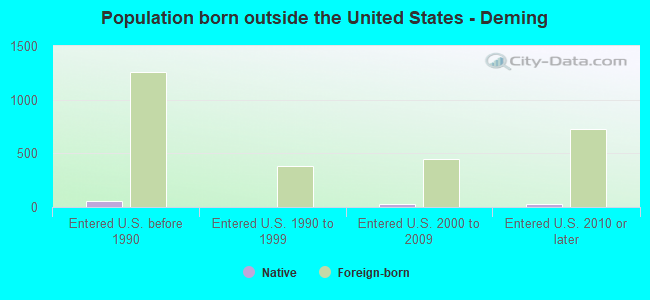
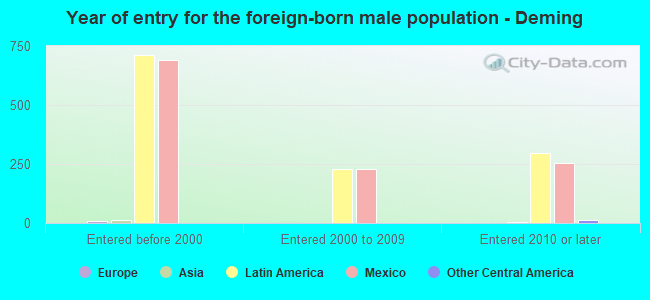
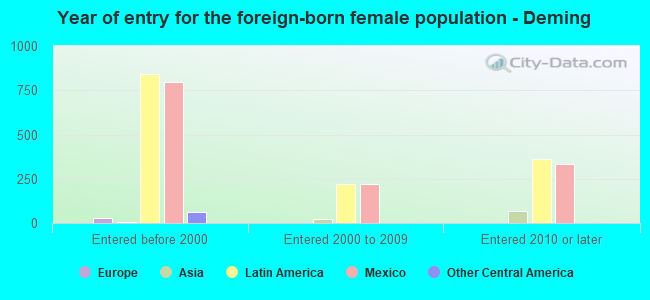
Foreign-born residents in Deming 2,846 residents are foreign born (18.1% Latin America ).
This city:
19.3%New Mexico:
9.2%
Marital status for residents in Deming Marital status - White (Caucasian) population 15 years and over
Males 36.3% Never married45.2% Now married1.6% Separated5.1% Widowed11.9% DivorcedFemales 28.6% Never married36.5% Now married2.2% Separated17.1% Widowed15.7% DivorcedWomen who gave birth in the past 12 months Now married:
100.0% (76)Unmarried:
0.0% (0)
Women who did not give birth in the past 12 months Now married:
44.1% (636)Unmarried:
55.9% (807)
Marital status - Black or African American population 15 years and over
Males 71.3% Never married28.7% Now married0.0% Separated0.0% Widowed0.0% DivorcedFemales 100.0% Never married0.0% Now married0.0% Separated0.0% Widowed0.0% DivorcedWomen who did not give birth in the past 12 months Now married:
0.0% (0)Unmarried:
100.0% (59)
Marital status - American Indian / Alaska Native population 15 years and over
Males 43.0% Never married5.5% Now married0.0% Separated51.6% Widowed0.0% DivorcedFemales 34.6% Never married26.9% Now married0.0% Separated26.9% Widowed11.5% DivorcedWomen who did not give birth in the past 12 months Now married:
0.0% (0)Unmarried:
100.0% (9)
Marital status - Asian population 15 years and over
Males 36.2% Never married63.8% Now married0.0% Separated0.0% Widowed0.0% DivorcedFemales 0.0% Never married100.0% Now married0.0% Separated0.0% Widowed0.0% DivorcedWomen who gave birth in the past 12 months Now married:
100.0% (14)Unmarried:
0.0% (0)
Women who did not give birth in the past 12 months Now married:
100.0% (45)Unmarried:
0.0% (0)
Marital status - Other race population 15 years and over
Males 26.8% Never married62.0% Now married1.6% Separated2.4% Widowed7.2% DivorcedFemales 29.7% Never married41.0% Now married0.0% Separated13.2% Widowed16.1% DivorcedWomen who did not give birth in the past 12 months Now married:
21.1% (62)Unmarried:
78.9% (233)
Marital status - Two or more races population 15 years and over
Males 36.2% Never married46.8% Now married2.0% Separated0.0% Widowed14.9% DivorcedFemales 25.7% Never married33.1% Now married4.8% Separated30.1% Widowed6.2% DivorcedWomen who did not give birth in the past 12 months Now married:
37.9% (382)Unmarried:
62.1% (625)
Marital status - White alone, not Hispanic / Latino population 15 years and over
Males 44.9% Never married40.3% Now married0.0% Separated5.8% Widowed9.0% DivorcedFemales 27.3% Never married31.7% Now married0.0% Separated30.4% Widowed10.6% DivorcedWomen who did not give birth in the past 12 months Now married:
32.6% (139)Unmarried:
67.4% (288)
Marital status - Hispanic or Latino population 15 years and over
Males 34.2% Never married49.0% Now married2.2% Separated2.8% Widowed11.8% DivorcedFemales 28.1% Never married37.7% Now married3.5% Separated16.4% Widowed14.3% DivorcedWomen who gave birth in the past 12 months Now married:
100.0% (102)Unmarried:
0.0% (0)
Women who did not give birth in the past 12 months Now married:
42.9% (1,009)Unmarried:
57.1% (1,346)
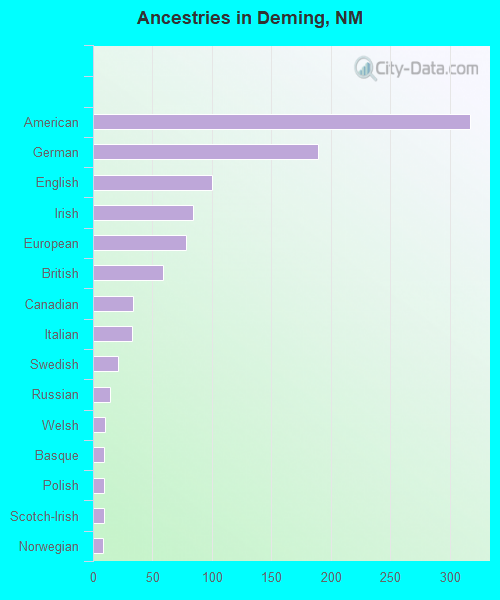
Ancestries in Deming
317 2.9% American189 1.7% German100 0.9% English84 0.8% Irish78 0.7% European59 0.5% British34 0.3% Canadian33 0.3% Italian21 0.2% Swedish14 0.1% Russian10 0.09% Welsh9 0.08% Basque9 0.08% Polish9 0.08% Scotch-Irish8 0.07% Norwegian2 0.02% Scandinavian
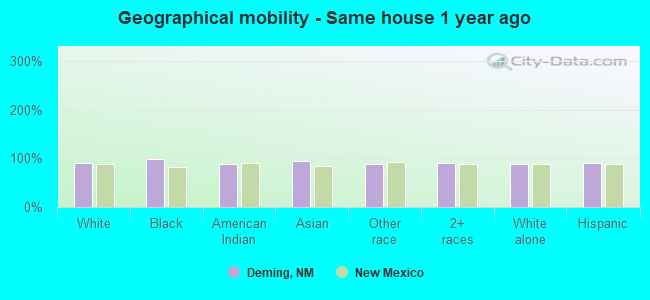
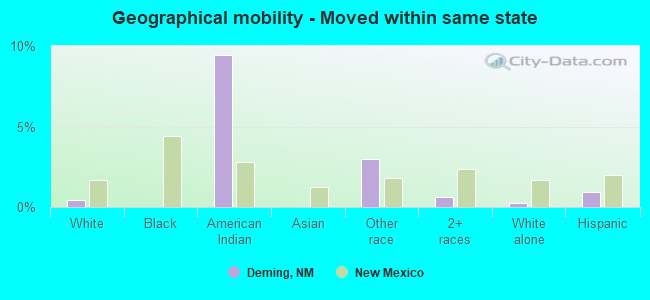
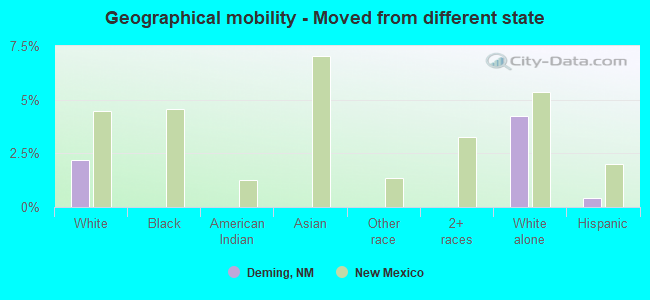
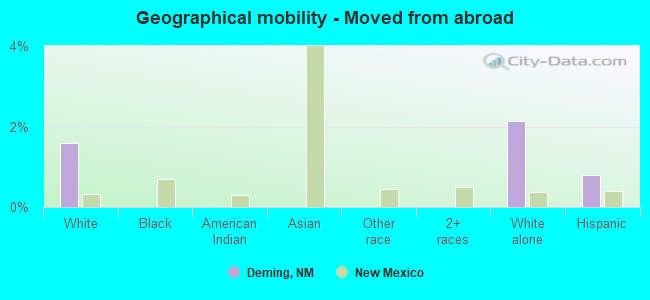
Geographical mobility in Deming Same house 1 year ago 6,572 89.8% White (Caucasian)215 98.3% Black or African American134 88.7% American Indian / Alaska Native314 95.1% Asian1,488 88.7% Other race4,662 90.5% Two or more races2,637 88.3% White alone, not Hispanic / Latino9,968 91.0% Hispanic or LatinoMoved within same county 424 5.8% White / Caucasian8 3.8% Black or African American4 2.9% American Indian / Alaska Native14 4.3% Asian129 7.7% Other race444 8.6% Two or more races162 5.4% White alone, not Hispanic / Latino755 6.9% Hispanic or LatinoMoved within same state 33 0.4% White / Caucasian14 9.4% American Indian / Alaska Native50 3.0% Other race31 0.6% Two or more races8 0.3% White alone, not Hispanic / Latino103 0.9% Hispanic or LatinoMoved from different state 159 2.2% White / Caucasian127 4.3% White alone, not Hispanic / Latino47 0.4% Hispanic or LatinoMoved from abroad 117 1.6% White64 2.1% White alone, not Hispanic / Latino87 0.8% Hispanic or Latino
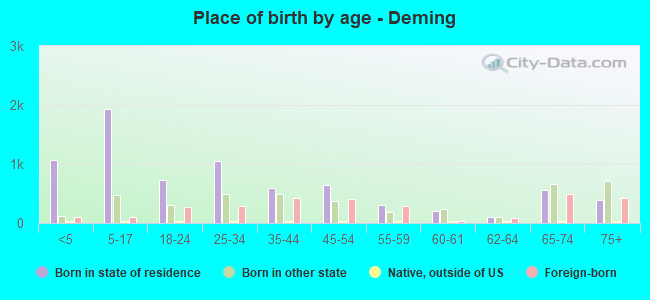
Children Nativity (place of birth) in Deming
Children under 6 years - Living with two parents Both parents native 825 100.0% NativeBoth parents foreign-born 106 45.2% Native129 54.8% Foreign-bornOne native, one foreign-born parent 177 100.0% NativeChildren under 6 years - Living with one parent Native parent 224 100.0% NativeForeign-born parent 17 100.0% NativeChildren 6 to 17 years - Living with two parents Both parents native 767 99.3% Native5 0.7% Foreign-bornBoth parents foreign-born 222 75.3% Native73 24.7% Foreign-bornOne native, one foreign-born parent 91 84.5% Native17 15.5% Foreign-bornChildren 6 to 17 years - Living with one parent Native parent 849 100.0% NativeForeign-born parent 166 52.7% Native149 47.3% Foreign-born
Grandparents responsible for own grandchildren in Deming
Grandparents (30 to 59 years) White / Caucasian 31 29.0% Responsible for grandchildren76 71.0% Not responsible for grandchildrenWhite alone, not Hispanic / Latino 5 22.3% Responsible for grandchildren19 77.7% Not responsible for grandchildrenHispanic or Latino 22 21.6% Responsible for grandchildren80 78.4% Not responsible for grandchildrenGrandparents (60 years and over) White / Caucasian 26 20.5% Responsible for grandchildren102 79.5% Not responsible for grandchildrenWhite alone, not Hispanic / Latino 6 100.0% Not responsible for grandchildrenHispanic or Latino 40 22.7% Responsible for grandchildren135 77.3% Not responsible for grandchildren