Races in Downers Grove, Illinois (IL) Detailed Stats
Data:
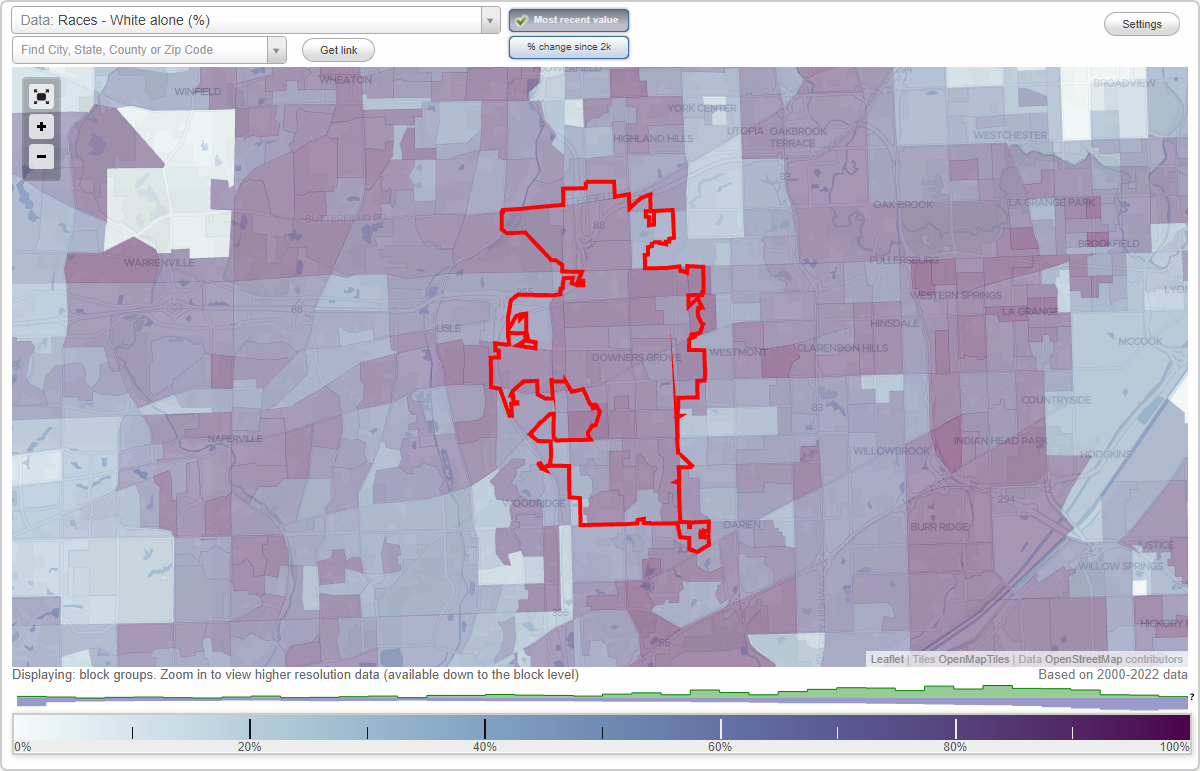
Races - White alone (%)
Races - White alone (% change since 2000)
Races - Black alone (%)
Races - Black alone (% change since 2000)
Races - American Indian alone (%)
Races - American Indian alone (% change since 2000)
Races - Asian alone (%)
Races - Asian alone (% change since 2000)
Races - Hispanic (%)
Races - Hispanic (% change since 2000)
Races - Native Hawaiian and Other Pacific Islander alone (%)
Races - Native Hawaiian and Other Pacific Islander alone (% change since 2000)
Races - Two or more races(%)
Races - Two or more races(% change since 2000)
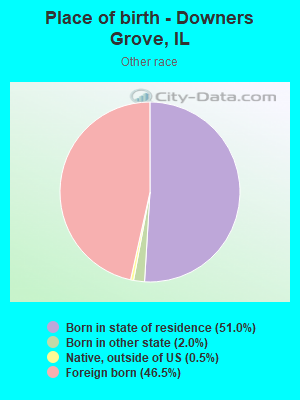
Races - Other race alone (%)
Races - Other race alone (% change since 2000)
Racial diversity
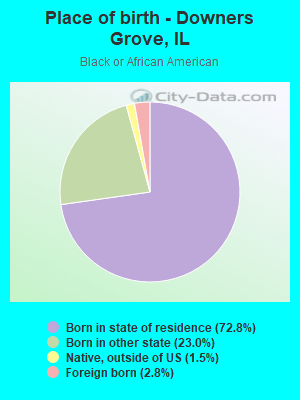
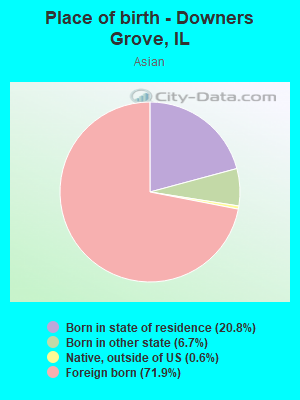
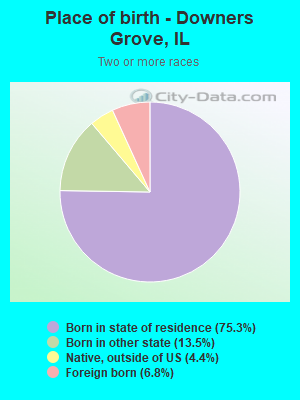
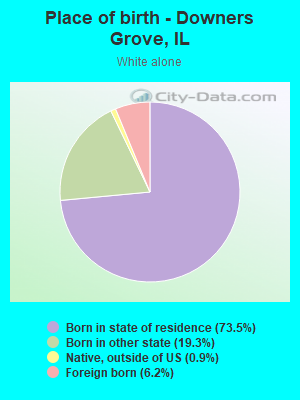
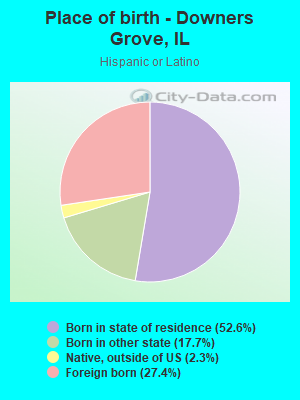
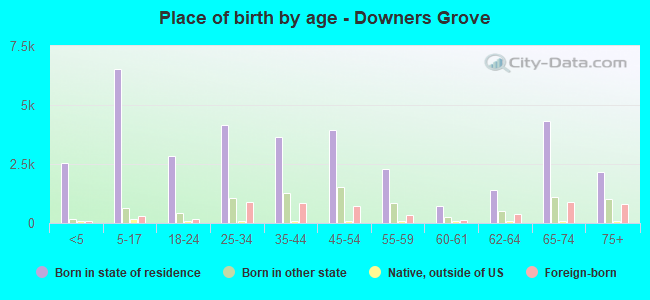
Place of birth - Born in state of residence (%)
Place of birth - Born in state of residence (%) - White
Place of birth - Born in state of residence (%) - Black or African American
Place of birth - Born in state of residence (%) - Asian
Place of birth - Born in state of residence (%) - Hispanic or Latino
Place of birth - Born in state of residence (%) - American Indian and Alaska Native
Place of birth - Born in state of residence (%) - Multirace
Place of birth - Born in state of residence (%) - Other Race
Place of birth - Born in other state (%)
Place of birth - Born in other state (%) - White
Place of birth - Born in other state (%) - Black or African American
Place of birth - Born in other state (%) - Asian
Place of birth - Born in other state (%) - Hispanic or Latino
Place of birth - Born in other state (%) - American Indian and Alaska Native
Place of birth - Born in other state (%) - Multirace
Place of birth - Born in other state (%) - Other Race
Place of birth - Native, outside of US (%)
Place of birth - Native, outside of US (%) - White
Place of birth - Native, outside of US (%) - Black or African American
Place of birth - Native, outside of US (%) - Asian
Place of birth - Native, outside of US (%) - Hispanic or Latino
Place of birth - Native, outside of US (%) - American Indian and Alaska Native
Place of birth - Native, outside of US (%) - Multirace
Place of birth - Native, outside of US (%) - Other Race
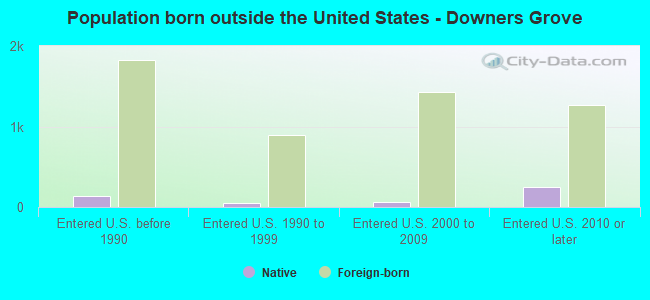
Place of birth - Foreign born (%)
Place of birth - Foreign born (%) - White
Place of birth - Foreign born (%) - Black or African American
Place of birth - Foreign born (%) - Asian
Place of birth - Foreign born (%) - Hispanic or Latino
Place of birth - Foreign born (%) - American Indian and Alaska Native
Place of birth - Foreign born (%) - Multirace
Place of birth - Foreign born (%) - Other Race
Residents speaking English at home (%)
Residents speaking English at home - Born in the United States (%)
Residents speaking English at home - Native, born elsewhere (%)
Residents speaking English at home - Foreign born (%)
Residents speaking Spanish at home (%)
Residents speaking Spanish at home - Born in the United States (%)
Residents speaking Spanish at home - Native, born elsewhere (%)
Residents speaking Spanish at home - Foreign born (%)
Residents speaking other language at home (%)
Residents speaking other language at home - Born in the United States (%)
Residents speaking other language at home - Native, born elsewhere (%)
Residents speaking other language at home - Foreign born (%)
Marital status - Never married (%)
Marital status - Now married (%)
Marital status - Separated (%)
Marital status - Widowed (%)
Marital status - Divorced (%)
Ancestries Reported - Arab (%)
Ancestries Reported - Czech (%)
Ancestries Reported - Danish (%)
Ancestries Reported - Dutch (%)
Ancestries Reported - English (%)
Ancestries Reported - French (%)
Ancestries Reported - French Canadian (%)
Ancestries Reported - German (%)
Ancestries Reported - Greek (%)
Ancestries Reported - Hungarian (%)
Ancestries Reported - Irish (%)
Ancestries Reported - Italian (%)
Ancestries Reported - Lithuanian (%)
Ancestries Reported - Norwegian (%)
Ancestries Reported - Polish (%)
Ancestries Reported - Portuguese (%)
Ancestries Reported - Russian (%)
Ancestries Reported - Scotch-Irish (%)
Ancestries Reported - Scottish (%)
Ancestries Reported - Slovak (%)
Ancestries Reported - Subsaharan African (%)
Ancestries Reported - Swedish (%)
Ancestries Reported - Swiss (%)
Ancestries Reported - Ukrainian (%)
Ancestries Reported - United States (%)
Ancestries Reported - Welsh (%)
Ancestries Reported - West Indian (%)
Ancestries Reported - Other (%)
Geographical mobility - Same house 1 year ago (%)
Geographical mobility - Same house 1 year ago (%) - White
Geographical mobility - Same house 1 year ago (%) - Black or African American
Geographical mobility - Same house 1 year ago (%) - Asian
Geographical mobility - Same house 1 year ago (%) - Hispanic or Latino
Geographical mobility - Same house 1 year ago (%) - American Indian and Alaska Native
Geographical mobility - Same house 1 year ago (%) - Multirace
Geographical mobility - Same house 1 year ago (%) - Other Race
Geographical mobility - Moved within same county (%)
Geographical mobility - Moved within same county (%) - White
Geographical mobility - Moved within same county (%) - Black or African American
Geographical mobility - Moved within same county (%) - Asian
Geographical mobility - Moved within same county (%) - Hispanic or Latino
Geographical mobility - Moved within same county (%) - American Indian and Alaska Native
Geographical mobility - Moved within same county (%) - Multirace
Geographical mobility - Moved within same county (%) - Other Race
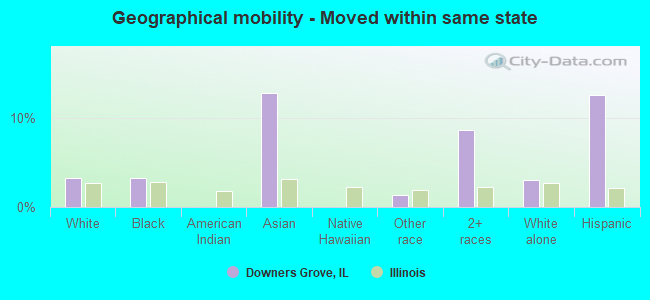
Geographical mobility - Moved from different county within same state (%)
Geographical mobility - Moved from different county within same state (%) - White
Geographical mobility - Moved from different county within same state (%) - Black or African American
Geographical mobility - Moved from different county within same state (%) - Asian
Geographical mobility - Moved from different county within same state (%) - Hispanic or Latino
Geographical mobility - Moved from different county within same state (%) - American Indian and Alaska Native
Geographical mobility - Moved from different county within same state (%) - Multirace
Geographical mobility - Moved from different county within same state (%) - Other Race
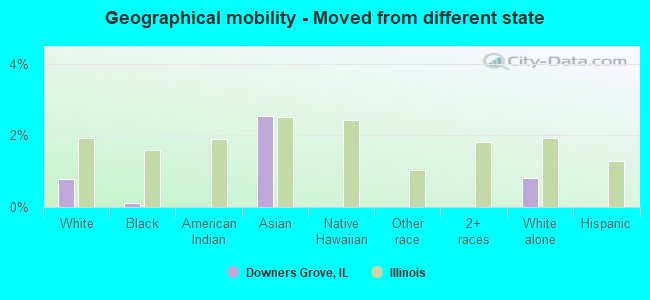
Geographical mobility - Moved from different state (%)
Geographical mobility - Moved from different state (%) - White
Geographical mobility - Moved from different state (%) - Black or African American
Geographical mobility - Moved from different state (%) - Asian
Geographical mobility - Moved from different state (%) - Hispanic or Latino
Geographical mobility - Moved from different state (%) - American Indian and Alaska Native
Geographical mobility - Moved from different state (%) - Multirace
Geographical mobility - Moved from different state (%) - Other Race
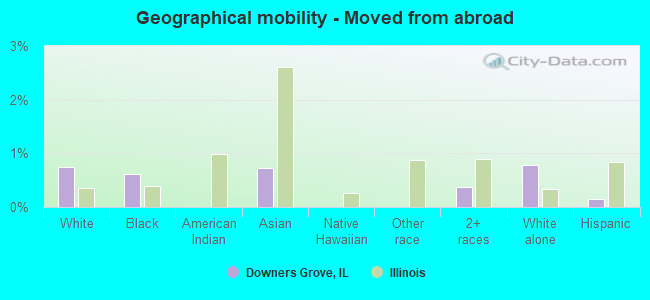
Geographical mobility - Moved from abroad (%)
Geographical mobility - Moved from abroad (%) - White
Geographical mobility - Moved from abroad (%) - Black or African American
Geographical mobility - Moved from abroad (%) - Asian
Geographical mobility - Moved from abroad (%) - Hispanic or Latino
Geographical mobility - Moved from abroad (%) - American Indian and Alaska Native
Geographical mobility - Moved from abroad (%) - Multirace
Geographical mobility - Moved from abroad (%) - Other Race
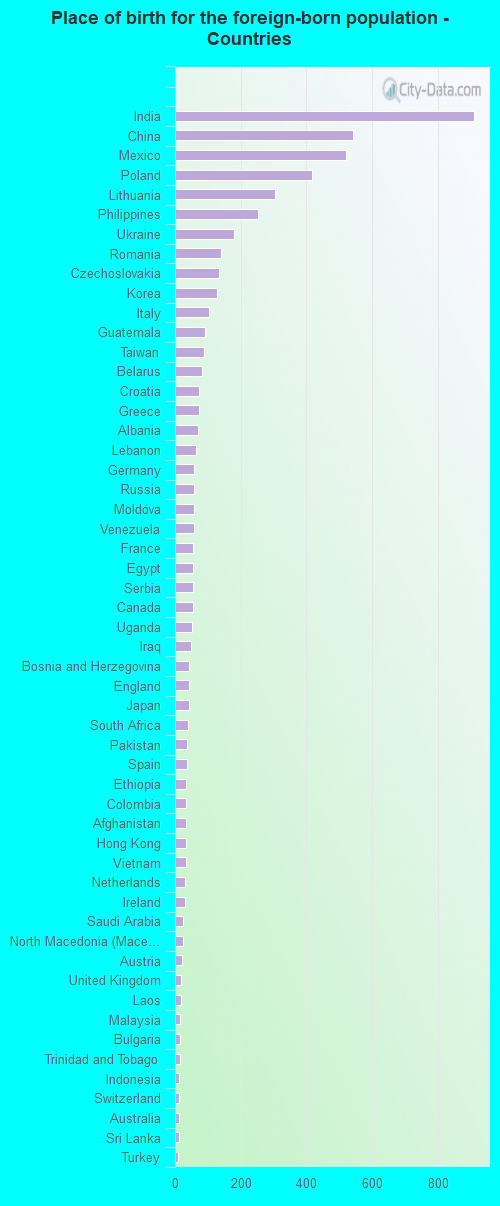
Place of birth for the foreign-born population - Ireland (%)
Place of birth for the foreign-born population - Denmark (%)
Place of birth for the foreign-born population - Norway (%)
Place of birth for the foreign-born population - Sweden (%)
Place of birth for the foreign-born population - United Kingdom (%)
Place of birth for the foreign-born population - England (%)
Place of birth for the foreign-born population - Scotland (%)
Place of birth for the foreign-born population - Other Northern Europe (%)
Place of birth for the foreign-born population - Austria (%)
Place of birth for the foreign-born population - Belgium (%)
Place of birth for the foreign-born population - France (%)
Place of birth for the foreign-born population - Germany (%)
Place of birth for the foreign-born population - Netherlands (%)
Place of birth for the foreign-born population - Switzerland (%)
Place of birth for the foreign-born population - Other Western Europe (%)
Place of birth for the foreign-born population - Greece (%)
Place of birth for the foreign-born population - Italy (%)
Place of birth for the foreign-born population - Portugal (%)
Place of birth for the foreign-born population - Spain (%)
Place of birth for the foreign-born population - Other Southern Europe (%)
Place of birth for the foreign-born population - Albania (%)
Place of birth for the foreign-born population - Belarus (%)
Place of birth for the foreign-born population - Bosnia and Herzegovina (%)
Place of birth for the foreign-born population - Bulgaria (%)
Place of birth for the foreign-born population - Croatia (%)
Place of birth for the foreign-born population - Czechoslovakia (%)
Place of birth for the foreign-born population - Hungary (%)
Place of birth for the foreign-born population - Latvia (%)
Place of birth for the foreign-born population - Lithuania (%)
Place of birth for the foreign-born population - North Macedonia (Macedonia) (%)
Place of birth for the foreign-born population - Moldova (%)
Place of birth for the foreign-born population - Poland (%)
Place of birth for the foreign-born population - Romania (%)
Place of birth for the foreign-born population - Russia (%)
Place of birth for the foreign-born population - Serbia (%)
Place of birth for the foreign-born population - Ukraine (%)
Place of birth for the foreign-born population - Other Eastern Europe (%)
Place of birth for the foreign-born population - China (%)
Place of birth for the foreign-born population - Hong Kong (%)
Place of birth for the foreign-born population - Taiwan (%)
Place of birth for the foreign-born population - Japan (%)
Place of birth for the foreign-born population - Korea (%)
Place of birth for the foreign-born population - Other Eastern Asia (%)
Place of birth for the foreign-born population - Afghanistan (%)
Place of birth for the foreign-born population - Bangladesh (%)
Place of birth for the foreign-born population - India (%)
Place of birth for the foreign-born population - Iran (%)
Place of birth for the foreign-born population - Kazakhstan (%)
Place of birth for the foreign-born population - Nepal (%)
Place of birth for the foreign-born population - Pakistan (%)
Place of birth for the foreign-born population - Sri Lanka (%)
Place of birth for the foreign-born population - Uzbekistan (%)
Place of birth for the foreign-born population - Other South Central Asia (%)
Place of birth for the foreign-born population - Burma (%)
Place of birth for the foreign-born population - Cambodia (%)
Place of birth for the foreign-born population - Indonesia (%)
Place of birth for the foreign-born population - Laos (%)
Place of birth for the foreign-born population - Malaysia (%)
Place of birth for the foreign-born population - Philippines (%)
Place of birth for the foreign-born population - Singapore (%)
Place of birth for the foreign-born population - Thailand (%)
Place of birth for the foreign-born population - Vietnam (%)
Place of birth for the foreign-born population - Other South Eastern Asia (%)
Place of birth for the foreign-born population - Armenia (%)
Place of birth for the foreign-born population - Iraq (%)
Place of birth for the foreign-born population - Israel (%)
Place of birth for the foreign-born population - Jordan (%)
Place of birth for the foreign-born population - Kuwait (%)
Place of birth for the foreign-born population - Lebanon (%)
Place of birth for the foreign-born population - Saudi Arabia (%)
Place of birth for the foreign-born population - Syria (%)
Place of birth for the foreign-born population - Turkey (%)
Place of birth for the foreign-born population - Yemen (%)
Place of birth for the foreign-born population - Other Western Asia (%)
Place of birth for the foreign-born population - Eritrea (%)
Place of birth for the foreign-born population - Ethiopia (%)
Place of birth for the foreign-born population - Kenya (%)
Place of birth for the foreign-born population - Somalia (%)
Place of birth for the foreign-born population - Uganda (%)
Place of birth for the foreign-born population - Zimbabwe (%)
Place of birth for the foreign-born population - Other Eastern Africa (%)
Place of birth for the foreign-born population - Cameroon (%)
Place of birth for the foreign-born population - Congo (%)
Place of birth for the foreign-born population - Democratic Republic of Congo (Zaire) (%)
Place of birth for the foreign-born population - Other Middle Africa (%)
Place of birth for the foreign-born population - Egypt (%)
Place of birth for the foreign-born population - Morocco (%)
Place of birth for the foreign-born population - Sudan (%)
Place of birth for the foreign-born population - Other Northern Africa (%)
Place of birth for the foreign-born population - South Africa (%)
Place of birth for the foreign-born population - Other Southern Africa (%)
Place of birth for the foreign-born population - Cabo Verde (%)
Place of birth for the foreign-born population - Ghana (%)
Place of birth for the foreign-born population - Liberia (%)
Place of birth for the foreign-born population - Nigeria (%)
Place of birth for the foreign-born population - Senegal (%)
Place of birth for the foreign-born population - Sierra Leone (%)
Place of birth for the foreign-born population - Other Western Africa (%)
Place of birth for the foreign-born population - Australia (%)
Place of birth for the foreign-born population - New Zealand (%)
Place of birth for the foreign-born population - Fiji (%)
Place of birth for the foreign-born population - Micronesia (%)
Place of birth for the foreign-born population - Bahamas (%)
Place of birth for the foreign-born population - Barbados (%)
Place of birth for the foreign-born population - Cuba (%)
Place of birth for the foreign-born population - Dominica (%)
Place of birth for the foreign-born population - Dominican Republic (%)
Place of birth for the foreign-born population - Grenada (%)
Place of birth for the foreign-born population - Haiti (%)
Place of birth for the foreign-born population - Jamaica (%)
Place of birth for the foreign-born population - St. Vincent and the Grenadines (%)
Place of birth for the foreign-born population - Trinidad and Tobago (%)
Place of birth for the foreign-born population - West Indies (%)
Place of birth for the foreign-born population - Other Caribbean (%)
Place of birth for the foreign-born population - Belize (%)
Place of birth for the foreign-born population - Costa Rica (%)
Place of birth for the foreign-born population - El Salvador (%)
Place of birth for the foreign-born population - Guatemala (%)
Place of birth for the foreign-born population - Honduras (%)
Place of birth for the foreign-born population - Mexico (%)
Place of birth for the foreign-born population - Nicaragua (%)
Place of birth for the foreign-born population - Panama (%)
Place of birth for the foreign-born population - Other Central America (%)
Place of birth for the foreign-born population - Argentina (%)
Place of birth for the foreign-born population - Bolivia (%)
Place of birth for the foreign-born population - Brazil (%)
Place of birth for the foreign-born population - Chile (%)
Place of birth for the foreign-born population - Colombia (%)
Place of birth for the foreign-born population - Ecuador (%)
Place of birth for the foreign-born population - Guyana (%)
Place of birth for the foreign-born population - Peru (%)
Place of birth for the foreign-born population - Uruguay (%)
Place of birth for the foreign-born population - Venezuela (%)
Place of birth for the foreign-born population - Other South America (%)
Place of birth for the foreign-born population - Canada (%)
Place of birth for the foreign-born population - Other Northern America (%)
Place of birth for the foreign-born population - Other (%)
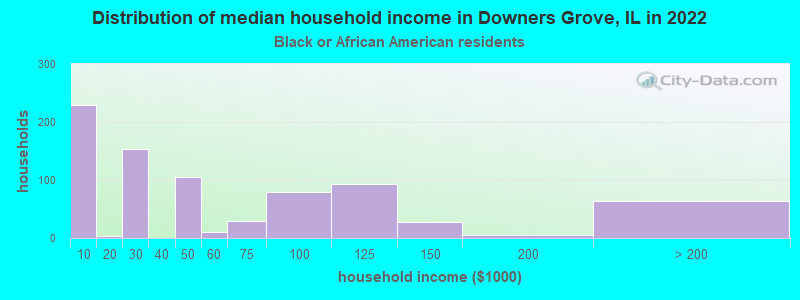
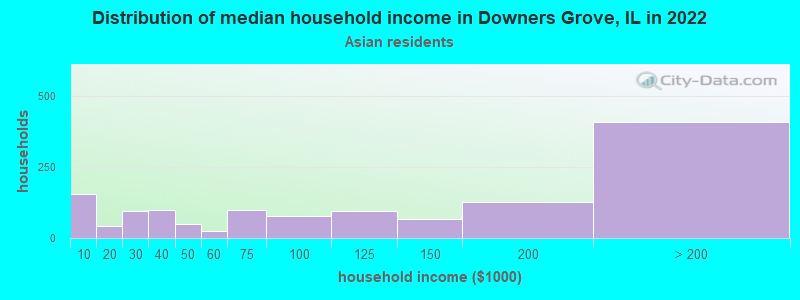
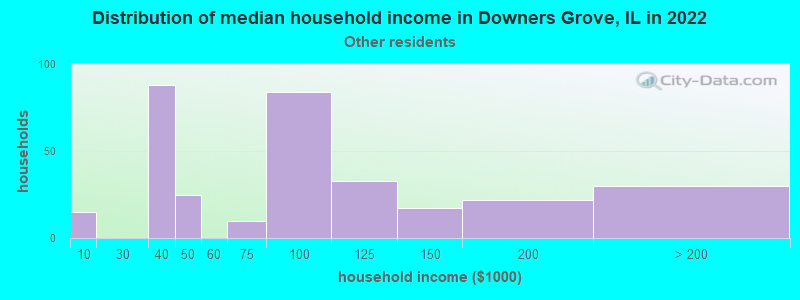
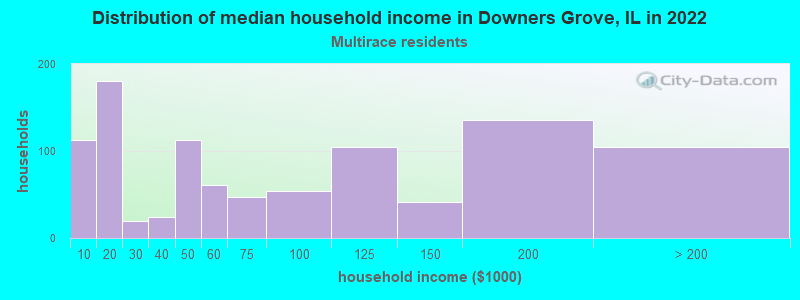
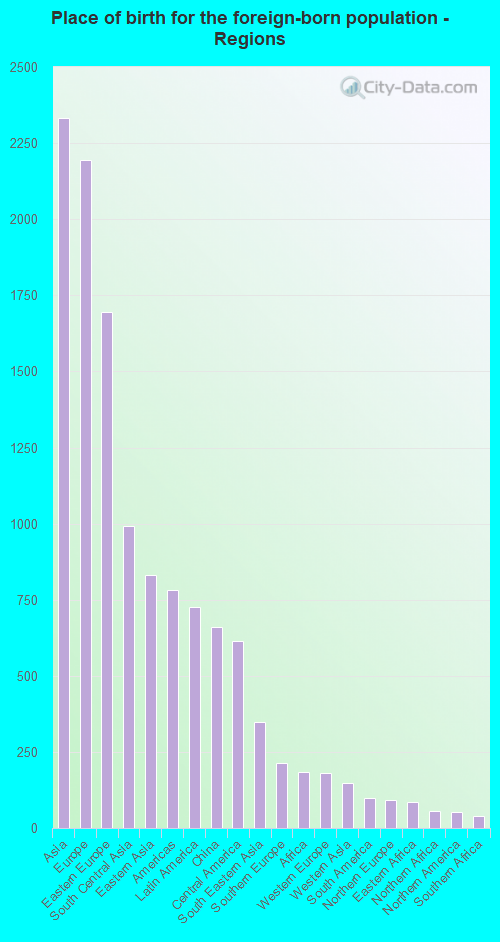
According to 2022 data, the most numerous races in Downers Grove, IL are White alone (39,293 residents), Hispanic (2,822 residents), and Black alone (1,599 residents). 85.6% of Downers Grove residents speak English at home. 11.1% of Downers Grove, IL residents are foreign-born (4.7% born in Asia, 4.4% born in Europe, 1.4% born in Latin America), which is 25.8% less than the foreign-born rate of 14.0% across the entire state of Illinois.
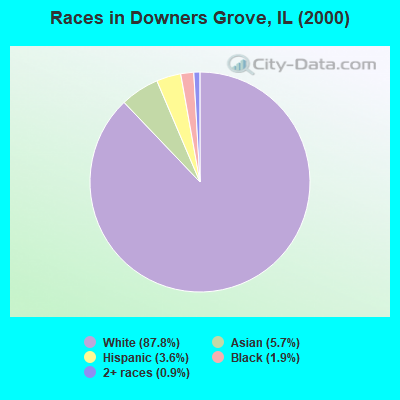
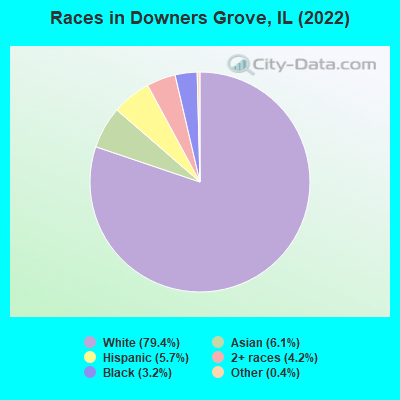
Race distribution in Downers Grove
2000 2022
8,424,140 67.8% White alone 1,856,152 14.9% Black alone 1,530,262 12.3% Hispanic 419,916 3.4% Asian alone 153,996 1.2% Two or more races 13,479 0.1% Other race alone 18,232 0.1% American Indian alone 3,116 0.03% Native Hawaiian and Other
7,356,301 58.5% White alone 2,299,726 18.3% Hispanic 1,660,423 13.2% Black alone 747,296 5.9% Asian alone 458,599 3.6% Two or more races 45,386 0.4% Other race alone 10,405 0.08% American Indian alone 3,896 0.03% Native Hawaiian and Other
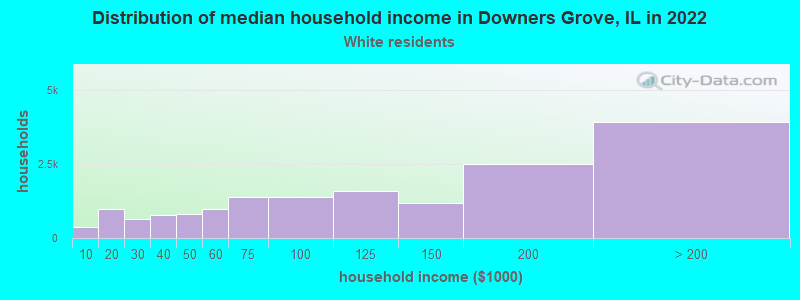
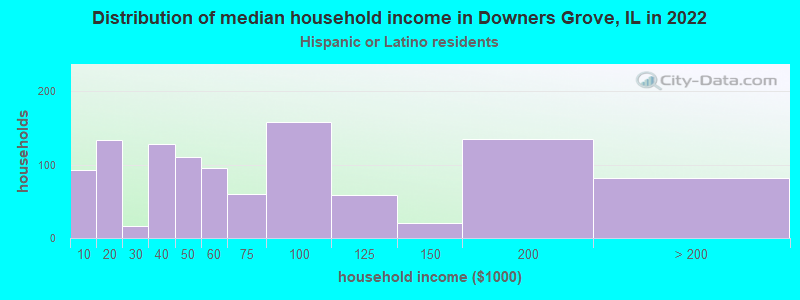
Income and house value in Downers Grove Median household income in 2022 $112,666 White non-Hispanic householders$41,533 Black householders$113,805 Asian householders$75,329 Some other race householders$76,815 Two or more races householders$60,273 Hispanic or Latino race householdersMedian 2022 house value $448,458 White Non-Hispanic householders$443,861 Black or African American householders$260,013 American Indian or Alaska Native householders $498,359 Asian householders$499,016 Some other race householders$372,730 Two or more races householders$419,129 Hispanic or Latino householders
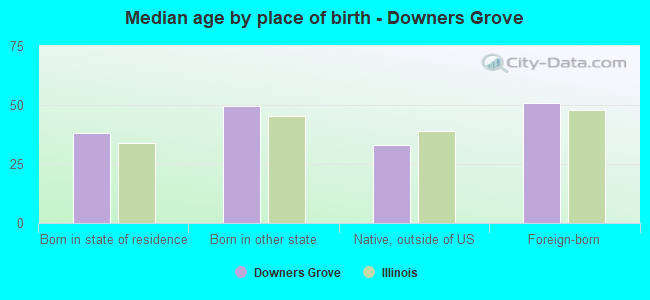
Median age by race in Downers Grove
45.6 Median age for White residents43.2 47.6 42.9 Median age for Black or African American residents44.5 41.9 28.7 Median age for American Indian / Alaska Native residents-721,943,047.9 -545,253,862.6 43.1 Median age for Asian residents44.8 39.7 -593,236,714.4 Median age for Native Hawaiian / Pacific Islander residents-658,536,584.7 -576,015,108.0 36.0 Median age for Other race residents42.6 36.2 27.3 Median age for Two or more races residents28.8 27.7 45.2 Median age for White alone residents43.0 47.3 35.9 Median age for Hispanic or Latino residents36.3 33.9
Owner/renter occupied households by race in Downers Grove
House owners and renters - White residents 13,514 81.5% Owner occupied3,065 18.5% Renter occupiedHouse owners and renters - Black or African American residents 192 29.6% Owner occupied457 70.4% Renter occupiedHouse owners and renters - American Indian / Alaska Native residents 5 100.0% Owner occupiedHouse owners and renters - Asian residents 768 61.2% Owner occupied488 38.8% Renter occupiedHouse owners and renters - Other race residents 226 72.5% Owner occupied86 27.5% Renter occupiedHouse owners and renters - Two or more races residents 520 56.3% Owner occupied404 43.7% Renter occupiedHouse owners and renters - White alone residents 13,648 81.4% Owner occupied3,111 18.6% Renter occupiedHouse owners and renters - Hispanic or Latino residents 508 50.9% Owner occupied489 49.1% Renter occupied
Language usage in Downers Grove
English speakers - Total 85.6% of residents of Downers Grove speak English at home.
3.3% of residents speak Spanish at home 1,124 73.0% Speak English very well416 27.0% Speak English less than very well10.8% of residents speak other language at home 3,219 63.6% Speak English very well1,842 36.4% Speak English less than very well
English speakers - Born in the United States 94.1% of residents of Downers Grove speak English at home.
2.5% of residents speak Spanish at home 216 100.0% Speak English very well3.1% of residents speak other language at home 267 100.0% Speak English very well
English speakers - Native, born elsewhere 49.4% of residents of Downers Grove speak English at home.
9.7% of residents speak Spanish at home 47 97.9% Speak English very well1 2.1% Speak English less than very well40.3% of residents speak other language at home 198 99.0% Speak English very well2 1.0% Speak English less than very well
English speakers - Foreign-born 13.9% of residents of Downers Grove speak English at home.
13.5% of residents speak Spanish at home 394 53.8% Speak English very well339 46.2% Speak English less than very well71.1% of residents speak other language at home 2,161 56.0% Speak English very well1,699 44.0% Speak English less than very well
White (Caucasian) - Speak only English Native:
98.4% (34,068)Foreign-born:
16.0% (367)
White (Caucasian) - Speak another language Native:
2.7% (947)Foreign-born:
83.7% (1,918)
Black or African American - Speak only English Native:
98.5% (1,551)Foreign-born:
78.2% (36)
Black or African American - Speak another language Native:
2.1% (34)Foreign-born:
93.6% (43)
Asian - Speak only English Native:
69.5% (555)Foreign-born:
13.4% (287)
Asian - Speak another language Native:
32.7% (262)Foreign-born:
85.9% (1,839)
Other race - Speak only English Native:
95.2% (373)Foreign-born:
3.6% (13)
Other race - Speak another language Native:
19.4% (76)Foreign-born:
97.0% (354)
Two or more races - Speak only English Native:
77.3% (2,072)Foreign-born:
14.1% (33)
Two or more races - Speak another language Native:
20.5% (549)Foreign-born:
85.3% (201)
White alone - Speak only English Native:
97.3% (33,801)Foreign-born:
16.7% (406)
White alone - Speak another language Native:
2.8% (982)Foreign-born:
83.2% (2,021)
Hispanic or Latino - Speak only English Native:
64.9% (1,254)Foreign-born:
1.3% (10)
Hispanic or Latino - Speak another language Native:
33.9% (655)Foreign-born:
99.5% (763)
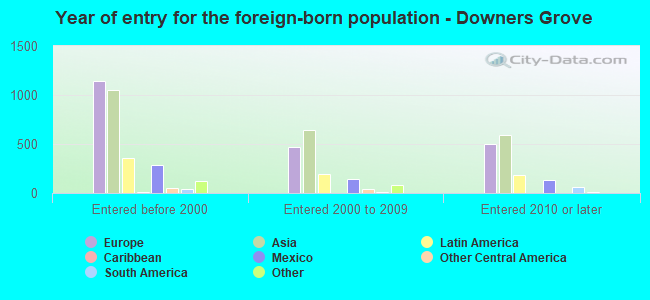
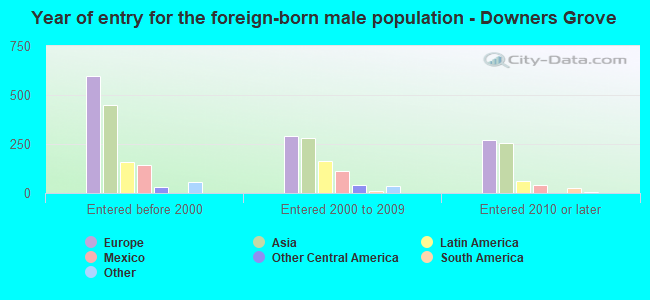
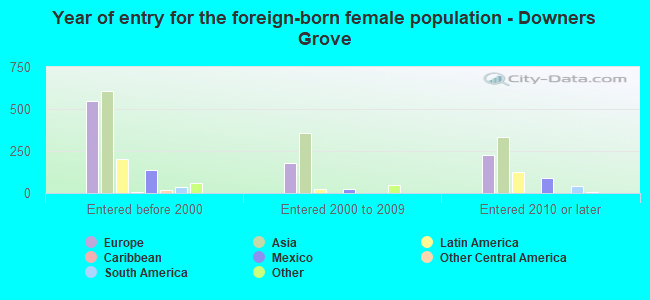
Foreign-born residents in Downers Grove 5,507 residents are foreign born (4.7% Asia , 4.4% Europe , 1.4% Latin America ).
This city:
11.1%Illinois:
14.1%
Marital status for residents in Downers Grove Marital status - White (Caucasian) population 15 years and over
Males 29.4% Never married61.3% Now married0.3% Separated2.3% Widowed6.7% DivorcedFemales 25.3% Never married54.6% Now married0.5% Separated8.5% Widowed11.2% DivorcedWomen who gave birth in the past 12 months Now married:
97.1% (510)Unmarried:
2.9% (15)
Women who did not give birth in the past 12 months Now married:
48.0% (3,329)Unmarried:
52.0% (3,599)
Marital status - Black or African American population 15 years and over
Males 61.7% Never married20.0% Now married0.0% Separated2.1% Widowed16.2% DivorcedFemales 51.6% Never married25.6% Now married0.0% Separated3.5% Widowed19.3% DivorcedWomen who gave birth in the past 12 months Now married:
0.0% (0)Unmarried:
100.0% (25)
Women who did not give birth in the past 12 months Now married:
18.3% (83)Unmarried:
81.7% (374)
Marital status - American Indian / Alaska Native population 15 years and over
Males 100.0% Never married0.0% Now married0.0% Separated0.0% Widowed0.0% DivorcedFemales 0.0% Never married100.0% Now married0.0% Separated0.0% Widowed0.0% DivorcedMarital status - Asian population 15 years and over
Males 21.0% Never married70.6% Now married0.8% Separated5.6% Widowed1.9% DivorcedFemales 29.9% Never married62.9% Now married0.0% Separated4.6% Widowed2.6% DivorcedWomen who gave birth in the past 12 months Now married:
100.0% (35)Unmarried:
0.0% (0)
Women who did not give birth in the past 12 months Now married:
48.0% (400)Unmarried:
52.0% (434)
Marital status - Other race population 15 years and over
Males 29.8% Never married49.5% Now married0.0% Separated0.0% Widowed20.7% DivorcedFemales 42.0% Never married40.3% Now married11.7% Separated6.1% Widowed0.0% DivorcedWomen who did not give birth in the past 12 months Now married:
48.2% (95)Unmarried:
51.8% (102)
Marital status - Two or more races population 15 years and over
Males 65.3% Never married21.1% Now married0.0% Separated2.4% Widowed11.3% DivorcedFemales 46.9% Never married29.8% Now married5.0% Separated3.1% Widowed15.2% DivorcedWomen who did not give birth in the past 12 months Now married:
27.5% (239)Unmarried:
72.5% (629)
Marital status - White alone, not Hispanic / Latino population 15 years and over
Males 28.4% Never married62.4% Now married0.4% Separated2.3% Widowed6.6% DivorcedFemales 24.7% Never married55.4% Now married0.4% Separated8.6% Widowed10.9% DivorcedWomen who gave birth in the past 12 months Now married:
98.3% (545)Unmarried:
1.7% (9)
Women who did not give birth in the past 12 months Now married:
49.2% (3,492)Unmarried:
50.8% (3,606)
Marital status - Hispanic or Latino population 15 years and over
Males 51.0% Never married32.0% Now married0.0% Separated1.2% Widowed15.8% DivorcedFemales 42.4% Never married33.1% Now married5.0% Separated4.4% Widowed15.2% DivorcedWomen who gave birth in the past 12 months Now married:
0.0% (0)Unmarried:
100.0% (7)
Women who did not give birth in the past 12 months Now married:
28.2% (197)Unmarried:
71.8% (501)
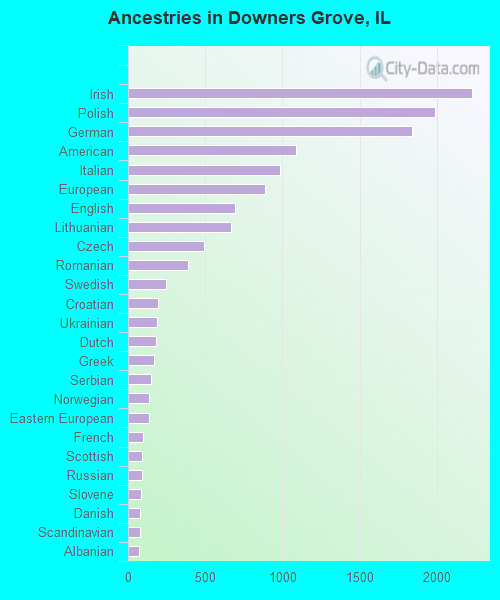
Ancestries in Downers Grove
2,227 11.5% Irish1,986 10.3% Polish1,842 9.5% German1,089 5.6% American984 5.1% Italian889 4.6% European690 3.6% English665 3.4% Lithuanian495 2.6% Czech389 2.0% Romanian243 1.3% Swedish196 1.0% Croatian188 1.0% Ukrainian183 0.9% Dutch168 0.9% Greek146 0.8% Serbian137 0.7% Norwegian136 0.7% Eastern European94 0.5% French92 0.5% Scottish89 0.5% Russian81 0.4% Slovene79 0.4% Danish75 0.4% Scandinavian73 0.4% Albanian65 0.3% Assyrian62 0.3% British57 0.3% Yugoslavian54 0.3% Ethiopian54 0.3% Swiss49 0.3% Czechoslovakian47 0.2% Egyptian45 0.2% Slovak44 0.2% Macedonian42 0.2% Afghan36 0.2% Scotch-Irish35 0.2% Northern European31 0.2% Hungarian29 0.2% Ghanaian28 0.1% Belgian19 0.10% Turkish18 0.09% Palestinian17 0.09% Canadian16 0.08% Armenian14 0.07% Celtic14 0.07% Austrian12 0.06% West Indian10 0.05% African9 0.05% Finnish9 0.05% Welsh8 0.04% Iraqi7 0.04% Bulgarian7 0.04% Jamaican1 0.01% Belizean
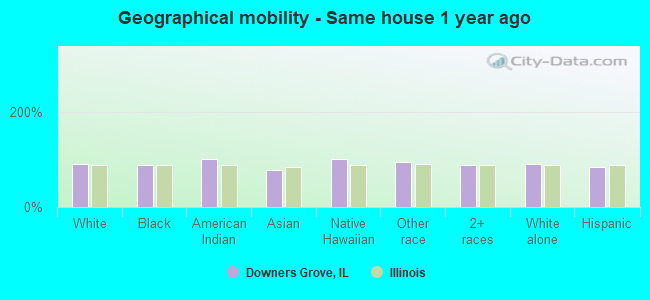
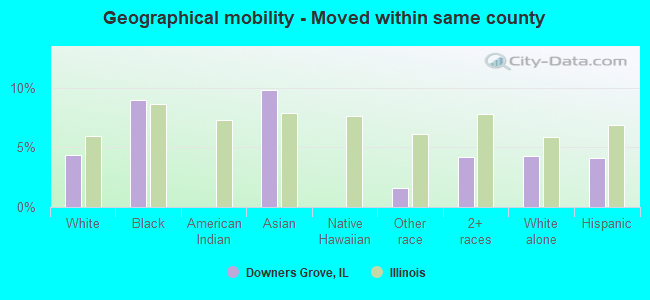
Geographical mobility in Downers Grove Same house 1 year ago 34,709 90.8% White (Caucasian)1,440 89.3% Black or African American23 99.7% American Indian / Alaska Native2,295 76.5% Asian15 100.0% Native Hawaiian / Pacific Islander755 95.4% Other race2,929 87.6% Two or more races35,294 91.1% White alone, not Hispanic / Latino2,324 83.0% Hispanic or LatinoMoved within same county 1,674 4.4% White / Caucasian145 9.0% Black or African American294 9.8% Asian12 1.6% Other race141 4.2% Two or more races1,647 4.3% White alone, not Hispanic / Latino115 4.1% Hispanic or LatinoMoved within same state 1,244 3.3% White / Caucasian52 3.2% Black or African American381 12.7% Asian11 1.4% Other race289 8.6% Two or more races1,170 3.0% White alone, not Hispanic / Latino352 12.6% Hispanic or LatinoMoved from different state 299 0.8% White / Caucasian2 0.1% Black or African American76 2.5% Asian310 0.8% White alone, not Hispanic / LatinoMoved from abroad 284 0.7% White10 0.6% Black or African American22 0.7% Asian13 0.4% Two or more races301 0.8% White alone, not Hispanic / Latino4 0.1% Hispanic or Latino
Children Nativity (place of birth) in Downers Grove
Children under 6 years - Living with two parents Both parents native 2,398 99.9% Native2 0.1% Foreign-bornBoth parents foreign-born 189 85.5% Native32 14.5% Foreign-bornOne native, one foreign-born parent 363 100.0% NativeChildren under 6 years - Living with one parent Native parent 225 100.0% NativeForeign-born parent 5 100.0% NativeChildren 6 to 17 years - Living with two parents Both parents native 4,823 97.8% Native107 2.2% Foreign-bornBoth parents foreign-born 216 63.3% Native125 36.7% Foreign-bornOne native, one foreign-born parent 557 100.0% NativeChildren 6 to 17 years - Living with one parent Native parent 912 100.0% NativeForeign-born parent 181 57.9% Native131 42.1% Foreign-born
Grandparents responsible for own grandchildren in Downers Grove
Grandparents (30 to 59 years) White / Caucasian 15 39.4% Responsible for grandchildren24 60.6% Not responsible for grandchildrenWhite alone, not Hispanic / Latino 10 27.0% Responsible for grandchildren27 73.0% Not responsible for grandchildrenHispanic or Latino 3 100.0% Responsible for grandchildrenGrandparents (60 years and over) White / Caucasian 37 15.7% Responsible for grandchildren197 84.3% Not responsible for grandchildrenWhite alone, not Hispanic / Latino 35 15.1% Responsible for grandchildren196 84.9% Not responsible for grandchildrenHispanic or Latino 18 100.0% Responsible for grandchildren