Races in El Centro, California (CA) Detailed Stats
Data:
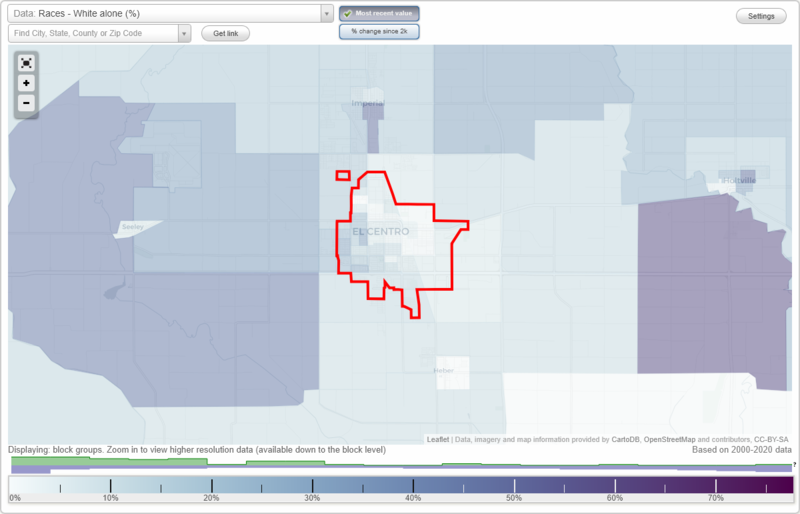
Races - White alone (%)
Races - White alone (% change since 2000)
Races - Black alone (%)
Races - Black alone (% change since 2000)
Races - American Indian alone (%)
Races - American Indian alone (% change since 2000)
Races - Asian alone (%)
Races - Asian alone (% change since 2000)
Races - Hispanic (%)
Races - Hispanic (% change since 2000)
Races - Native Hawaiian and Other Pacific Islander alone (%)
Races - Native Hawaiian and Other Pacific Islander alone (% change since 2000)
Races - Two or more races(%)
Races - Two or more races(% change since 2000)
Races - Other race alone (%)
Races - Other race alone (% change since 2000)
Racial diversity
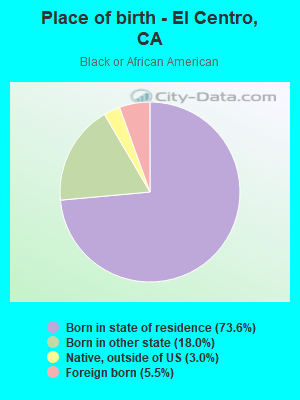
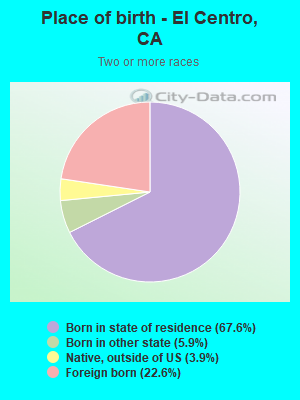
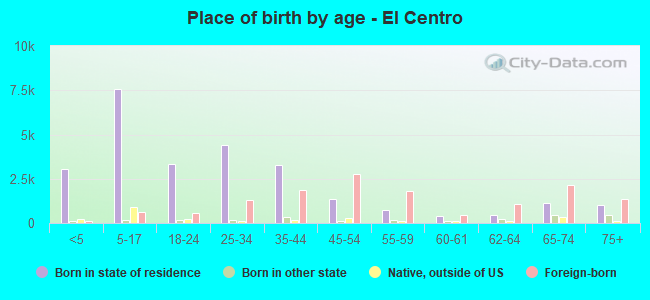
Place of birth - Born in state of residence (%)
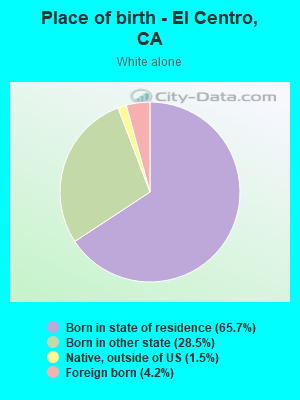
Place of birth - Born in state of residence (%) - White
Place of birth - Born in state of residence (%) - Black or African American
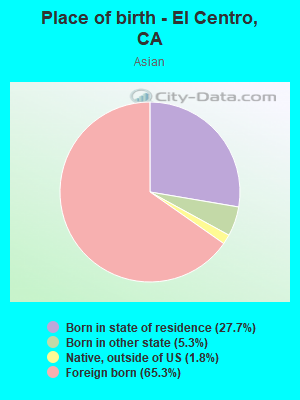
Place of birth - Born in state of residence (%) - Asian
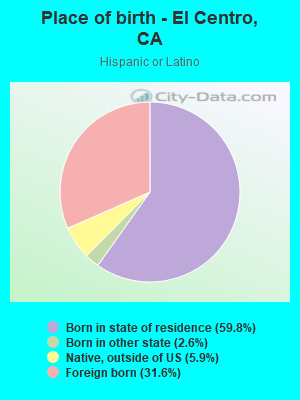
Place of birth - Born in state of residence (%) - Hispanic or Latino
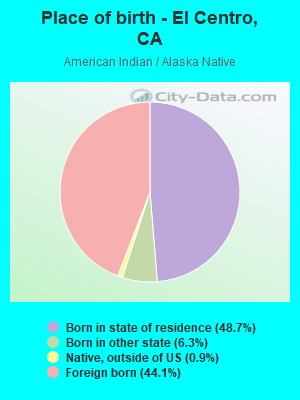
Place of birth - Born in state of residence (%) - American Indian and Alaska Native
Place of birth - Born in state of residence (%) - Multirace
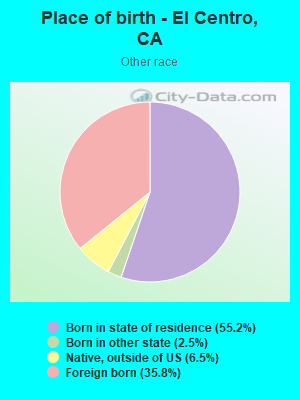
Place of birth - Born in state of residence (%) - Other Race
Place of birth - Born in other state (%)
Place of birth - Born in other state (%) - White
Place of birth - Born in other state (%) - Black or African American
Place of birth - Born in other state (%) - Asian
Place of birth - Born in other state (%) - Hispanic or Latino
Place of birth - Born in other state (%) - American Indian and Alaska Native
Place of birth - Born in other state (%) - Multirace
Place of birth - Born in other state (%) - Other Race
Place of birth - Native, outside of US (%)
Place of birth - Native, outside of US (%) - White
Place of birth - Native, outside of US (%) - Black or African American
Place of birth - Native, outside of US (%) - Asian
Place of birth - Native, outside of US (%) - Hispanic or Latino
Place of birth - Native, outside of US (%) - American Indian and Alaska Native
Place of birth - Native, outside of US (%) - Multirace
Place of birth - Native, outside of US (%) - Other Race
Place of birth - Foreign born (%)
Place of birth - Foreign born (%) - White
Place of birth - Foreign born (%) - Black or African American
Place of birth - Foreign born (%) - Asian
Place of birth - Foreign born (%) - Hispanic or Latino
Place of birth - Foreign born (%) - American Indian and Alaska Native
Place of birth - Foreign born (%) - Multirace
Place of birth - Foreign born (%) - Other Race
Residents speaking English at home (%)
Residents speaking English at home - Born in the United States (%)
Residents speaking English at home - Native, born elsewhere (%)
Residents speaking English at home - Foreign born (%)
Residents speaking Spanish at home (%)
Residents speaking Spanish at home - Born in the United States (%)
Residents speaking Spanish at home - Native, born elsewhere (%)
Residents speaking Spanish at home - Foreign born (%)
Residents speaking other language at home (%)
Residents speaking other language at home - Born in the United States (%)
Residents speaking other language at home - Native, born elsewhere (%)
Residents speaking other language at home - Foreign born (%)
Marital status - Never married (%)
Marital status - Now married (%)
Marital status - Separated (%)
Marital status - Widowed (%)
Marital status - Divorced (%)
Ancestries Reported - Arab (%)
Ancestries Reported - Czech (%)
Ancestries Reported - Danish (%)
Ancestries Reported - Dutch (%)
Ancestries Reported - English (%)
Ancestries Reported - French (%)
Ancestries Reported - French Canadian (%)
Ancestries Reported - German (%)
Ancestries Reported - Greek (%)
Ancestries Reported - Hungarian (%)
Ancestries Reported - Irish (%)
Ancestries Reported - Italian (%)
Ancestries Reported - Lithuanian (%)
Ancestries Reported - Norwegian (%)
Ancestries Reported - Polish (%)
Ancestries Reported - Portuguese (%)
Ancestries Reported - Russian (%)
Ancestries Reported - Scotch-Irish (%)
Ancestries Reported - Scottish (%)
Ancestries Reported - Slovak (%)
Ancestries Reported - Subsaharan African (%)
Ancestries Reported - Swedish (%)
Ancestries Reported - Swiss (%)
Ancestries Reported - Ukrainian (%)
Ancestries Reported - United States (%)
Ancestries Reported - Welsh (%)
Ancestries Reported - West Indian (%)
Ancestries Reported - Other (%)
Geographical mobility - Same house 1 year ago (%)
Geographical mobility - Same house 1 year ago (%) - White
Geographical mobility - Same house 1 year ago (%) - Black or African American
Geographical mobility - Same house 1 year ago (%) - Asian
Geographical mobility - Same house 1 year ago (%) - Hispanic or Latino
Geographical mobility - Same house 1 year ago (%) - American Indian and Alaska Native
Geographical mobility - Same house 1 year ago (%) - Multirace
Geographical mobility - Same house 1 year ago (%) - Other Race
Geographical mobility - Moved within same county (%)
Geographical mobility - Moved within same county (%) - White
Geographical mobility - Moved within same county (%) - Black or African American
Geographical mobility - Moved within same county (%) - Asian
Geographical mobility - Moved within same county (%) - Hispanic or Latino
Geographical mobility - Moved within same county (%) - American Indian and Alaska Native
Geographical mobility - Moved within same county (%) - Multirace
Geographical mobility - Moved within same county (%) - Other Race
Geographical mobility - Moved from different county within same state (%)
Geographical mobility - Moved from different county within same state (%) - White
Geographical mobility - Moved from different county within same state (%) - Black or African American
Geographical mobility - Moved from different county within same state (%) - Asian
Geographical mobility - Moved from different county within same state (%) - Hispanic or Latino
Geographical mobility - Moved from different county within same state (%) - American Indian and Alaska Native
Geographical mobility - Moved from different county within same state (%) - Multirace
Geographical mobility - Moved from different county within same state (%) - Other Race
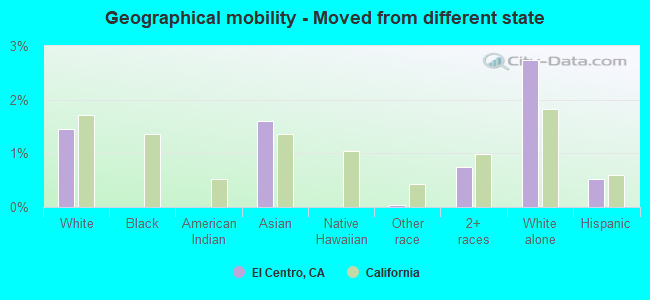
Geographical mobility - Moved from different state (%)
Geographical mobility - Moved from different state (%) - White
Geographical mobility - Moved from different state (%) - Black or African American
Geographical mobility - Moved from different state (%) - Asian
Geographical mobility - Moved from different state (%) - Hispanic or Latino
Geographical mobility - Moved from different state (%) - American Indian and Alaska Native
Geographical mobility - Moved from different state (%) - Multirace
Geographical mobility - Moved from different state (%) - Other Race
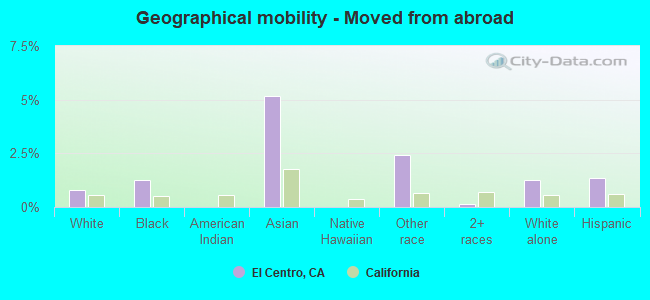
Geographical mobility - Moved from abroad (%)
Geographical mobility - Moved from abroad (%) - White
Geographical mobility - Moved from abroad (%) - Black or African American
Geographical mobility - Moved from abroad (%) - Asian
Geographical mobility - Moved from abroad (%) - Hispanic or Latino
Geographical mobility - Moved from abroad (%) - American Indian and Alaska Native
Geographical mobility - Moved from abroad (%) - Multirace
Geographical mobility - Moved from abroad (%) - Other Race
Place of birth for the foreign-born population - Ireland (%)
Place of birth for the foreign-born population - Denmark (%)
Place of birth for the foreign-born population - Norway (%)
Place of birth for the foreign-born population - Sweden (%)
Place of birth for the foreign-born population - United Kingdom (%)
Place of birth for the foreign-born population - England (%)
Place of birth for the foreign-born population - Scotland (%)
Place of birth for the foreign-born population - Other Northern Europe (%)
Place of birth for the foreign-born population - Austria (%)
Place of birth for the foreign-born population - Belgium (%)
Place of birth for the foreign-born population - France (%)
Place of birth for the foreign-born population - Germany (%)
Place of birth for the foreign-born population - Netherlands (%)
Place of birth for the foreign-born population - Switzerland (%)
Place of birth for the foreign-born population - Other Western Europe (%)
Place of birth for the foreign-born population - Greece (%)
Place of birth for the foreign-born population - Italy (%)
Place of birth for the foreign-born population - Portugal (%)
Place of birth for the foreign-born population - Spain (%)
Place of birth for the foreign-born population - Other Southern Europe (%)
Place of birth for the foreign-born population - Albania (%)
Place of birth for the foreign-born population - Belarus (%)
Place of birth for the foreign-born population - Bosnia and Herzegovina (%)
Place of birth for the foreign-born population - Bulgaria (%)
Place of birth for the foreign-born population - Croatia (%)
Place of birth for the foreign-born population - Czechoslovakia (%)
Place of birth for the foreign-born population - Hungary (%)
Place of birth for the foreign-born population - Latvia (%)
Place of birth for the foreign-born population - Lithuania (%)
Place of birth for the foreign-born population - North Macedonia (Macedonia) (%)
Place of birth for the foreign-born population - Moldova (%)
Place of birth for the foreign-born population - Poland (%)
Place of birth for the foreign-born population - Romania (%)
Place of birth for the foreign-born population - Russia (%)
Place of birth for the foreign-born population - Serbia (%)
Place of birth for the foreign-born population - Ukraine (%)
Place of birth for the foreign-born population - Other Eastern Europe (%)
Place of birth for the foreign-born population - China (%)
Place of birth for the foreign-born population - Hong Kong (%)
Place of birth for the foreign-born population - Taiwan (%)
Place of birth for the foreign-born population - Japan (%)
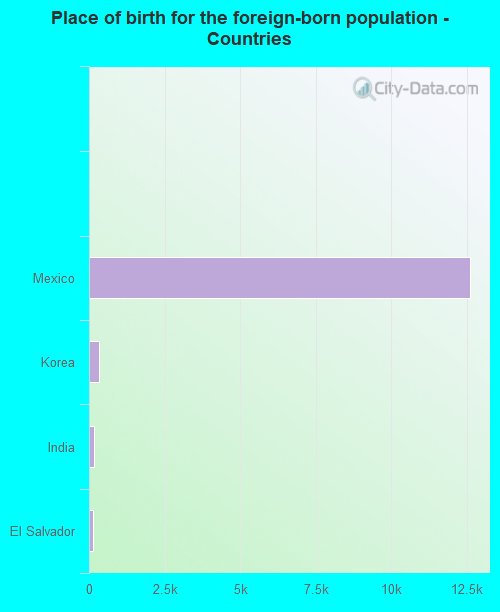
Place of birth for the foreign-born population - Korea (%)
Place of birth for the foreign-born population - Other Eastern Asia (%)
Place of birth for the foreign-born population - Afghanistan (%)
Place of birth for the foreign-born population - Bangladesh (%)
Place of birth for the foreign-born population - India (%)
Place of birth for the foreign-born population - Iran (%)
Place of birth for the foreign-born population - Kazakhstan (%)
Place of birth for the foreign-born population - Nepal (%)
Place of birth for the foreign-born population - Pakistan (%)
Place of birth for the foreign-born population - Sri Lanka (%)
Place of birth for the foreign-born population - Uzbekistan (%)
Place of birth for the foreign-born population - Other South Central Asia (%)
Place of birth for the foreign-born population - Burma (%)
Place of birth for the foreign-born population - Cambodia (%)
Place of birth for the foreign-born population - Indonesia (%)
Place of birth for the foreign-born population - Laos (%)
Place of birth for the foreign-born population - Malaysia (%)
Place of birth for the foreign-born population - Philippines (%)
Place of birth for the foreign-born population - Singapore (%)
Place of birth for the foreign-born population - Thailand (%)
Place of birth for the foreign-born population - Vietnam (%)
Place of birth for the foreign-born population - Other South Eastern Asia (%)
Place of birth for the foreign-born population - Armenia (%)
Place of birth for the foreign-born population - Iraq (%)
Place of birth for the foreign-born population - Israel (%)
Place of birth for the foreign-born population - Jordan (%)
Place of birth for the foreign-born population - Kuwait (%)
Place of birth for the foreign-born population - Lebanon (%)
Place of birth for the foreign-born population - Saudi Arabia (%)
Place of birth for the foreign-born population - Syria (%)
Place of birth for the foreign-born population - Turkey (%)
Place of birth for the foreign-born population - Yemen (%)
Place of birth for the foreign-born population - Other Western Asia (%)
Place of birth for the foreign-born population - Eritrea (%)
Place of birth for the foreign-born population - Ethiopia (%)
Place of birth for the foreign-born population - Kenya (%)
Place of birth for the foreign-born population - Somalia (%)
Place of birth for the foreign-born population - Uganda (%)
Place of birth for the foreign-born population - Zimbabwe (%)
Place of birth for the foreign-born population - Other Eastern Africa (%)
Place of birth for the foreign-born population - Cameroon (%)
Place of birth for the foreign-born population - Congo (%)
Place of birth for the foreign-born population - Democratic Republic of Congo (Zaire) (%)
Place of birth for the foreign-born population - Other Middle Africa (%)
Place of birth for the foreign-born population - Egypt (%)
Place of birth for the foreign-born population - Morocco (%)
Place of birth for the foreign-born population - Sudan (%)
Place of birth for the foreign-born population - Other Northern Africa (%)
Place of birth for the foreign-born population - South Africa (%)
Place of birth for the foreign-born population - Other Southern Africa (%)
Place of birth for the foreign-born population - Cabo Verde (%)
Place of birth for the foreign-born population - Ghana (%)
Place of birth for the foreign-born population - Liberia (%)
Place of birth for the foreign-born population - Nigeria (%)
Place of birth for the foreign-born population - Senegal (%)
Place of birth for the foreign-born population - Sierra Leone (%)
Place of birth for the foreign-born population - Other Western Africa (%)
Place of birth for the foreign-born population - Australia (%)
Place of birth for the foreign-born population - New Zealand (%)
Place of birth for the foreign-born population - Fiji (%)
Place of birth for the foreign-born population - Micronesia (%)
Place of birth for the foreign-born population - Bahamas (%)
Place of birth for the foreign-born population - Barbados (%)
Place of birth for the foreign-born population - Cuba (%)
Place of birth for the foreign-born population - Dominica (%)
Place of birth for the foreign-born population - Dominican Republic (%)
Place of birth for the foreign-born population - Grenada (%)
Place of birth for the foreign-born population - Haiti (%)
Place of birth for the foreign-born population - Jamaica (%)
Place of birth for the foreign-born population - St. Vincent and the Grenadines (%)
Place of birth for the foreign-born population - Trinidad and Tobago (%)
Place of birth for the foreign-born population - West Indies (%)
Place of birth for the foreign-born population - Other Caribbean (%)
Place of birth for the foreign-born population - Belize (%)
Place of birth for the foreign-born population - Costa Rica (%)
Place of birth for the foreign-born population - El Salvador (%)
Place of birth for the foreign-born population - Guatemala (%)
Place of birth for the foreign-born population - Honduras (%)
Place of birth for the foreign-born population - Mexico (%)
Place of birth for the foreign-born population - Nicaragua (%)
Place of birth for the foreign-born population - Panama (%)
Place of birth for the foreign-born population - Other Central America (%)
Place of birth for the foreign-born population - Argentina (%)
Place of birth for the foreign-born population - Bolivia (%)
Place of birth for the foreign-born population - Brazil (%)
Place of birth for the foreign-born population - Chile (%)
Place of birth for the foreign-born population - Colombia (%)
Place of birth for the foreign-born population - Ecuador (%)
Place of birth for the foreign-born population - Guyana (%)
Place of birth for the foreign-born population - Peru (%)
Place of birth for the foreign-born population - Uruguay (%)
Place of birth for the foreign-born population - Venezuela (%)
Place of birth for the foreign-born population - Other South America (%)
Place of birth for the foreign-born population - Canada (%)
Place of birth for the foreign-born population - Other Northern America (%)
Place of birth for the foreign-born population - Other (%)
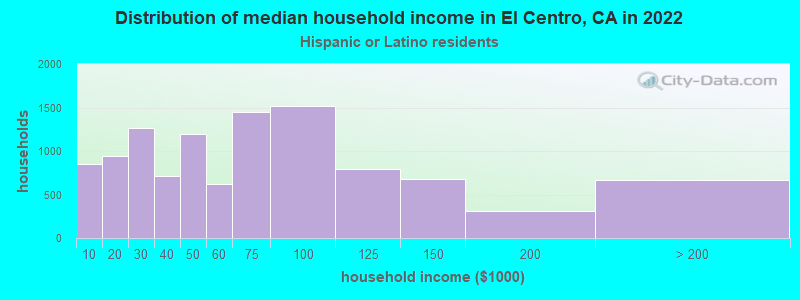
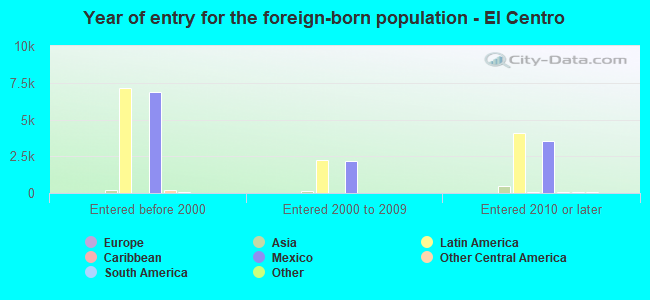
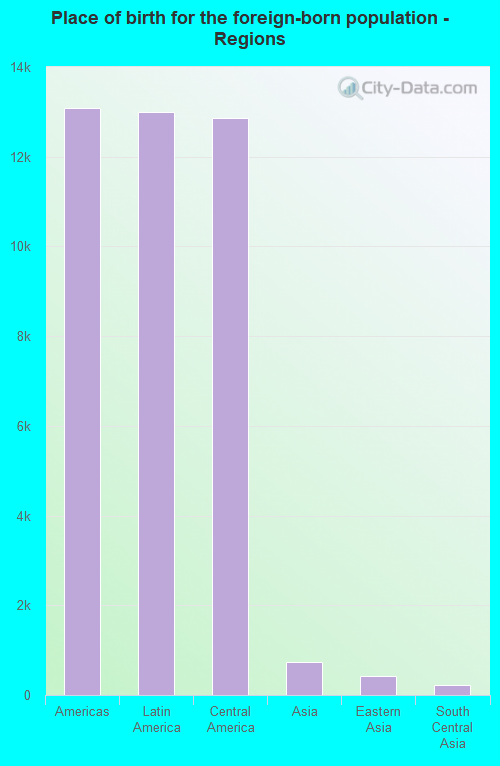
According to 2022 data, the most numerous races in El Centro, CA are Hispanic (39,655 residents), White alone (3,405 residents), and Asian alone (1,055 residents). 20.3% of El Centro residents speak English at home. 31.4% of El Centro, CA residents are foreign-born (29.2% born in Latin America), which is 17.2% greater than the foreign-born rate of 26.0% across the entire state of California.
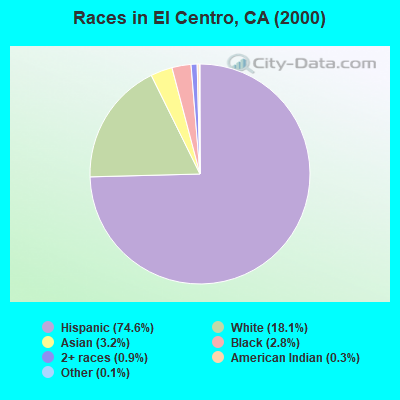
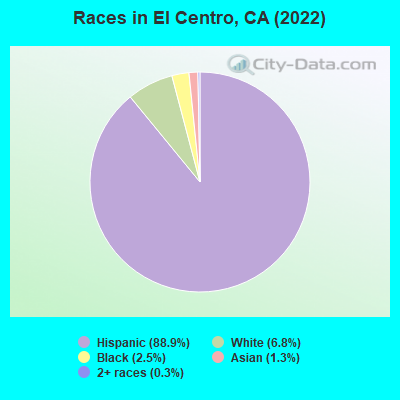
Race distribution in El Centro
2000 2022
15,816,790 46.7% White alone 10,966,556 32.4% Hispanic 3,648,860 10.8% Asian alone 2,181,926 6.4% Black alone 903,115 2.7% Two or more races 178,984 0.5% American Indian alone 103,736 0.3% Native Hawaiian and Other 71,681 0.2% Other race alone
15,732,184 40.3% Hispanic 13,160,426 33.7% White alone 5,957,867 15.3% Asian alone 2,025,218 5.2% Black alone 1,663,222 4.3% Two or more races 251,618 0.6% Other race alone 135,777 0.3% Native Hawaiian and Other 103,030 0.3% American Indian alone
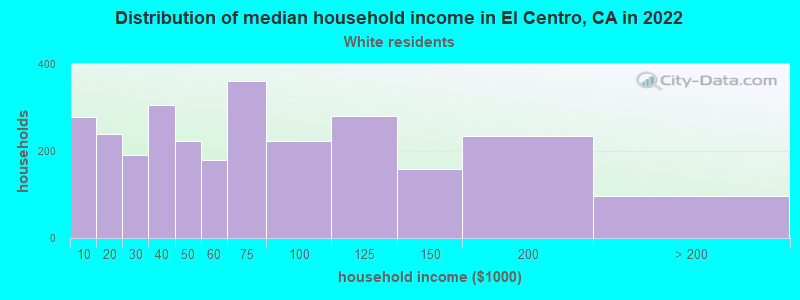
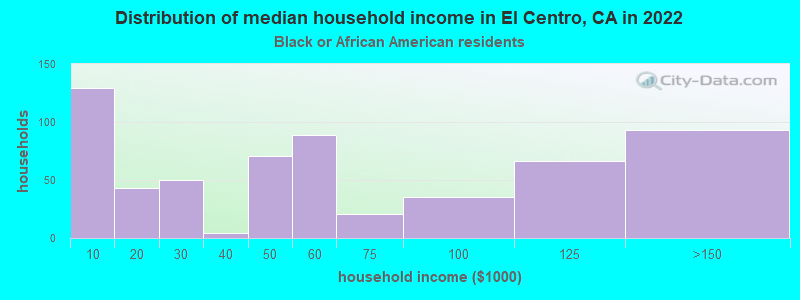
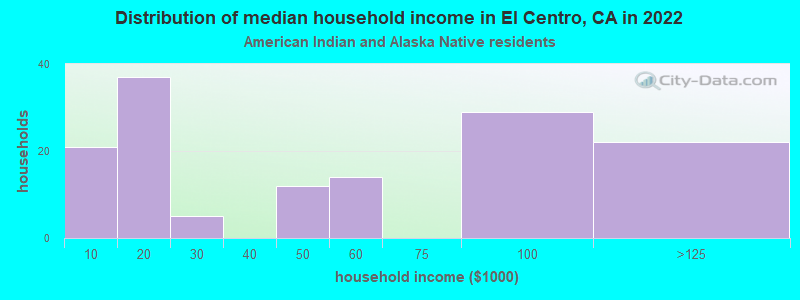
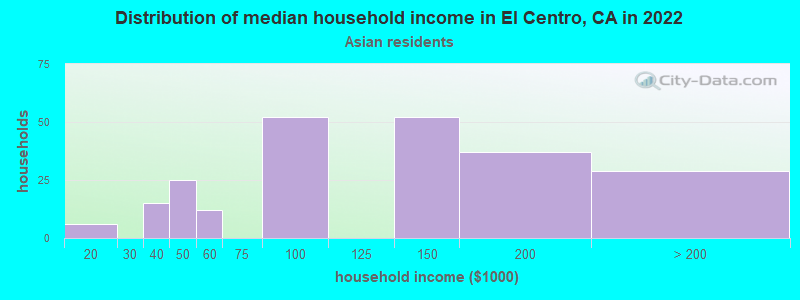
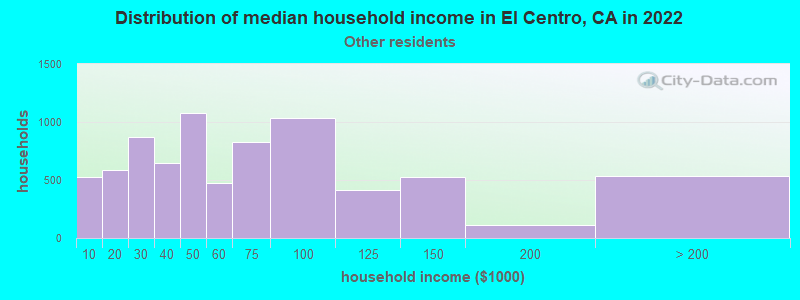
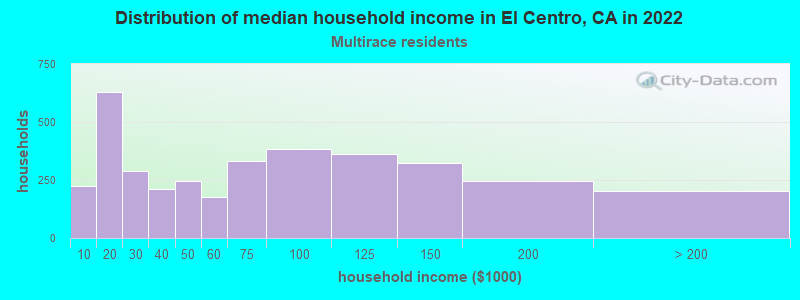
Income and house value in El Centro Median household income in 2022 $88,358 White non-Hispanic householders$32,187 Black householders$110,461 American Indian and Alaska Native householders$145,928 Asian householders$58,092 Some other race householders$72,347 Two or more races householders$57,526 Hispanic or Latino race householdersMedian 2022 house value $416,438 White Non-Hispanic householders$350,211 Black or African American householders$387,644 American Indian or Alaska Native householders $410,679 Asian householders$341,573 Some other race householders$418,598 Two or more races householders$352,011 Hispanic or Latino householders
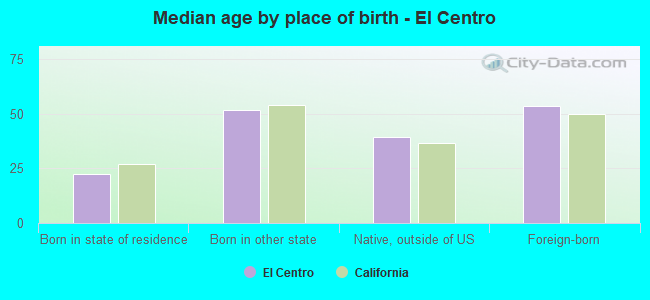
Median age by race in El Centro
35.7 Median age for White residents35.0 37.5 40.5 Median age for Black or African American residents43.2 19.2 35.2 Median age for American Indian / Alaska Native residents35.9 41.8 44.2 Median age for Asian residents33.1 37.5 32.5 Median age for Native Hawaiian / Pacific Islander residents34.2 Median age for Other race residents31.8 37.8 43.2 Median age for Two or more races residents17.8 79.0 55.6 Median age for White alone residents51.4 59.0 32.8 Median age for Hispanic or Latino residents30.3 34.6
Owner/renter occupied households by race in El Centro
House owners and renters - White residents 3,045 59.1% Owner occupied2,107 40.9% Renter occupiedHouse owners and renters - Black or African American residents 84 25.1% Owner occupied250 74.9% Renter occupiedHouse owners and renters - American Indian / Alaska Native residents 68 67.3% Owner occupied33 32.7% Renter occupiedHouse owners and renters - Asian residents 193 49.6% Owner occupied197 50.4% Renter occupiedHouse owners and renters - Native Hawaiian / Pacific Islander residents 7 100.0% Renter occupiedHouse owners and renters - Other race residents 2,709 45.0% Owner occupied3,313 55.0% Renter occupiedHouse owners and renters - Two or more races residents 475 52.1% Owner occupied436 47.9% Renter occupiedHouse owners and renters - White alone residents 1,070 69.2% Owner occupied477 30.8% Renter occupiedHouse owners and renters - Hispanic or Latino residents 5,306 47.9% Owner occupied5,761 52.1% Renter occupied
Language usage in El Centro
English speakers - Total 20.3% of residents of El Centro speak English at home.
76.7% of residents speak Spanish at home 20,099 64.5% Speak English very well11,060 35.5% Speak English less than very well1.9% of residents speak other language at home 276 35.3% Speak English very well506 64.7% Speak English less than very well
English speakers - Born in the United States 60.9% of residents of El Centro speak English at home.
38.5% of residents speak Spanish at home 664 78.3% Speak English very well184 21.7% Speak English less than very well0.4% of residents speak other language at home 8 100.0% Speak English very well
English speakers - Native, born elsewhere 10.1% of residents of El Centro speak English at home.
91.6% of residents speak Spanish at home 1,245 65.6% Speak English very well653 34.4% Speak English less than very well0.6% of residents speak other language at home 13 100.0% Speak English very well
English speakers - Foreign-born 3.9% of residents of El Centro speak English at home.
87.8% of residents speak Spanish at home 3,584 30.1% Speak English very well8,310 69.9% Speak English less than very well5.1% of residents speak other language at home 187 27.2% Speak English very well501 72.8% Speak English less than very well
White (Caucasian) - Speak only English Native:
40.1% (4,654)Foreign-born:
7.9% (232)
White (Caucasian) - Speak another language Native:
46.3% (5,378)Foreign-born:
88.7% (2,613)
Black or African American - Speak another language Native:
17.9% (142)Foreign-born:
100.0% (51)
American Indian / Alaska Native - Speak another language Native:
96.6% (255)Foreign-born:
100.0% (232)
Asian - Speak only English Native:
64.7% (212)Foreign-born:
20.5% (137)
Asian - Speak another language Native:
34.4% (113)Foreign-born:
83.3% (556)
Native Hawaiian / Pacific Islander - Speak only English Native:
97.9% (78)Foreign-born:
66.3% (17)
Native Hawaiian / Pacific Islander - Speak another language Native:
8.3% (7)Foreign-born:
45.9% (12)
Other race - Speak only English Native:
7.1% (1,008)Foreign-born:
1.7% (147)
Other race - Speak another language Native:
89.1% (12,560)Foreign-born:
97.1% (8,296)
Two or more races - Speak only English Native:
41.1% (1,747)Foreign-born:
0.9% (14)
Two or more races - Speak another language Native:
100.0% (4,245)Foreign-born:
100.0% (1,452)
White alone - Speak only English Native:
89.3% (2,650)Foreign-born:
66.1% (138)
White alone - Speak another language Native:
9.7% (289)Foreign-born:
31.2% (65)
Hispanic or Latino - Speak only English Native:
15.2% (3,803)Foreign-born:
1.8% (211)
Hispanic or Latino - Speak another language Native:
82.8% (20,705)Foreign-born:
97.2% (11,370)
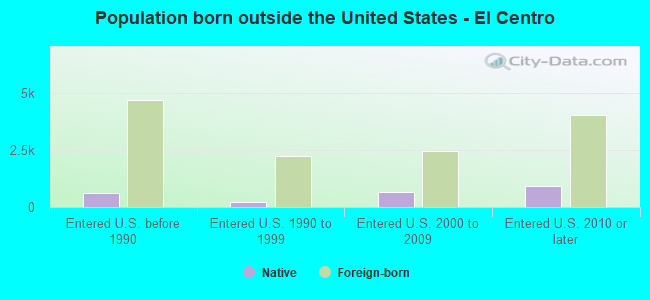
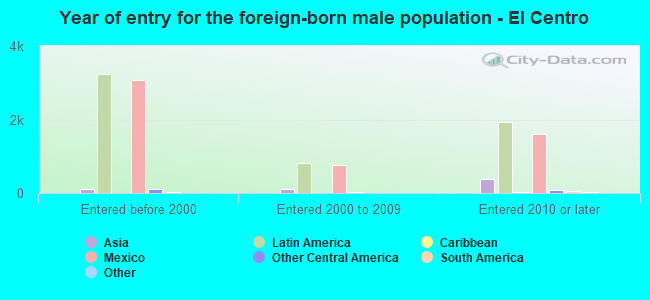
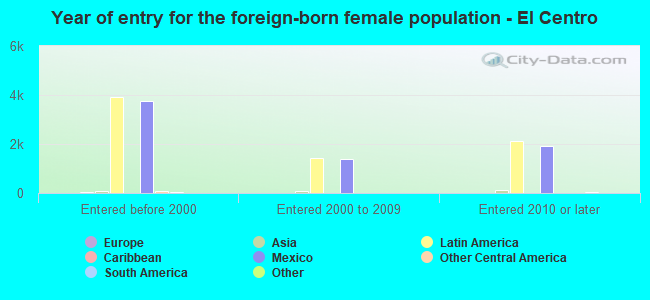
Foreign-born residents in El Centro 13,880 residents are foreign born (29.2% Latin America ).
This city:
31.4%California:
100.0%
Marital status for residents in El Centro Marital status - White (Caucasian) population 15 years and over
Males 34.2% Never married50.8% Now married1.8% Separated3.7% Widowed9.5% DivorcedFemales 32.0% Never married45.0% Now married3.6% Separated9.5% Widowed9.9% DivorcedWomen who gave birth in the past 12 months Now married:
76.7% (76)Unmarried:
23.3% (23)
Women who did not give birth in the past 12 months Now married:
43.4% (1,400)Unmarried:
56.6% (1,825)
Marital status - Black or African American population 15 years and over
Males 47.3% Never married26.8% Now married5.1% Separated0.0% Widowed20.8% DivorcedFemales 52.5% Never married7.6% Now married8.0% Separated9.1% Widowed22.8% DivorcedWomen who did not give birth in the past 12 months Now married:
16.9% (23)Unmarried:
83.1% (111)
Marital status - American Indian / Alaska Native population 15 years and over
Males 65.7% Never married34.3% Now married0.0% Separated0.0% Widowed0.0% DivorcedFemales 20.6% Never married35.3% Now married7.4% Separated33.1% Widowed3.7% DivorcedWomen who did not give birth in the past 12 months Now married:
31.7% (19)Unmarried:
68.3% (41)
Marital status - Asian population 15 years and over
Males 26.2% Never married59.5% Now married4.9% Separated0.0% Widowed9.4% DivorcedFemales 19.8% Never married76.2% Now married0.0% Separated4.0% Widowed0.0% DivorcedWomen who gave birth in the past 12 months Now married:
100.0% (58)Unmarried:
0.0% (0)
Women who did not give birth in the past 12 months Now married:
60.7% (111)Unmarried:
39.3% (72)
Marital status - Native Hawaiian / Pacific Islander population 15 years and over
Males 93.6% Never married6.4% Now married0.0% Separated0.0% Widowed0.0% DivorcedFemales 0.0% Never married33.3% Now married0.0% Separated0.0% Widowed66.7% DivorcedWomen who did not give birth in the past 12 months Now married:
33.3% (5)Unmarried:
66.7% (10)
Marital status - Other race population 15 years and over
Males 44.7% Never married43.3% Now married3.8% Separated2.1% Widowed6.1% DivorcedFemales 32.5% Never married35.7% Now married7.7% Separated13.9% Widowed10.2% DivorcedWomen who gave birth in the past 12 months Now married:
57.2% (153)Unmarried:
42.8% (114)
Women who did not give birth in the past 12 months Now married:
40.2% (1,754)Unmarried:
59.8% (2,609)
Marital status - Two or more races population 15 years and over
Males 58.3% Never married29.1% Now married0.0% Separated0.0% Widowed12.6% DivorcedFemales 43.0% Never married31.0% Now married8.8% Separated4.8% Widowed12.5% DivorcedWomen who gave birth in the past 12 months Now married:
0.0% (0)Unmarried:
100.0% (160)
Women who did not give birth in the past 12 months Now married:
37.4% (509)Unmarried:
62.6% (853)
Marital status - White alone, not Hispanic / Latino population 15 years and over
Males 23.3% Never married53.2% Now married2.3% Separated3.6% Widowed17.6% DivorcedFemales 18.5% Never married50.5% Now married1.7% Separated14.7% Widowed14.5% DivorcedWomen who did not give birth in the past 12 months Now married:
44.0% (236)Unmarried:
56.0% (301)
Marital status - Hispanic or Latino population 15 years and over
Males 42.6% Never married45.4% Now married2.7% Separated2.6% Widowed6.6% DivorcedFemales 34.3% Never married38.4% Now married6.5% Separated11.3% Widowed9.5% DivorcedWomen who gave birth in the past 12 months Now married:
60.6% (258)Unmarried:
39.4% (168)
Women who did not give birth in the past 12 months Now married:
41.3% (3,558)Unmarried:
58.7% (5,058)
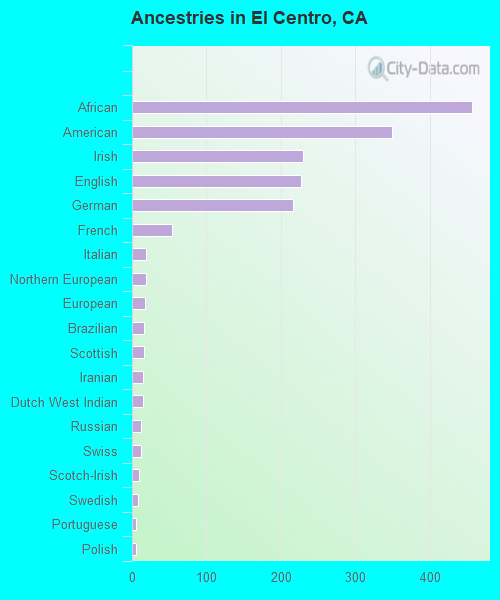
Ancestries in El Centro
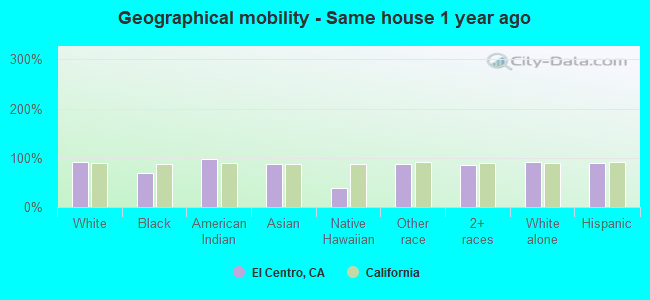
395 1.2% American266 0.8% English202 0.6% German170 0.5% African145 0.4% Irish82 0.2% French76 0.2% Iranian64 0.2% European55 0.2% Italian39 0.1% Israeli37 0.1% Swedish35 0.1% Scottish27 0.08% Brazilian25 0.07% Swiss18 0.05% Russian12 0.04% Haitian11 0.03% West Indian9 0.03% Scotch-Irish9 0.03% Ukrainian9 0.03% Yugoslavian7 0.02% Dutch7 0.02% Northern European7 0.02% Belizean7 0.02% Dutch West Indian5 0.01% Portuguese2 0.01% Polish
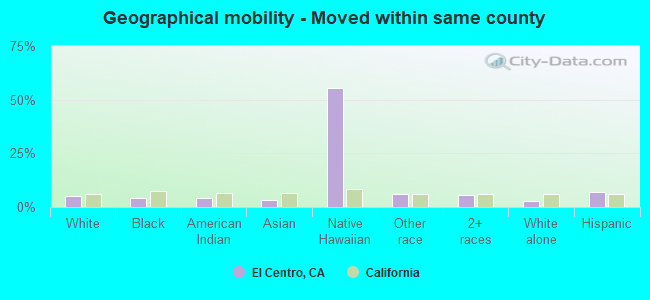
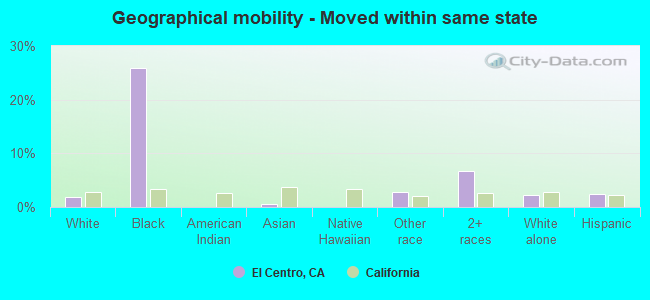
Geographical mobility in El Centro Same house 1 year ago 13,419 90.7% White (Caucasian)648 70.1% Black or African American461 97.3% American Indian / Alaska Native915 86.9% Asian44 39.4% Native Hawaiian / Pacific Islander18,392 87.4% Other race5,170 86.0% Two or more races3,154 91.0% White alone, not Hispanic / Latino34,227 88.6% Hispanic or LatinoMoved within same county 789 5.3% White / Caucasian37 4.0% Black or African American21 4.4% American Indian / Alaska Native35 3.3% Asian61 55.3% Native Hawaiian / Pacific Islander1,317 6.3% Other race328 5.5% Two or more races105 3.0% White alone, not Hispanic / Latino2,665 6.9% Hispanic or LatinoMoved within same state 273 1.8% White / Caucasian239 25.9% Black or African American6 0.6% Asian602 2.9% Other race399 6.6% Two or more races80 2.3% White alone, not Hispanic / Latino945 2.4% Hispanic or LatinoMoved from different state 216 1.5% White / Caucasian17 1.6% Asian7 0.0% Other race45 0.7% Two or more races95 2.7% White alone, not Hispanic / Latino204 0.5% Hispanic or LatinoMoved from abroad 118 0.8% White12 1.3% Black or African American55 5.2% Asian512 2.4% Other race9 0.1% Two or more races44 1.3% White alone, not Hispanic / Latino522 1.4% Hispanic or Latino
Children Nativity (place of birth) in El Centro
Children under 6 years - Living with two parents Both parents native 917 100.0% NativeBoth parents foreign-born 338 82.3% Native73 17.7% Foreign-bornOne native, one foreign-born parent 610 100.0% NativeChildren under 6 years - Living with one parent Native parent 1,494 100.0% Native0 0.0% Foreign-bornForeign-born parent 188 93.3% Native13 6.7% Foreign-bornChildren 6 to 17 years - Living with two parents Both parents native 1,506 100.0% NativeBoth parents foreign-born 1,188 81.2% Native275 18.8% Foreign-bornOne native, one foreign-born parent 1,346 90.0% Native149 10.0% Foreign-bornChildren 6 to 17 years - Living with one parent Native parent 2,057 100.0% NativeForeign-born parent 1,426 50.7% Native1,389 49.3% Foreign-born
Grandparents responsible for own grandchildren in El Centro
Grandparents (30 to 59 years) White / Caucasian 140 40.3% Responsible for grandchildren207 59.7% Not responsible for grandchildrenAmerican Indian / Alaska Native 7 100.0% Not responsible for grandchildrenAsian 13 100.0% Responsible for grandchildrenOther race 149 26.4% Responsible for grandchildren414 73.6% Not responsible for grandchildrenTwo or more races 15 100.0% Responsible for grandchildrenWhite alone, not Hispanic / Latino 2 6.7% Responsible for grandchildren22 93.3% Not responsible for grandchildrenHispanic or Latino 309 25.9% Responsible for grandchildren883 74.1% Not responsible for grandchildrenGrandparents (60 years and over) White / Caucasian 193 45.8% Responsible for grandchildren229 54.2% Not responsible for grandchildrenAmerican Indian / Alaska Native 63 100.0% Not responsible for grandchildrenAsian 43 100.0% Not responsible for grandchildrenOther race 204 29.8% Responsible for grandchildren479 70.2% Not responsible for grandchildrenTwo or more races 61 100.0% Not responsible for grandchildrenWhite alone, not Hispanic / Latino 22 29.7% Responsible for grandchildren51 70.3% Not responsible for grandchildrenHispanic or Latino 608 45.7% Responsible for grandchildren723 54.3% Not responsible for grandchildren