Races in Gunnison, Utah (UT) Detailed Stats
Data:
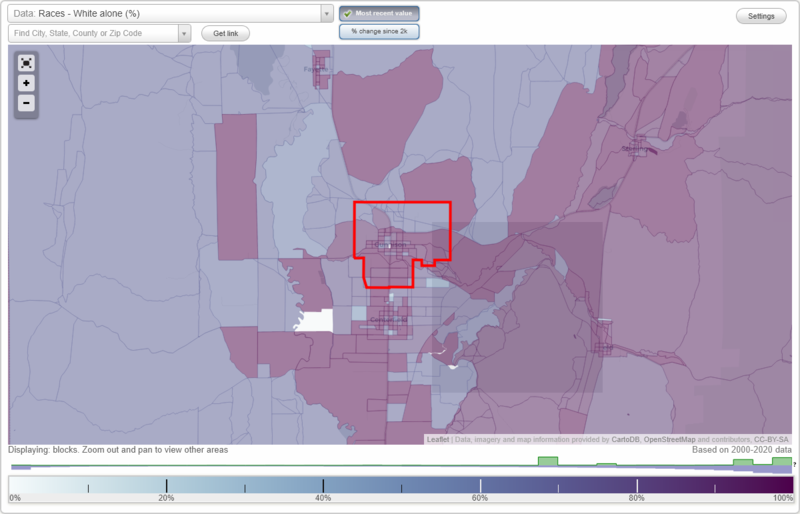
Races - White alone (%)
Races - White alone (% change since 2000)
Races - Black alone (%)
Races - Black alone (% change since 2000)
Races - American Indian alone (%)
Races - American Indian alone (% change since 2000)
Races - Asian alone (%)
Races - Asian alone (% change since 2000)
Races - Hispanic (%)
Races - Hispanic (% change since 2000)
Races - Native Hawaiian and Other Pacific Islander alone (%)
Races - Native Hawaiian and Other Pacific Islander alone (% change since 2000)
Races - Two or more races(%)
Races - Two or more races(% change since 2000)
Races - Other race alone (%)
Races - Other race alone (% change since 2000)
Racial diversity
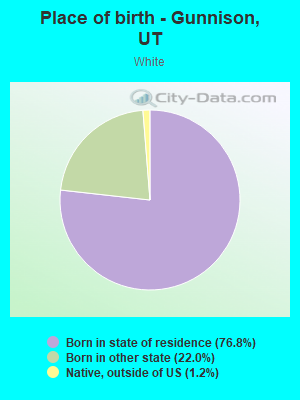
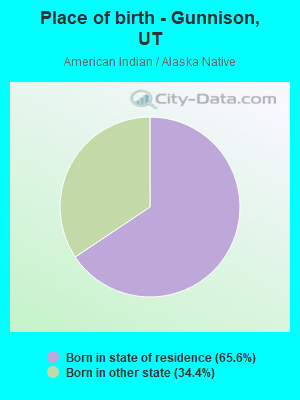
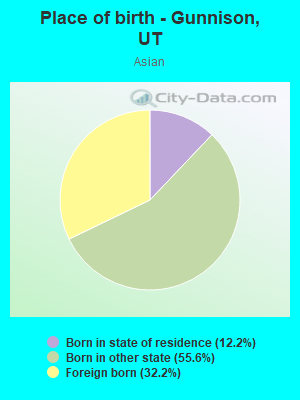
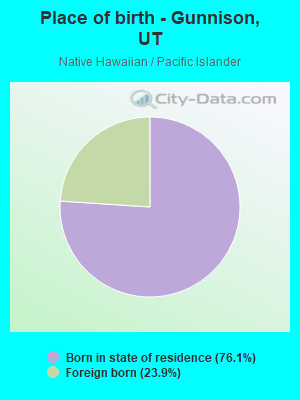
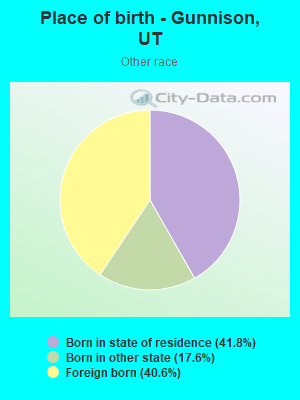
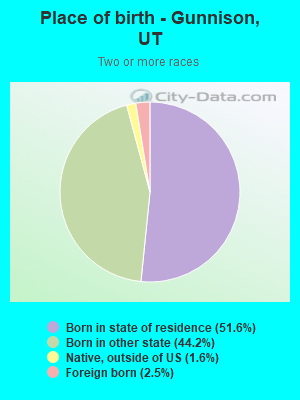
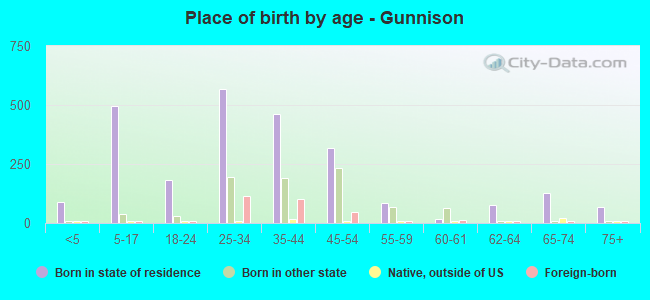
Place of birth - Born in state of residence (%)
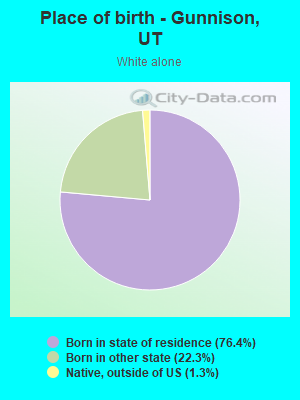
Place of birth - Born in state of residence (%) - White
Place of birth - Born in state of residence (%) - Black or African American
Place of birth - Born in state of residence (%) - Asian
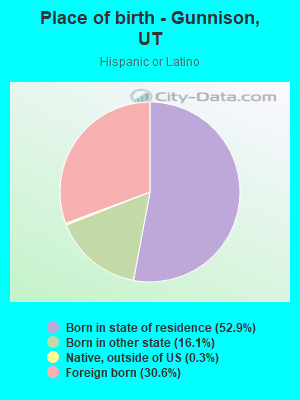
Place of birth - Born in state of residence (%) - Hispanic or Latino
Place of birth - Born in state of residence (%) - American Indian and Alaska Native
Place of birth - Born in state of residence (%) - Multirace
Place of birth - Born in state of residence (%) - Other Race
Place of birth - Born in other state (%)
Place of birth - Born in other state (%) - White
Place of birth - Born in other state (%) - Black or African American
Place of birth - Born in other state (%) - Asian
Place of birth - Born in other state (%) - Hispanic or Latino
Place of birth - Born in other state (%) - American Indian and Alaska Native
Place of birth - Born in other state (%) - Multirace
Place of birth - Born in other state (%) - Other Race
Place of birth - Native, outside of US (%)
Place of birth - Native, outside of US (%) - White
Place of birth - Native, outside of US (%) - Black or African American
Place of birth - Native, outside of US (%) - Asian
Place of birth - Native, outside of US (%) - Hispanic or Latino
Place of birth - Native, outside of US (%) - American Indian and Alaska Native
Place of birth - Native, outside of US (%) - Multirace
Place of birth - Native, outside of US (%) - Other Race
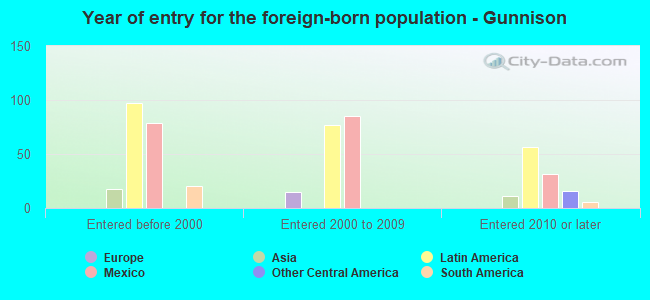
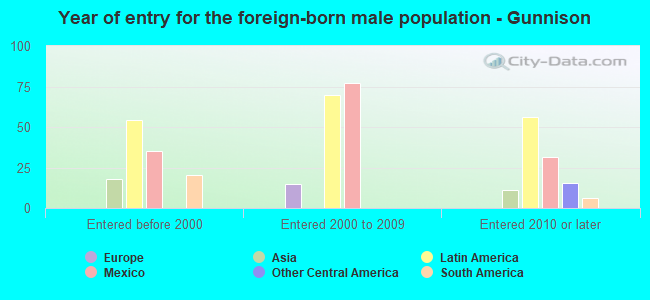
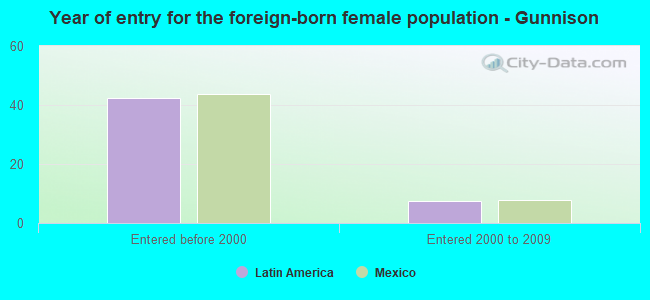
Place of birth - Foreign born (%)
Place of birth - Foreign born (%) - White
Place of birth - Foreign born (%) - Black or African American
Place of birth - Foreign born (%) - Asian
Place of birth - Foreign born (%) - Hispanic or Latino
Place of birth - Foreign born (%) - American Indian and Alaska Native
Place of birth - Foreign born (%) - Multirace
Place of birth - Foreign born (%) - Other Race
Residents speaking English at home (%)
Residents speaking English at home - Born in the United States (%)
Residents speaking English at home - Native, born elsewhere (%)
Residents speaking English at home - Foreign born (%)
Residents speaking Spanish at home (%)
Residents speaking Spanish at home - Born in the United States (%)
Residents speaking Spanish at home - Native, born elsewhere (%)
Residents speaking Spanish at home - Foreign born (%)
Residents speaking other language at home (%)
Residents speaking other language at home - Born in the United States (%)
Residents speaking other language at home - Native, born elsewhere (%)
Residents speaking other language at home - Foreign born (%)
Marital status - Never married (%)
Marital status - Now married (%)
Marital status - Separated (%)
Marital status - Widowed (%)
Marital status - Divorced (%)
Ancestries Reported - Arab (%)
Ancestries Reported - Czech (%)
Ancestries Reported - Danish (%)
Ancestries Reported - Dutch (%)
Ancestries Reported - English (%)
Ancestries Reported - French (%)
Ancestries Reported - French Canadian (%)
Ancestries Reported - German (%)
Ancestries Reported - Greek (%)
Ancestries Reported - Hungarian (%)
Ancestries Reported - Irish (%)
Ancestries Reported - Italian (%)
Ancestries Reported - Lithuanian (%)
Ancestries Reported - Norwegian (%)
Ancestries Reported - Polish (%)
Ancestries Reported - Portuguese (%)
Ancestries Reported - Russian (%)
Ancestries Reported - Scotch-Irish (%)
Ancestries Reported - Scottish (%)
Ancestries Reported - Slovak (%)
Ancestries Reported - Subsaharan African (%)
Ancestries Reported - Swedish (%)
Ancestries Reported - Swiss (%)
Ancestries Reported - Ukrainian (%)
Ancestries Reported - United States (%)
Ancestries Reported - Welsh (%)
Ancestries Reported - West Indian (%)
Ancestries Reported - Other (%)
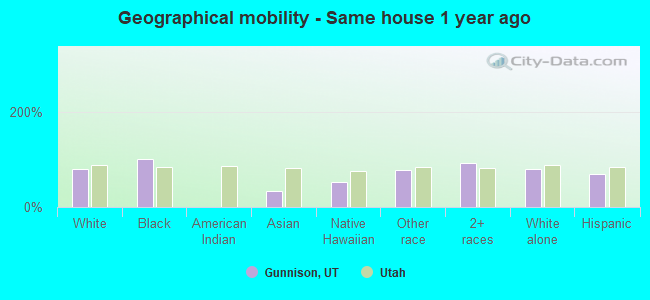
Geographical mobility - Same house 1 year ago (%)
Geographical mobility - Same house 1 year ago (%) - White
Geographical mobility - Same house 1 year ago (%) - Black or African American
Geographical mobility - Same house 1 year ago (%) - Asian
Geographical mobility - Same house 1 year ago (%) - Hispanic or Latino
Geographical mobility - Same house 1 year ago (%) - American Indian and Alaska Native
Geographical mobility - Same house 1 year ago (%) - Multirace
Geographical mobility - Same house 1 year ago (%) - Other Race
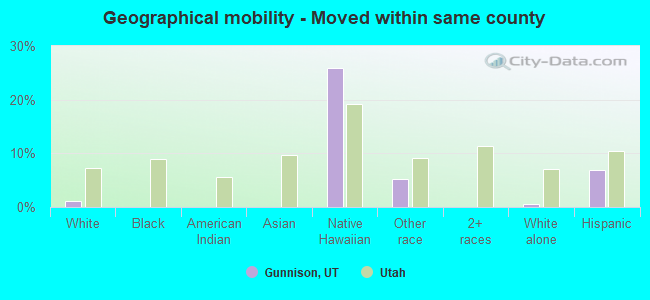
Geographical mobility - Moved within same county (%)
Geographical mobility - Moved within same county (%) - White
Geographical mobility - Moved within same county (%) - Black or African American
Geographical mobility - Moved within same county (%) - Asian
Geographical mobility - Moved within same county (%) - Hispanic or Latino
Geographical mobility - Moved within same county (%) - American Indian and Alaska Native
Geographical mobility - Moved within same county (%) - Multirace
Geographical mobility - Moved within same county (%) - Other Race
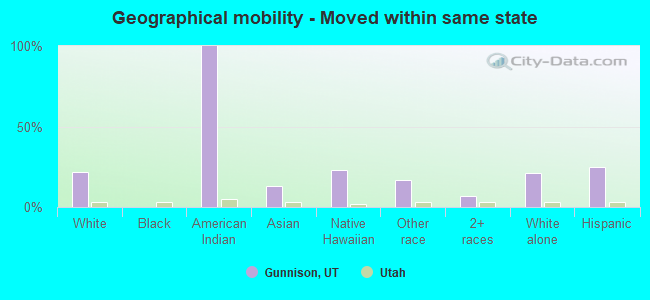
Geographical mobility - Moved from different county within same state (%)
Geographical mobility - Moved from different county within same state (%) - White
Geographical mobility - Moved from different county within same state (%) - Black or African American
Geographical mobility - Moved from different county within same state (%) - Asian
Geographical mobility - Moved from different county within same state (%) - Hispanic or Latino
Geographical mobility - Moved from different county within same state (%) - American Indian and Alaska Native
Geographical mobility - Moved from different county within same state (%) - Multirace
Geographical mobility - Moved from different county within same state (%) - Other Race
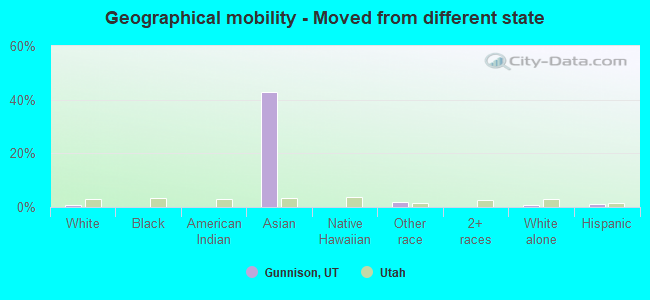
Geographical mobility - Moved from different state (%)
Geographical mobility - Moved from different state (%) - White
Geographical mobility - Moved from different state (%) - Black or African American
Geographical mobility - Moved from different state (%) - Asian
Geographical mobility - Moved from different state (%) - Hispanic or Latino
Geographical mobility - Moved from different state (%) - American Indian and Alaska Native
Geographical mobility - Moved from different state (%) - Multirace
Geographical mobility - Moved from different state (%) - Other Race
Geographical mobility - Moved from abroad (%)
Geographical mobility - Moved from abroad (%) - White
Geographical mobility - Moved from abroad (%) - Black or African American
Geographical mobility - Moved from abroad (%) - Asian
Geographical mobility - Moved from abroad (%) - Hispanic or Latino
Geographical mobility - Moved from abroad (%) - American Indian and Alaska Native
Geographical mobility - Moved from abroad (%) - Multirace
Geographical mobility - Moved from abroad (%) - Other Race
Place of birth for the foreign-born population - Ireland (%)
Place of birth for the foreign-born population - Denmark (%)
Place of birth for the foreign-born population - Norway (%)
Place of birth for the foreign-born population - Sweden (%)
Place of birth for the foreign-born population - United Kingdom (%)
Place of birth for the foreign-born population - England (%)
Place of birth for the foreign-born population - Scotland (%)
Place of birth for the foreign-born population - Other Northern Europe (%)
Place of birth for the foreign-born population - Austria (%)
Place of birth for the foreign-born population - Belgium (%)
Place of birth for the foreign-born population - France (%)
Place of birth for the foreign-born population - Germany (%)
Place of birth for the foreign-born population - Netherlands (%)
Place of birth for the foreign-born population - Switzerland (%)
Place of birth for the foreign-born population - Other Western Europe (%)
Place of birth for the foreign-born population - Greece (%)
Place of birth for the foreign-born population - Italy (%)
Place of birth for the foreign-born population - Portugal (%)
Place of birth for the foreign-born population - Spain (%)
Place of birth for the foreign-born population - Other Southern Europe (%)
Place of birth for the foreign-born population - Albania (%)
Place of birth for the foreign-born population - Belarus (%)
Place of birth for the foreign-born population - Bosnia and Herzegovina (%)
Place of birth for the foreign-born population - Bulgaria (%)
Place of birth for the foreign-born population - Croatia (%)
Place of birth for the foreign-born population - Czechoslovakia (%)
Place of birth for the foreign-born population - Hungary (%)
Place of birth for the foreign-born population - Latvia (%)
Place of birth for the foreign-born population - Lithuania (%)
Place of birth for the foreign-born population - North Macedonia (Macedonia) (%)
Place of birth for the foreign-born population - Moldova (%)
Place of birth for the foreign-born population - Poland (%)
Place of birth for the foreign-born population - Romania (%)
Place of birth for the foreign-born population - Russia (%)
Place of birth for the foreign-born population - Serbia (%)
Place of birth for the foreign-born population - Ukraine (%)
Place of birth for the foreign-born population - Other Eastern Europe (%)
Place of birth for the foreign-born population - China (%)
Place of birth for the foreign-born population - Hong Kong (%)
Place of birth for the foreign-born population - Taiwan (%)
Place of birth for the foreign-born population - Japan (%)
Place of birth for the foreign-born population - Korea (%)
Place of birth for the foreign-born population - Other Eastern Asia (%)
Place of birth for the foreign-born population - Afghanistan (%)
Place of birth for the foreign-born population - Bangladesh (%)
Place of birth for the foreign-born population - India (%)
Place of birth for the foreign-born population - Iran (%)
Place of birth for the foreign-born population - Kazakhstan (%)
Place of birth for the foreign-born population - Nepal (%)
Place of birth for the foreign-born population - Pakistan (%)
Place of birth for the foreign-born population - Sri Lanka (%)
Place of birth for the foreign-born population - Uzbekistan (%)
Place of birth for the foreign-born population - Other South Central Asia (%)
Place of birth for the foreign-born population - Burma (%)
Place of birth for the foreign-born population - Cambodia (%)
Place of birth for the foreign-born population - Indonesia (%)
Place of birth for the foreign-born population - Laos (%)
Place of birth for the foreign-born population - Malaysia (%)
Place of birth for the foreign-born population - Philippines (%)
Place of birth for the foreign-born population - Singapore (%)
Place of birth for the foreign-born population - Thailand (%)
Place of birth for the foreign-born population - Vietnam (%)
Place of birth for the foreign-born population - Other South Eastern Asia (%)
Place of birth for the foreign-born population - Armenia (%)
Place of birth for the foreign-born population - Iraq (%)
Place of birth for the foreign-born population - Israel (%)
Place of birth for the foreign-born population - Jordan (%)
Place of birth for the foreign-born population - Kuwait (%)
Place of birth for the foreign-born population - Lebanon (%)
Place of birth for the foreign-born population - Saudi Arabia (%)
Place of birth for the foreign-born population - Syria (%)
Place of birth for the foreign-born population - Turkey (%)
Place of birth for the foreign-born population - Yemen (%)
Place of birth for the foreign-born population - Other Western Asia (%)
Place of birth for the foreign-born population - Eritrea (%)
Place of birth for the foreign-born population - Ethiopia (%)
Place of birth for the foreign-born population - Kenya (%)
Place of birth for the foreign-born population - Somalia (%)
Place of birth for the foreign-born population - Uganda (%)
Place of birth for the foreign-born population - Zimbabwe (%)
Place of birth for the foreign-born population - Other Eastern Africa (%)
Place of birth for the foreign-born population - Cameroon (%)
Place of birth for the foreign-born population - Congo (%)
Place of birth for the foreign-born population - Democratic Republic of Congo (Zaire) (%)
Place of birth for the foreign-born population - Other Middle Africa (%)
Place of birth for the foreign-born population - Egypt (%)
Place of birth for the foreign-born population - Morocco (%)
Place of birth for the foreign-born population - Sudan (%)
Place of birth for the foreign-born population - Other Northern Africa (%)
Place of birth for the foreign-born population - South Africa (%)
Place of birth for the foreign-born population - Other Southern Africa (%)
Place of birth for the foreign-born population - Cabo Verde (%)
Place of birth for the foreign-born population - Ghana (%)
Place of birth for the foreign-born population - Liberia (%)
Place of birth for the foreign-born population - Nigeria (%)
Place of birth for the foreign-born population - Senegal (%)
Place of birth for the foreign-born population - Sierra Leone (%)
Place of birth for the foreign-born population - Other Western Africa (%)
Place of birth for the foreign-born population - Australia (%)
Place of birth for the foreign-born population - New Zealand (%)
Place of birth for the foreign-born population - Fiji (%)
Place of birth for the foreign-born population - Micronesia (%)
Place of birth for the foreign-born population - Bahamas (%)
Place of birth for the foreign-born population - Barbados (%)
Place of birth for the foreign-born population - Cuba (%)
Place of birth for the foreign-born population - Dominica (%)
Place of birth for the foreign-born population - Dominican Republic (%)
Place of birth for the foreign-born population - Grenada (%)
Place of birth for the foreign-born population - Haiti (%)
Place of birth for the foreign-born population - Jamaica (%)
Place of birth for the foreign-born population - St. Vincent and the Grenadines (%)
Place of birth for the foreign-born population - Trinidad and Tobago (%)
Place of birth for the foreign-born population - West Indies (%)
Place of birth for the foreign-born population - Other Caribbean (%)
Place of birth for the foreign-born population - Belize (%)
Place of birth for the foreign-born population - Costa Rica (%)
Place of birth for the foreign-born population - El Salvador (%)
Place of birth for the foreign-born population - Guatemala (%)
Place of birth for the foreign-born population - Honduras (%)
Place of birth for the foreign-born population - Mexico (%)
Place of birth for the foreign-born population - Nicaragua (%)
Place of birth for the foreign-born population - Panama (%)
Place of birth for the foreign-born population - Other Central America (%)
Place of birth for the foreign-born population - Argentina (%)
Place of birth for the foreign-born population - Bolivia (%)
Place of birth for the foreign-born population - Brazil (%)
Place of birth for the foreign-born population - Chile (%)
Place of birth for the foreign-born population - Colombia (%)
Place of birth for the foreign-born population - Ecuador (%)
Place of birth for the foreign-born population - Guyana (%)
Place of birth for the foreign-born population - Peru (%)
Place of birth for the foreign-born population - Uruguay (%)
Place of birth for the foreign-born population - Venezuela (%)
Place of birth for the foreign-born population - Other South America (%)
Place of birth for the foreign-born population - Canada (%)
Place of birth for the foreign-born population - Other Northern America (%)
Place of birth for the foreign-born population - Other (%)
Latest news about races in Gunnison, UT collected exclusively by city-data.com from local newspapers, TV, and radio stations
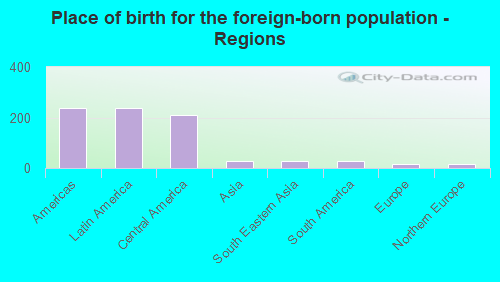
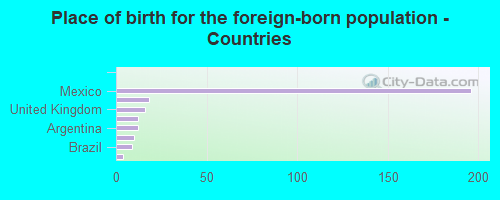
According to 2022 data, the most numerous races in Gunnison, UT are White alone (2,487 residents), Hispanic (797 residents), and Two or more races (120 residents). 81.5% of Gunnison residents speak English at home. 7.8% of Gunnison, UT residents are foreign-born (6.3% born in Latin America), which is 3.1% less than the foreign-born rate of 8.0% across the entire state of Utah.
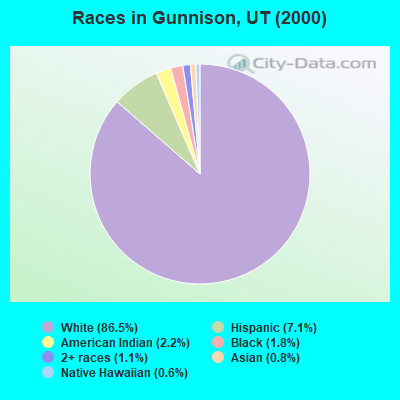
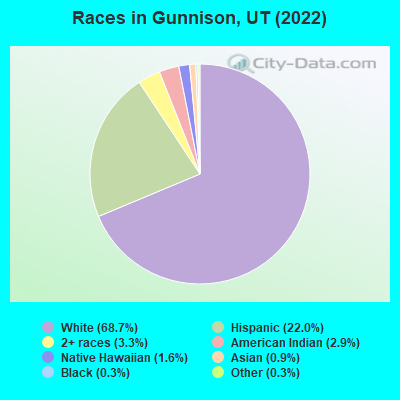
Race distribution in Gunnison
2000 2022
1,904,265 85.3% White alone 201,559 9.0% Hispanic 36,483 1.6% Asian alone 31,308 1.4% Two or more races 26,663 1.2% American Indian alone 14,806 0.7% Native Hawaiian and Other 16,137 0.7% Black alone 1,948 0.09% Other race alone
2,557,466 75.6% White alone 512,086 15.1% Hispanic 119,308 3.5% Two or more races 82,388 2.4% Asian alone 36,978 1.1% Native Hawaiian and Other 34,873 1.0% Black alone 22,803 0.7% American Indian alone 14,898 0.4% Other race alone
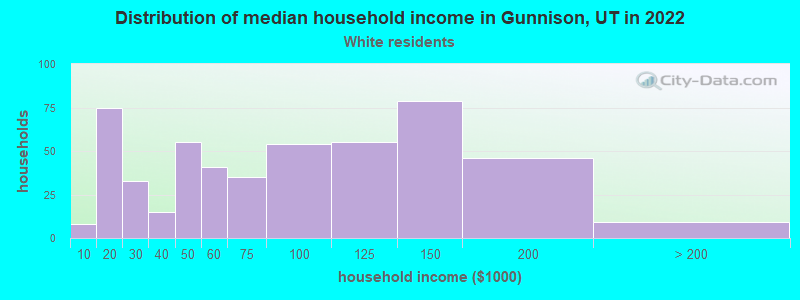
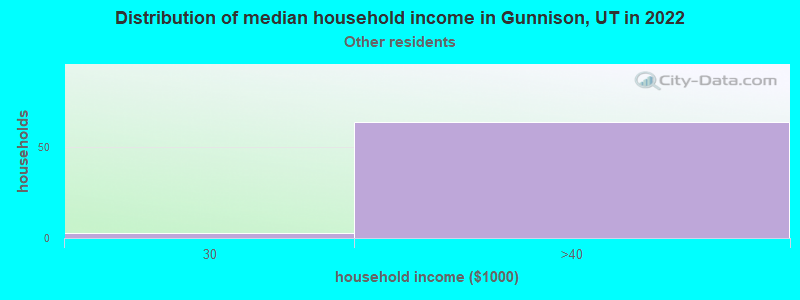
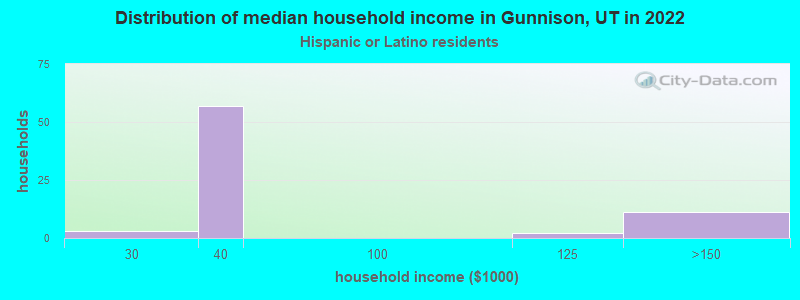
Income and house value in Gunnison Median household income in 2022 $66,692 White non-Hispanic householders$34,639 Some other race householders$35,062 Hispanic or Latino race householdersMedian 2022 house value $285,278 White Non-Hispanic householders $682,121 Asian householders$341,060 Some other race householders$341,060 Hispanic or Latino householders
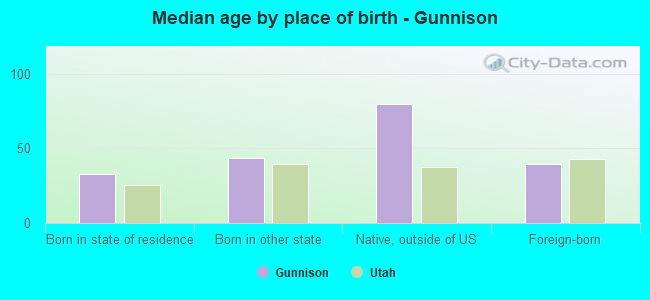
Median age by race in Gunnison
38.7 Median age for White residents39.3 32.4 -640,726,328.8 Median age for Black or African American residents-620,437,955.6 -686,357,242.6 39.8 Median age for American Indian / Alaska Native residents40.6 -694,006,308.5 22.4 Median age for Asian residents22.5 -679,775,280.2 30.5 Median age for Native Hawaiian / Pacific Islander residents30.4 -664,285,713.6 32.2 Median age for Other race residents35.1 11.3 33.5 Median age for Two or more races residents29.5 -714,499,251.9 38.9 Median age for White alone residents39.2 31.9 31.7 Median age for Hispanic or Latino residents35.0 19.6
Owner/renter occupied households by race in Gunnison
House owners and renters - White residents 420 82.7% Owner occupied88 17.3% Renter occupiedHouse owners and renters - Native Hawaiian / Pacific Islander residents 8 100.0% Renter occupiedHouse owners and renters - Other race residents 9 13.9% Owner occupied55 86.1% Renter occupiedHouse owners and renters - Two or more races residents 59 100.0% Owner occupiedHouse owners and renters - White alone residents 413 82.1% Owner occupied90 17.9% Renter occupiedHouse owners and renters - Hispanic or Latino residents 21 29.9% Owner occupied49 70.1% Renter occupied
Language usage in Gunnison
English speakers - Total 81.5% of residents of Gunnison speak English at home.
14.3% of residents speak Spanish at home 390 76.8% Speak English very well118 23.2% Speak English less than very well3.8% of residents speak other language at home 121 89.6% Speak English very well14 10.4% Speak English less than very well
English speakers - Born in the United States 82.5% of residents of Gunnison speak English at home.
12.4% of residents speak Spanish at home 103 100.0% Speak English very well4.7% of residents speak other language at home 39 100.0% Speak English very well
English speakers - Native, born elsewhere 40.5% of residents of Gunnison speak English at home.
8.1% of residents speak Spanish at home 3 100.0% Speak English very well62.2% of residents speak other language at home 23 100.0% Speak English very well
English speakers - Foreign-born 9.6% of residents of Gunnison speak English at home.
78.3% of residents speak Spanish at home 104 47.3% Speak English very well116 52.7% Speak English less than very well9.6% of residents speak other language at home 13 48.1% Speak English very well14 51.9% Speak English less than very well
Asian - Speak only English Native:
73.3% (17)Foreign-born:
100.0% (11)
Native Hawaiian / Pacific Islander - Speak another language Native:
88.8% (39)Foreign-born:
100.0% (15)
Other race - Speak only English Native:
17.4% (69)Foreign-born:
9.6% (28)
Other race - Speak another language Native:
85.1% (337)Foreign-born:
90.6% (261)
Two or more races - Speak another language Native:
7.4% (18)Foreign-born:
100.0% (6)
Hispanic or Latino - Speak only English Native:
46.3% (250)Foreign-born:
7.5% (18)
Hispanic or Latino - Speak another language Native:
53.4% (288)Foreign-born:
92.5% (227)
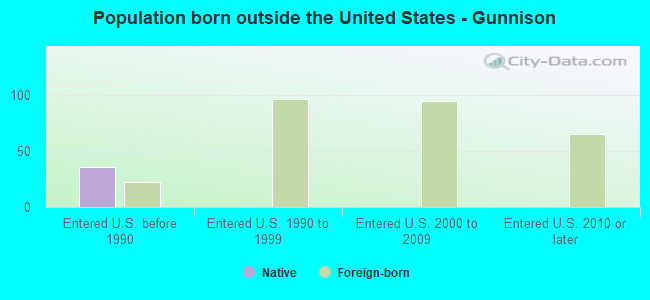
Foreign-born residents in Gunnison 281 residents are foreign born (6.3% Latin America ).
Marital status for residents in Gunnison Marital status - White (Caucasian) population 15 years and over
Males 41.9% Never married24.4% Now married1.7% Separated3.0% Widowed29.1% DivorcedFemales 34.0% Never married43.2% Now married0.0% Separated11.4% Widowed11.4% DivorcedWomen who gave birth in the past 12 months Now married:
43.8% (14)Unmarried:
56.2% (18)
Women who did not give birth in the past 12 months Now married:
34.3% (128)Unmarried:
65.7% (245)
Marital status - Native Hawaiian / Pacific Islander population 15 years and over
Males 100.0% Never married0.0% Now married0.0% Separated0.0% Widowed0.0% DivorcedFemales 100.0% Never married0.0% Now married0.0% Separated0.0% Widowed0.0% DivorcedWomen who did not give birth in the past 12 months Now married:
0.0% (0)Unmarried:
100.0% (10)
Marital status - Other race population 15 years and over
Males 50.9% Never married22.0% Now married12.1% Separated0.0% Widowed15.0% DivorcedFemales 20.0% Never married80.0% Now married0.0% Separated0.0% Widowed0.0% DivorcedWomen who did not give birth in the past 12 months Now married:
80.0% (64)Unmarried:
20.0% (16)
Marital status - Two or more races population 15 years and over
Males 63.0% Never married24.4% Now married0.0% Separated0.0% Widowed12.6% DivorcedFemales 37.9% Never married62.1% Now married0.0% Separated0.0% Widowed0.0% DivorcedWomen who did not give birth in the past 12 months Now married:
0.0% (0)Unmarried:
100.0% (33)
Marital status - White alone, not Hispanic / Latino population 15 years and over
Males 41.3% Never married24.7% Now married1.7% Separated3.1% Widowed29.3% DivorcedFemales 34.6% Never married42.3% Now married0.0% Separated11.6% Widowed11.6% DivorcedWomen who gave birth in the past 12 months Now married:
43.7% (14)Unmarried:
56.2% (18)
Women who did not give birth in the past 12 months Now married:
32.5% (121)Unmarried:
67.5% (251)
Marital status - Hispanic or Latino population 15 years and over
Males 63.4% Never married14.6% Now married8.6% Separated0.0% Widowed13.3% DivorcedFemales 17.5% Never married82.5% Now married0.0% Separated0.0% Widowed0.0% DivorcedWomen who did not give birth in the past 12 months Now married:
82.5% (70)Unmarried:
17.5% (15)
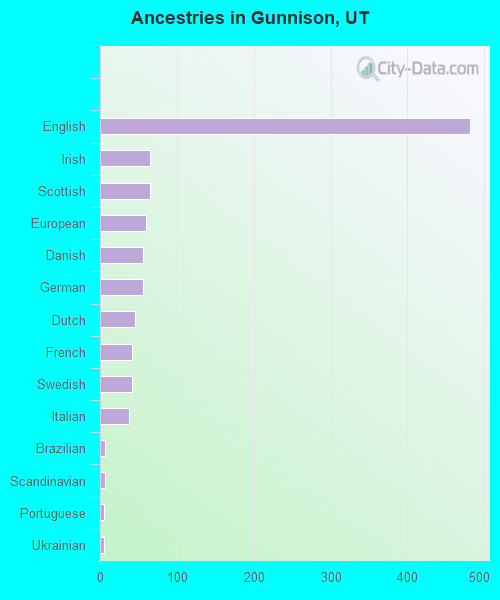
Ancestries in Gunnison
482 26.0% English65 3.5% Irish65 3.5% Scottish60 3.2% European56 3.0% Danish56 3.0% German46 2.5% Dutch42 2.3% French41 2.2% Swedish38 2.1% Italian7 0.4% Brazilian6 0.3% Scandinavian5 0.3% Portuguese5 0.3% Ukrainian4 0.2% British4 0.2% Welsh2 0.1% Canadian
Children Nativity (place of birth) in Gunnison
Children under 6 years - Living with two parents Both parents native 67 100.0% NativeBoth parents foreign-born 43 100.0% NativeChildren under 6 years - Living with one parent Native parent 71 100.0% Native
Children 6 to 17 years - Living with two parents Both parents native 212 100.0% NativeBoth parents foreign-born 96 100.0% NativeChildren 6 to 17 years - Living with one parent Native parent 125 100.0% Native
Grandparents responsible for own grandchildren in Gunnison
Grandparents (30 to 59 years) White / Caucasian 18 100.0% Not responsible for grandchildrenWhite alone, not Hispanic / Latino 19 100.0% Not responsible for grandchildren
Grandparents (60 years and over) White / Caucasian 11 100.0% Not responsible for grandchildrenWhite alone, not Hispanic / Latino 12 100.0% Not responsible for grandchildren