Races in Hailey, Idaho (ID) Detailed Stats
Data:
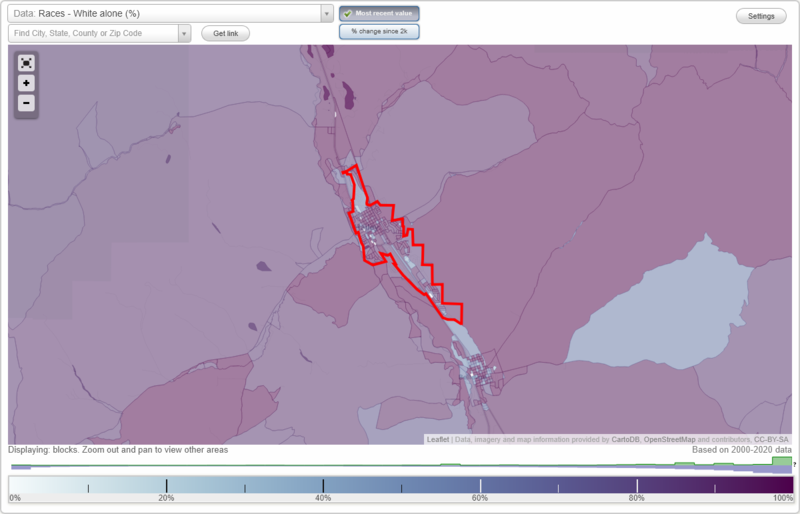
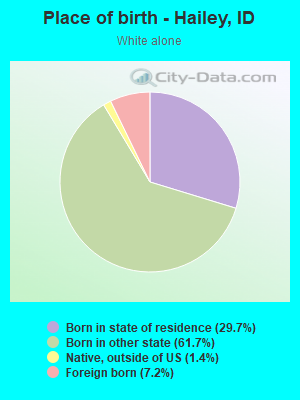
Races - White alone (%)
Races - White alone (% change since 2000)
Races - Black alone (%)
Races - Black alone (% change since 2000)
Races - American Indian alone (%)
Races - American Indian alone (% change since 2000)
Races - Asian alone (%)
Races - Asian alone (% change since 2000)
Races - Hispanic (%)
Races - Hispanic (% change since 2000)
Races - Native Hawaiian and Other Pacific Islander alone (%)
Races - Native Hawaiian and Other Pacific Islander alone (% change since 2000)
Races - Two or more races(%)
Races - Two or more races(% change since 2000)
Races - Other race alone (%)
Races - Other race alone (% change since 2000)
Racial diversity
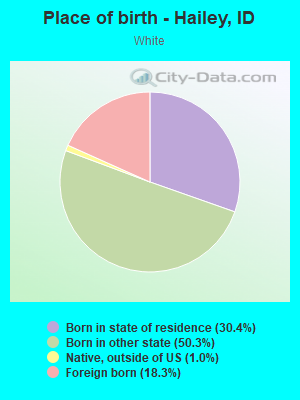
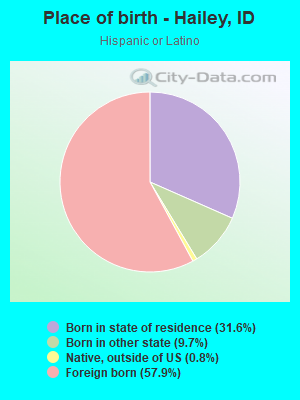
Place of birth - Born in state of residence (%)
Place of birth - Born in state of residence (%) - White
Place of birth - Born in state of residence (%) - Black or African American
Place of birth - Born in state of residence (%) - Asian
Place of birth - Born in state of residence (%) - Hispanic or Latino
Place of birth - Born in state of residence (%) - American Indian and Alaska Native
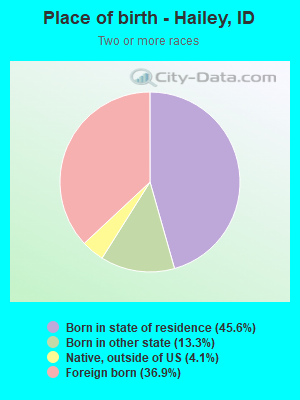
Place of birth - Born in state of residence (%) - Multirace
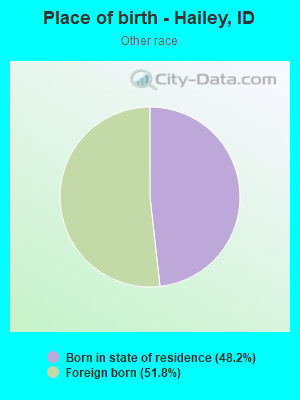
Place of birth - Born in state of residence (%) - Other Race
Place of birth - Born in other state (%)
Place of birth - Born in other state (%) - White
Place of birth - Born in other state (%) - Black or African American
Place of birth - Born in other state (%) - Asian
Place of birth - Born in other state (%) - Hispanic or Latino
Place of birth - Born in other state (%) - American Indian and Alaska Native
Place of birth - Born in other state (%) - Multirace
Place of birth - Born in other state (%) - Other Race
Place of birth - Native, outside of US (%)
Place of birth - Native, outside of US (%) - White
Place of birth - Native, outside of US (%) - Black or African American
Place of birth - Native, outside of US (%) - Asian
Place of birth - Native, outside of US (%) - Hispanic or Latino
Place of birth - Native, outside of US (%) - American Indian and Alaska Native
Place of birth - Native, outside of US (%) - Multirace
Place of birth - Native, outside of US (%) - Other Race
Place of birth - Foreign born (%)
Place of birth - Foreign born (%) - White
Place of birth - Foreign born (%) - Black or African American
Place of birth - Foreign born (%) - Asian
Place of birth - Foreign born (%) - Hispanic or Latino
Place of birth - Foreign born (%) - American Indian and Alaska Native
Place of birth - Foreign born (%) - Multirace
Place of birth - Foreign born (%) - Other Race
Residents speaking English at home (%)
Residents speaking English at home - Born in the United States (%)
Residents speaking English at home - Native, born elsewhere (%)
Residents speaking English at home - Foreign born (%)
Residents speaking Spanish at home (%)
Residents speaking Spanish at home - Born in the United States (%)
Residents speaking Spanish at home - Native, born elsewhere (%)
Residents speaking Spanish at home - Foreign born (%)
Residents speaking other language at home (%)
Residents speaking other language at home - Born in the United States (%)
Residents speaking other language at home - Native, born elsewhere (%)
Residents speaking other language at home - Foreign born (%)
Marital status - Never married (%)
Marital status - Now married (%)
Marital status - Separated (%)
Marital status - Widowed (%)
Marital status - Divorced (%)
Ancestries Reported - Arab (%)
Ancestries Reported - Czech (%)
Ancestries Reported - Danish (%)
Ancestries Reported - Dutch (%)
Ancestries Reported - English (%)
Ancestries Reported - French (%)
Ancestries Reported - French Canadian (%)
Ancestries Reported - German (%)
Ancestries Reported - Greek (%)
Ancestries Reported - Hungarian (%)
Ancestries Reported - Irish (%)
Ancestries Reported - Italian (%)
Ancestries Reported - Lithuanian (%)
Ancestries Reported - Norwegian (%)
Ancestries Reported - Polish (%)
Ancestries Reported - Portuguese (%)
Ancestries Reported - Russian (%)
Ancestries Reported - Scotch-Irish (%)
Ancestries Reported - Scottish (%)
Ancestries Reported - Slovak (%)
Ancestries Reported - Subsaharan African (%)
Ancestries Reported - Swedish (%)
Ancestries Reported - Swiss (%)
Ancestries Reported - Ukrainian (%)
Ancestries Reported - United States (%)
Ancestries Reported - Welsh (%)
Ancestries Reported - West Indian (%)
Ancestries Reported - Other (%)
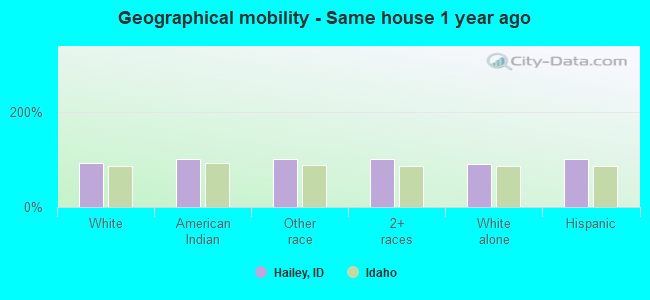
Geographical mobility - Same house 1 year ago (%)
Geographical mobility - Same house 1 year ago (%) - White
Geographical mobility - Same house 1 year ago (%) - Black or African American
Geographical mobility - Same house 1 year ago (%) - Asian
Geographical mobility - Same house 1 year ago (%) - Hispanic or Latino
Geographical mobility - Same house 1 year ago (%) - American Indian and Alaska Native
Geographical mobility - Same house 1 year ago (%) - Multirace
Geographical mobility - Same house 1 year ago (%) - Other Race
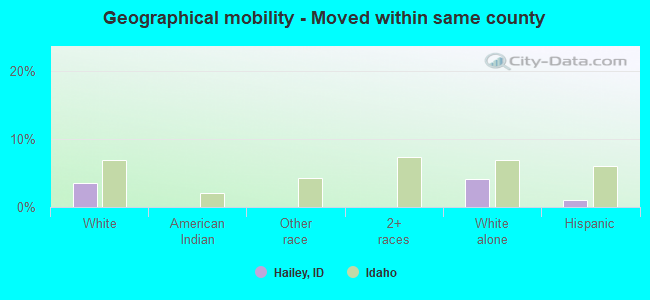
Geographical mobility - Moved within same county (%)
Geographical mobility - Moved within same county (%) - White
Geographical mobility - Moved within same county (%) - Black or African American
Geographical mobility - Moved within same county (%) - Asian
Geographical mobility - Moved within same county (%) - Hispanic or Latino
Geographical mobility - Moved within same county (%) - American Indian and Alaska Native
Geographical mobility - Moved within same county (%) - Multirace
Geographical mobility - Moved within same county (%) - Other Race
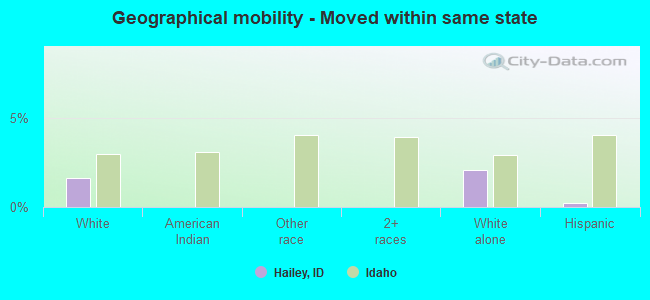
Geographical mobility - Moved from different county within same state (%)
Geographical mobility - Moved from different county within same state (%) - White
Geographical mobility - Moved from different county within same state (%) - Black or African American
Geographical mobility - Moved from different county within same state (%) - Asian
Geographical mobility - Moved from different county within same state (%) - Hispanic or Latino
Geographical mobility - Moved from different county within same state (%) - American Indian and Alaska Native
Geographical mobility - Moved from different county within same state (%) - Multirace
Geographical mobility - Moved from different county within same state (%) - Other Race
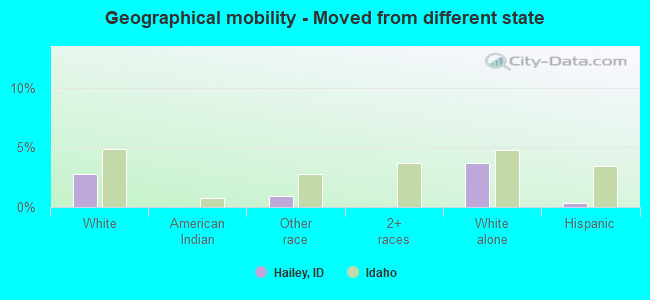
Geographical mobility - Moved from different state (%)
Geographical mobility - Moved from different state (%) - White
Geographical mobility - Moved from different state (%) - Black or African American
Geographical mobility - Moved from different state (%) - Asian
Geographical mobility - Moved from different state (%) - Hispanic or Latino
Geographical mobility - Moved from different state (%) - American Indian and Alaska Native
Geographical mobility - Moved from different state (%) - Multirace
Geographical mobility - Moved from different state (%) - Other Race
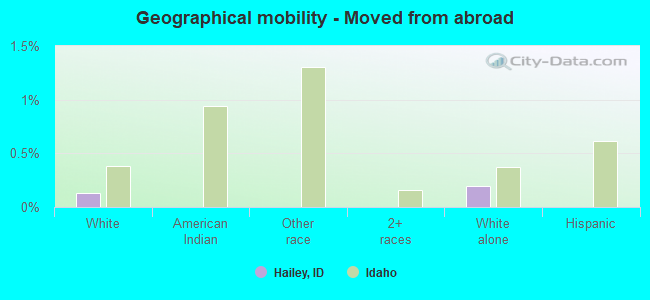
Geographical mobility - Moved from abroad (%)
Geographical mobility - Moved from abroad (%) - White
Geographical mobility - Moved from abroad (%) - Black or African American
Geographical mobility - Moved from abroad (%) - Asian
Geographical mobility - Moved from abroad (%) - Hispanic or Latino
Geographical mobility - Moved from abroad (%) - American Indian and Alaska Native
Geographical mobility - Moved from abroad (%) - Multirace
Geographical mobility - Moved from abroad (%) - Other Race
Place of birth for the foreign-born population - Ireland (%)
Place of birth for the foreign-born population - Denmark (%)
Place of birth for the foreign-born population - Norway (%)
Place of birth for the foreign-born population - Sweden (%)
Place of birth for the foreign-born population - United Kingdom (%)
Place of birth for the foreign-born population - England (%)
Place of birth for the foreign-born population - Scotland (%)
Place of birth for the foreign-born population - Other Northern Europe (%)
Place of birth for the foreign-born population - Austria (%)
Place of birth for the foreign-born population - Belgium (%)
Place of birth for the foreign-born population - France (%)
Place of birth for the foreign-born population - Germany (%)
Place of birth for the foreign-born population - Netherlands (%)
Place of birth for the foreign-born population - Switzerland (%)
Place of birth for the foreign-born population - Other Western Europe (%)
Place of birth for the foreign-born population - Greece (%)
Place of birth for the foreign-born population - Italy (%)
Place of birth for the foreign-born population - Portugal (%)
Place of birth for the foreign-born population - Spain (%)
Place of birth for the foreign-born population - Other Southern Europe (%)
Place of birth for the foreign-born population - Albania (%)
Place of birth for the foreign-born population - Belarus (%)
Place of birth for the foreign-born population - Bosnia and Herzegovina (%)
Place of birth for the foreign-born population - Bulgaria (%)
Place of birth for the foreign-born population - Croatia (%)
Place of birth for the foreign-born population - Czechoslovakia (%)
Place of birth for the foreign-born population - Hungary (%)
Place of birth for the foreign-born population - Latvia (%)
Place of birth for the foreign-born population - Lithuania (%)
Place of birth for the foreign-born population - North Macedonia (Macedonia) (%)
Place of birth for the foreign-born population - Moldova (%)
Place of birth for the foreign-born population - Poland (%)
Place of birth for the foreign-born population - Romania (%)
Place of birth for the foreign-born population - Russia (%)
Place of birth for the foreign-born population - Serbia (%)
Place of birth for the foreign-born population - Ukraine (%)
Place of birth for the foreign-born population - Other Eastern Europe (%)
Place of birth for the foreign-born population - China (%)
Place of birth for the foreign-born population - Hong Kong (%)
Place of birth for the foreign-born population - Taiwan (%)
Place of birth for the foreign-born population - Japan (%)
Place of birth for the foreign-born population - Korea (%)
Place of birth for the foreign-born population - Other Eastern Asia (%)
Place of birth for the foreign-born population - Afghanistan (%)
Place of birth for the foreign-born population - Bangladesh (%)
Place of birth for the foreign-born population - India (%)
Place of birth for the foreign-born population - Iran (%)
Place of birth for the foreign-born population - Kazakhstan (%)
Place of birth for the foreign-born population - Nepal (%)
Place of birth for the foreign-born population - Pakistan (%)
Place of birth for the foreign-born population - Sri Lanka (%)
Place of birth for the foreign-born population - Uzbekistan (%)
Place of birth for the foreign-born population - Other South Central Asia (%)
Place of birth for the foreign-born population - Burma (%)
Place of birth for the foreign-born population - Cambodia (%)
Place of birth for the foreign-born population - Indonesia (%)
Place of birth for the foreign-born population - Laos (%)
Place of birth for the foreign-born population - Malaysia (%)
Place of birth for the foreign-born population - Philippines (%)
Place of birth for the foreign-born population - Singapore (%)
Place of birth for the foreign-born population - Thailand (%)
Place of birth for the foreign-born population - Vietnam (%)
Place of birth for the foreign-born population - Other South Eastern Asia (%)
Place of birth for the foreign-born population - Armenia (%)
Place of birth for the foreign-born population - Iraq (%)
Place of birth for the foreign-born population - Israel (%)
Place of birth for the foreign-born population - Jordan (%)
Place of birth for the foreign-born population - Kuwait (%)
Place of birth for the foreign-born population - Lebanon (%)
Place of birth for the foreign-born population - Saudi Arabia (%)
Place of birth for the foreign-born population - Syria (%)
Place of birth for the foreign-born population - Turkey (%)
Place of birth for the foreign-born population - Yemen (%)
Place of birth for the foreign-born population - Other Western Asia (%)
Place of birth for the foreign-born population - Eritrea (%)
Place of birth for the foreign-born population - Ethiopia (%)
Place of birth for the foreign-born population - Kenya (%)
Place of birth for the foreign-born population - Somalia (%)
Place of birth for the foreign-born population - Uganda (%)
Place of birth for the foreign-born population - Zimbabwe (%)
Place of birth for the foreign-born population - Other Eastern Africa (%)
Place of birth for the foreign-born population - Cameroon (%)
Place of birth for the foreign-born population - Congo (%)
Place of birth for the foreign-born population - Democratic Republic of Congo (Zaire) (%)
Place of birth for the foreign-born population - Other Middle Africa (%)
Place of birth for the foreign-born population - Egypt (%)
Place of birth for the foreign-born population - Morocco (%)
Place of birth for the foreign-born population - Sudan (%)
Place of birth for the foreign-born population - Other Northern Africa (%)
Place of birth for the foreign-born population - South Africa (%)
Place of birth for the foreign-born population - Other Southern Africa (%)
Place of birth for the foreign-born population - Cabo Verde (%)
Place of birth for the foreign-born population - Ghana (%)
Place of birth for the foreign-born population - Liberia (%)
Place of birth for the foreign-born population - Nigeria (%)
Place of birth for the foreign-born population - Senegal (%)
Place of birth for the foreign-born population - Sierra Leone (%)
Place of birth for the foreign-born population - Other Western Africa (%)
Place of birth for the foreign-born population - Australia (%)
Place of birth for the foreign-born population - New Zealand (%)
Place of birth for the foreign-born population - Fiji (%)
Place of birth for the foreign-born population - Micronesia (%)
Place of birth for the foreign-born population - Bahamas (%)
Place of birth for the foreign-born population - Barbados (%)
Place of birth for the foreign-born population - Cuba (%)
Place of birth for the foreign-born population - Dominica (%)
Place of birth for the foreign-born population - Dominican Republic (%)
Place of birth for the foreign-born population - Grenada (%)
Place of birth for the foreign-born population - Haiti (%)
Place of birth for the foreign-born population - Jamaica (%)
Place of birth for the foreign-born population - St. Vincent and the Grenadines (%)
Place of birth for the foreign-born population - Trinidad and Tobago (%)
Place of birth for the foreign-born population - West Indies (%)
Place of birth for the foreign-born population - Other Caribbean (%)
Place of birth for the foreign-born population - Belize (%)
Place of birth for the foreign-born population - Costa Rica (%)
Place of birth for the foreign-born population - El Salvador (%)
Place of birth for the foreign-born population - Guatemala (%)
Place of birth for the foreign-born population - Honduras (%)
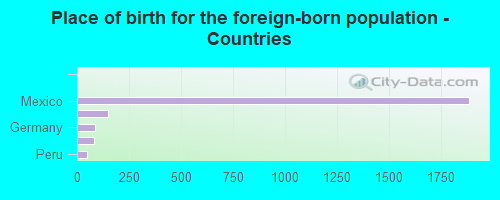
Place of birth for the foreign-born population - Mexico (%)
Place of birth for the foreign-born population - Nicaragua (%)
Place of birth for the foreign-born population - Panama (%)
Place of birth for the foreign-born population - Other Central America (%)
Place of birth for the foreign-born population - Argentina (%)
Place of birth for the foreign-born population - Bolivia (%)
Place of birth for the foreign-born population - Brazil (%)
Place of birth for the foreign-born population - Chile (%)
Place of birth for the foreign-born population - Colombia (%)
Place of birth for the foreign-born population - Ecuador (%)
Place of birth for the foreign-born population - Guyana (%)
Place of birth for the foreign-born population - Peru (%)
Place of birth for the foreign-born population - Uruguay (%)
Place of birth for the foreign-born population - Venezuela (%)
Place of birth for the foreign-born population - Other South America (%)
Place of birth for the foreign-born population - Canada (%)
Place of birth for the foreign-born population - Other Northern America (%)
Place of birth for the foreign-born population - Other (%)
Latest news about races in Hailey, ID collected exclusively by city-data.com from local newspapers, TV, and radio stations
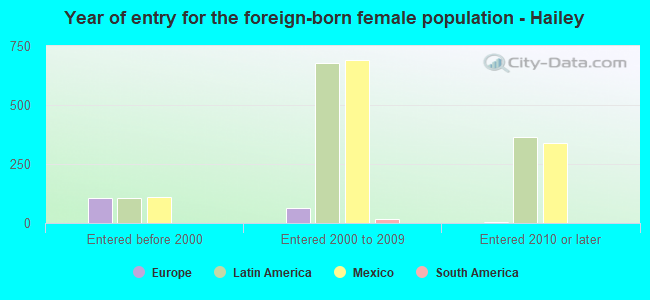
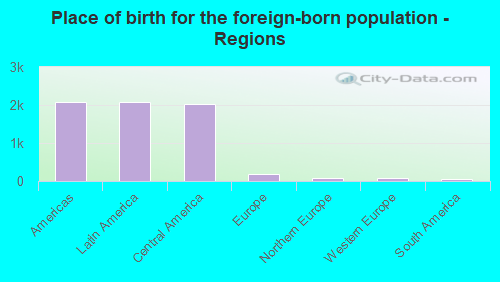
According to 2022 data, the most numerous races in Hailey, ID are White alone (5,975 residents), Hispanic (3,464 residents), and Two or more races (294 residents). 60.2% of Hailey residents speak English at home. 23.5% of Hailey, ID residents are foreign-born (22.2% born in Latin America), which is 78.7% greater than the foreign-born rate of 5.0% across the entire state of Idaho.
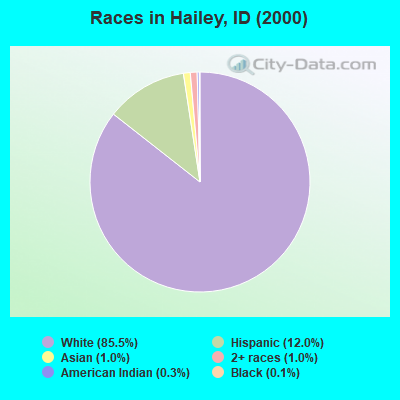
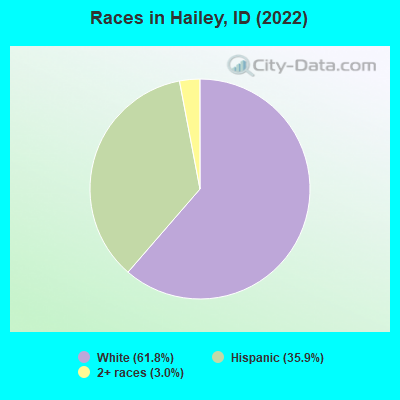
Race distribution in Hailey
2000 2022
1,139,291 88.0% White alone 101,690 7.9% Hispanic 18,261 1.4% Two or more races 15,789 1.2% American Indian alone 11,641 0.9% Asian alone 4,889 0.4% Black alone 1,192 0.09% Other race alone 1,200 0.09% Native Hawaiian and Other
1,531,219 79.0% White alone 261,921 13.5% Hispanic 81,112 4.2% Two or more races 25,174 1.3% Asian alone 15,825 0.8% American Indian alone 11,868 0.6% Black alone 8,752 0.5% Other race alone 3,162 0.2% Native Hawaiian and Other
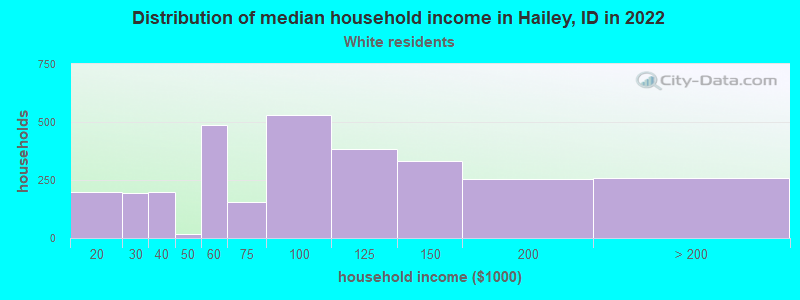
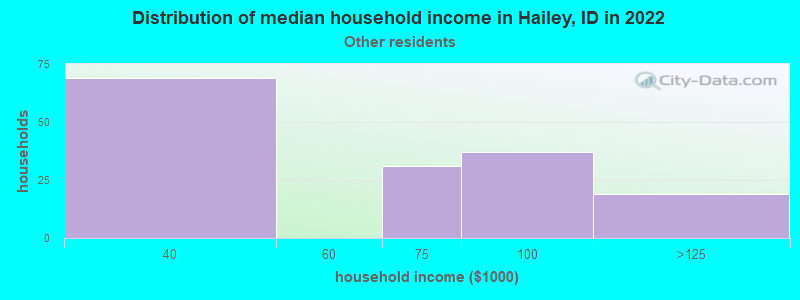
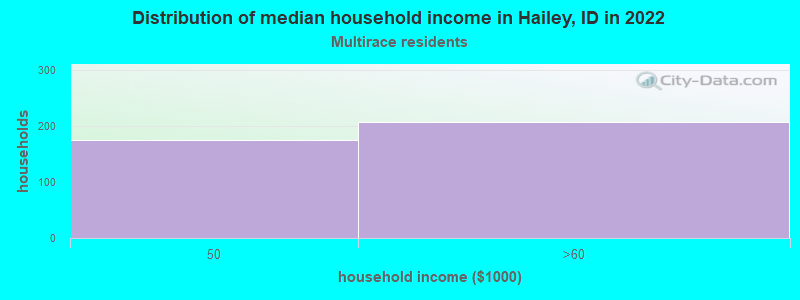
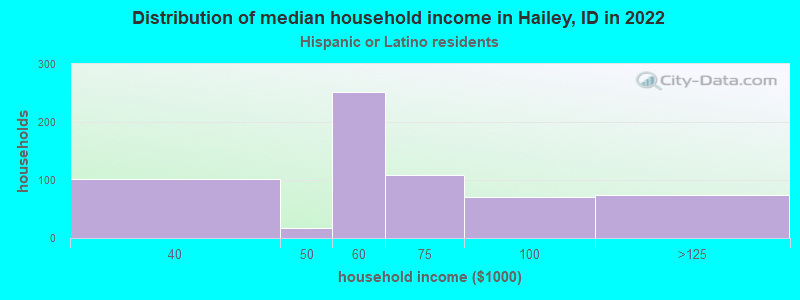
Income and house value in Hailey Median household income in 2022 $84,663 White non-Hispanic householders$67,165 Some other race householders$53,936 Two or more races householders$59,223 Hispanic or Latino race householdersMedian 2022 house value $547,707 White Non-Hispanic householders $751,219 Asian householders$307,317 Some other race householders$614,634 Two or more races householders$345,834 Hispanic or Latino householders
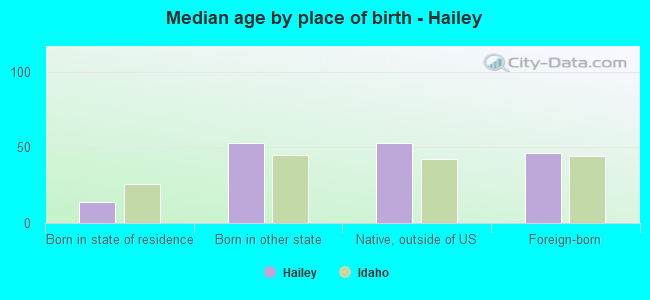
Median age by race in Hailey
44.2 Median age for White residents43.1 44.4 -774,193,547.6 Median age for Black or African American residents-680,851,063.1 -869,696,968.8 -660,714,285.1 Median age for American Indian / Alaska Native residents-708,860,758.8 -601,489,757.3 -687,208,215.9 Median age for Asian residents-720,720,720.0 -642,796,248.3 -393,939,393.5 Median age for Native Hawaiian / Pacific Islander residents-355,119,825.4 -679,245,282.3 20.4 Median age for Other race residents18.3 41.9 40.6 Median age for Two or more races residents40.9 44.7 44.6 Median age for White alone residents44.0 44.9 37.7 Median age for Hispanic or Latino residents21.0 38.4
Owner/renter occupied households by race in Hailey
House owners and renters - White residents 2,041 68.7% Owner occupied930 31.3% Renter occupiedHouse owners and renters - Other race residents 75 49.9% Owner occupied75 50.1% Renter occupiedHouse owners and renters - Two or more races residents 155 45.1% Owner occupied189 54.9% Renter occupiedHouse owners and renters - White alone residents 1,903 69.9% Owner occupied819 30.1% Renter occupiedHouse owners and renters - Hispanic or Latino residents 267 43.9% Owner occupied341 56.1% Renter occupied
Language usage in Hailey
English speakers - Total 60.2% of residents of Hailey speak English at home.
38.7% of residents speak Spanish at home 2,059 56.1% Speak English very well1,611 43.9% Speak English less than very well1.1% of residents speak other language at home 102 100.0% Speak English very well
English speakers - Born in the United States 95.5% of residents of Hailey speak English at home.
4.5% of residents speak Spanish at home 180 100.0% Speak English very well
English speakers - Native, born elsewhere 79.1% of residents of Hailey speak English at home.
24.5% of residents speak Spanish at home 27 100.0% Speak English very well
English speakers - Foreign-born 5.2% of residents of Hailey speak English at home.
85.9% of residents speak Spanish at home 602 28.9% Speak English very well1,481 71.1% Speak English less than very well4.5% of residents speak other language at home 110 100.0% Speak English very well
White (Caucasian) - Speak only English Native:
84.5% (5,198)Foreign-born:
5.0% (72)
White (Caucasian) - Speak another language Native:
13.0% (803)Foreign-born:
96.9% (1,385)
Other race - Speak another language Native:
95.4% (394)Foreign-born:
89.4% (362)
Two or more races - Speak another language Native:
41.1% (227)Foreign-born:
97.2% (317)
White alone - Speak only English Native:
95.0% (5,121)Foreign-born:
17.8% (78)
White alone - Speak another language Native:
5.0% (270)Foreign-born:
97.9% (429)
Hispanic or Latino - Speak only English Native:
10.1% (148)Foreign-born:
2.1% (42)
Hispanic or Latino - Speak another language Native:
88.6% (1,302)Foreign-born:
96.9% (1,903)
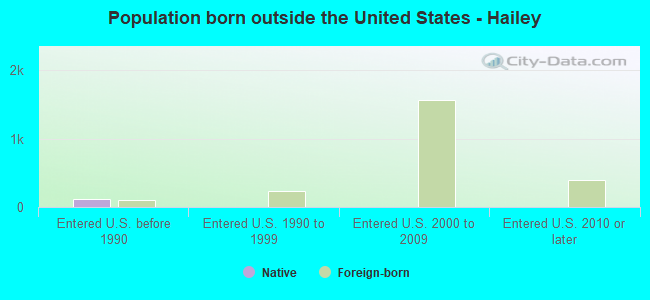
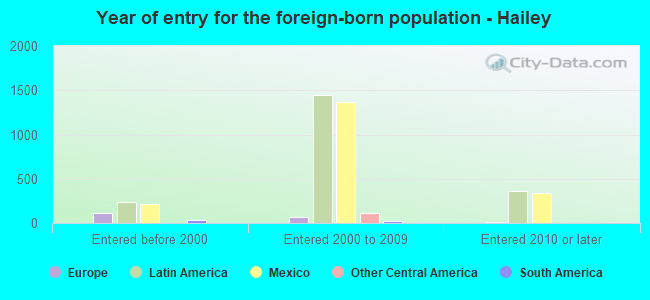
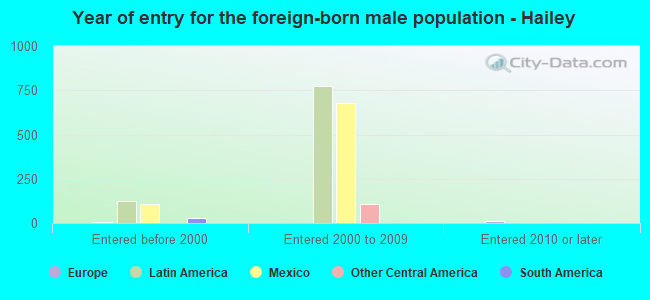
Foreign-born residents in Hailey 2,272 residents are foreign born (22.2% Latin America ).
This city:
23.5%Idaho:
5.7%
Marital status for residents in Hailey Marital status - White (Caucasian) population 15 years and over
Males 27.9% Never married61.1% Now married0.0% Separated1.0% Widowed10.0% DivorcedFemales 15.5% Never married62.5% Now married0.6% Separated4.5% Widowed16.8% DivorcedWomen who gave birth in the past 12 months Now married:
100.0% (93)Unmarried:
0.0% (0)
Women who did not give birth in the past 12 months Now married:
55.5% (813)Unmarried:
44.5% (653)
Marital status - Other race population 15 years and over
Males 63.6% Never married33.3% Now married0.0% Separated0.0% Widowed3.1% DivorcedFemales 39.9% Never married60.1% Now married0.0% Separated0.0% Widowed0.0% DivorcedWomen who did not give birth in the past 12 months Now married:
60.1% (192)Unmarried:
39.9% (127)
Marital status - Two or more races population 15 years and over
Males 26.8% Never married73.2% Now married0.0% Separated0.0% Widowed0.0% DivorcedFemales 0.0% Never married58.2% Now married0.0% Separated0.0% Widowed41.8% DivorcedWomen who did not give birth in the past 12 months Now married:
58.2% (152)Unmarried:
41.8% (109)
Marital status - White alone, not Hispanic / Latino population 15 years and over
Males 29.2% Never married58.2% Now married0.0% Separated1.3% Widowed11.3% DivorcedFemales 12.6% Never married60.1% Now married0.8% Separated5.8% Widowed20.6% DivorcedWomen who gave birth in the past 12 months Now married:
100.0% (95)Unmarried:
0.0% (0)
Women who did not give birth in the past 12 months Now married:
57.5% (632)Unmarried:
42.5% (467)
Marital status - Hispanic or Latino population 15 years and over
Males 31.8% Never married64.5% Now married0.0% Separated0.0% Widowed3.7% DivorcedFemales 25.6% Never married70.0% Now married0.0% Separated0.6% Widowed3.8% DivorcedWomen who did not give birth in the past 12 months Now married:
60.9% (512)Unmarried:
39.1% (329)
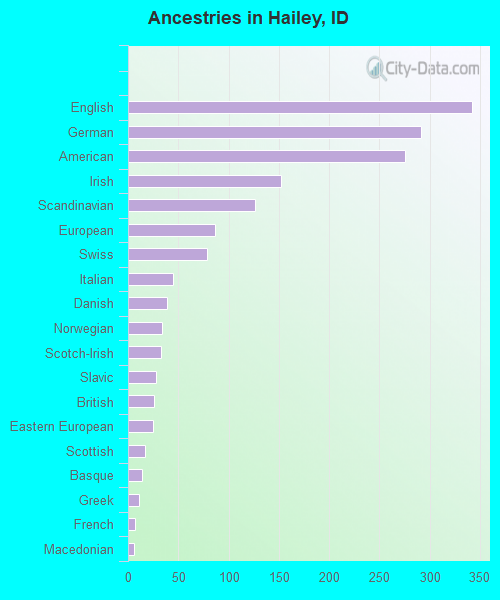
Ancestries in Hailey
342 5.8% English291 4.9% German276 4.6% American152 2.6% Irish126 2.1% Scandinavian87 1.5% European79 1.3% Swiss45 0.8% Italian39 0.7% Danish34 0.6% Norwegian33 0.6% Scotch-Irish28 0.5% Slavic26 0.4% British25 0.4% Eastern European17 0.3% Scottish14 0.2% Basque11 0.2% Greek7 0.1% French6 0.1% Macedonian2 0.03% Swedish
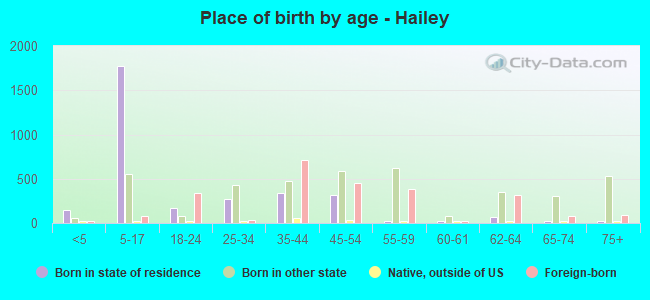
Children Nativity (place of birth) in Hailey
Children under 6 years - Living with two parents Both parents native 198 100.0% NativeChildren under 6 years - Living with one parent Native parent 82 100.0% NativeChildren 6 to 17 years - Living with two parents Both parents native 191 100.0% NativeBoth parents foreign-born 1,130 94.8% Native63 5.2% Foreign-bornOne native, one foreign-born parent 242 100.0% NativeChildren 6 to 17 years - Living with one parent Native parent 716 100.0% Native
Grandparents responsible for own grandchildren in Hailey
Grandparents (30 to 59 years) White / Caucasian 14 100.0% Responsible for grandchildrenWhite alone, not Hispanic / Latino 15 100.0% Responsible for grandchildren
Grandparents (60 years and over) White / Caucasian 16 100.0% Responsible for grandchildrenWhite alone, not Hispanic / Latino 16 100.0% Responsible for grandchildren