Races in Harrington, Maine (ME) Detailed Stats
Ancestries, Foreign-born residents, place of birth

Recent posts about races in Harrington, Maine on our local forum with over 2,400,000 registered users:
 | Why is Maine a poor state? (241 replies) |
| Moving to Harrington (19 replies) |
| Forgive Me... (38 replies) |
| I just don't get it! (131 replies) |
| Cost of Land in Aroostook County (6 replies) |
| Cell phone companies that work in Maine (23 replies) |
2.2% of Harrington, ME residents are foreign-born (0.8% born in Europe, 0.6% born in Asia, 0.6% born in North America, 0.2% born in Latin America), which is 39.3% less than the foreign-born rate of 3.0% across the entire state of Maine.
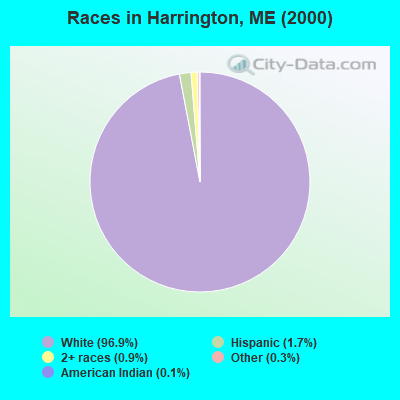
Race distribution in Harrington

- 85596.9%White alone
- 151.7%Hispanic
- 80.9%Two or more races
- 30.3%Other race alone
- 10.1%American Indian alone
2000
2022
-
- 1,230,29796.5%White alone
- 11,7310.9%Two or more races
- 9,3600.7%Hispanic
- 9,0140.7%Asian alone
- 6,4400.5%Black alone
- 6,9110.5%American Indian alone
- 8360.07%Other race alone
- 3340.03%Native Hawaiian and Other
Pacific Islander alone

-
- 1,249,23390.2%White alone
- 58,3574.2%Two or more races
- 28,7172.1%Hispanic
- 21,5831.6%Black alone
- 16,1511.2%Asian alone
- 5,8730.4%Other race alone
- 5,2050.4%American Indian alone
- 2210.02%Native Hawaiian and Other
Pacific Islander alone

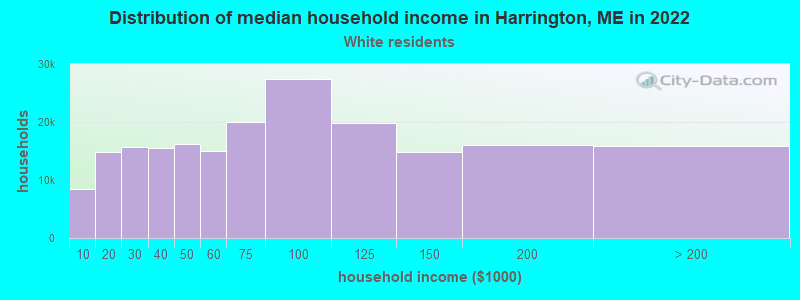
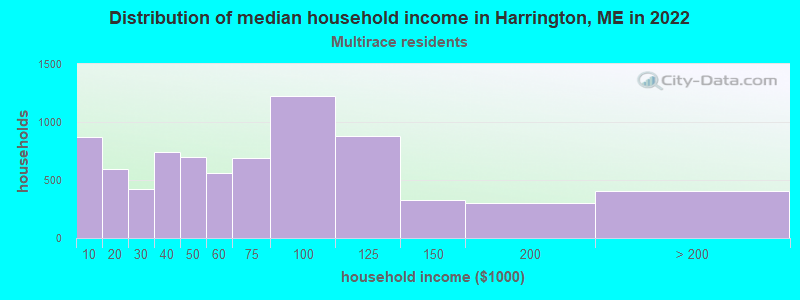
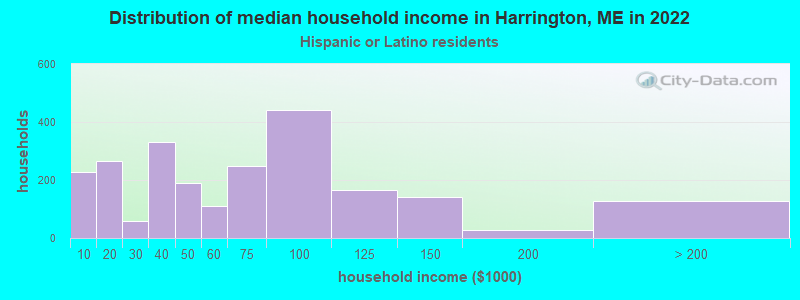
Income and house value in Harrington
- Median household income in 2022
- $50,089White non-Hispanic householders
- $34,319Two or more races householders
- $10,857Hispanic or Latino race householders
- Median 2022 house value
- $175,300White Non-Hispanic householders
- $182,098Two or more races householders
Household income for White non-Hispanic householders
Household income for Two or more races householders
Household income for Hispanic or Latino race householders
Foreign-born residents in Harrington
19 residents are foreign born (0.8% Europe, 0.6% Asia, 0.6% North America, 0.2% Latin America).
| This city: | 2.2% |
| Maine: | 2.9% |
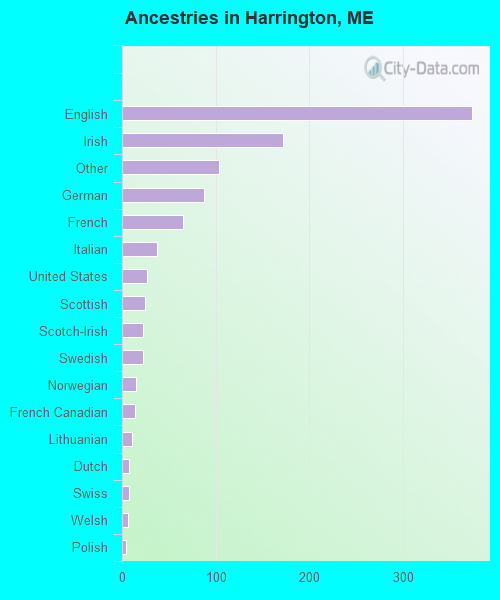
Ancestries in Harrington

- 37336.9%English
- 17217.0%Irish
- 10410.3%Other
- 878.6%German
- 656.4%French
- 373.7%Italian
- 272.7%United States
- 252.5%Scottish
- 222.2%Scotch-Irish
- 222.2%Swedish
- 151.5%Norwegian
- 141.4%French Canadian
- 111.1%Lithuanian
- 70.7%Dutch
- 70.7%Swiss
- 60.6%Welsh
- 40.4%Polish
- 30.3%Danish
- 30.3%Portuguese
- 30.3%Ukrainian
- 20.2%Arab
- 20.2%Hungarian
Zip codes: 04643.