Races in Inkster, Michigan (MI) Detailed Stats
Data:
Races - White alone (%)
Races - White alone (% change since 2000)
Races - Black alone (%)
Races - Black alone (% change since 2000)
Races - American Indian alone (%)
Races - American Indian alone (% change since 2000)
Races - Asian alone (%)
Races - Asian alone (% change since 2000)
Races - Hispanic (%)
Races - Hispanic (% change since 2000)
Races - Native Hawaiian and Other Pacific Islander alone (%)
Races - Native Hawaiian and Other Pacific Islander alone (% change since 2000)
Races - Two or more races(%)
Races - Two or more races(% change since 2000)
Races - Other race alone (%)
Races - Other race alone (% change since 2000)
Racial diversity
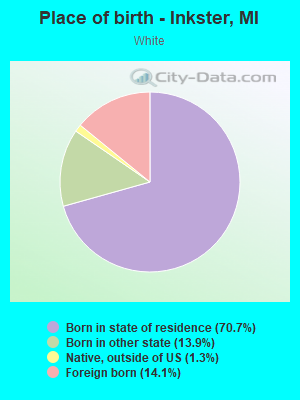
Place of birth - Born in state of residence (%)
Place of birth - Born in state of residence (%) - White
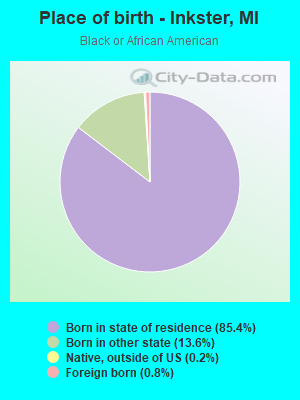
Place of birth - Born in state of residence (%) - Black or African American
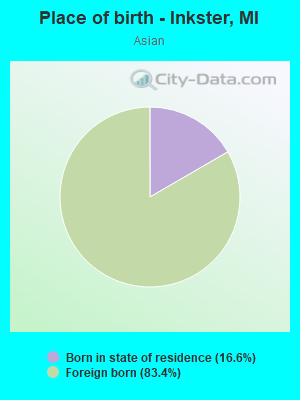
Place of birth - Born in state of residence (%) - Asian
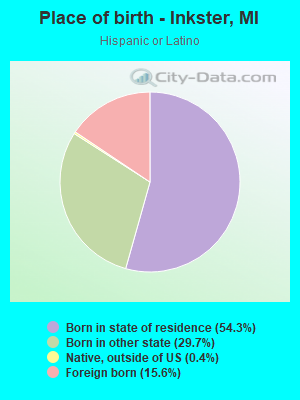
Place of birth - Born in state of residence (%) - Hispanic or Latino
Place of birth - Born in state of residence (%) - American Indian and Alaska Native
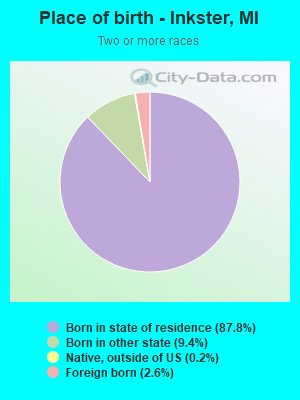
Place of birth - Born in state of residence (%) - Multirace
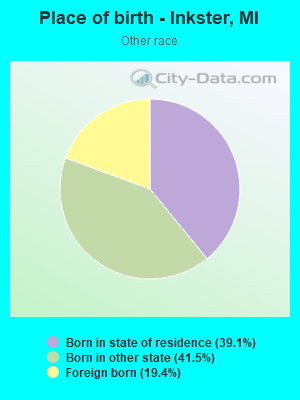
Place of birth - Born in state of residence (%) - Other Race
Place of birth - Born in other state (%)
Place of birth - Born in other state (%) - White
Place of birth - Born in other state (%) - Black or African American
Place of birth - Born in other state (%) - Asian
Place of birth - Born in other state (%) - Hispanic or Latino
Place of birth - Born in other state (%) - American Indian and Alaska Native
Place of birth - Born in other state (%) - Multirace
Place of birth - Born in other state (%) - Other Race
Place of birth - Native, outside of US (%)
Place of birth - Native, outside of US (%) - White
Place of birth - Native, outside of US (%) - Black or African American
Place of birth - Native, outside of US (%) - Asian
Place of birth - Native, outside of US (%) - Hispanic or Latino
Place of birth - Native, outside of US (%) - American Indian and Alaska Native
Place of birth - Native, outside of US (%) - Multirace
Place of birth - Native, outside of US (%) - Other Race
Place of birth - Foreign born (%)
Place of birth - Foreign born (%) - White
Place of birth - Foreign born (%) - Black or African American
Place of birth - Foreign born (%) - Asian
Place of birth - Foreign born (%) - Hispanic or Latino
Place of birth - Foreign born (%) - American Indian and Alaska Native
Place of birth - Foreign born (%) - Multirace
Place of birth - Foreign born (%) - Other Race
Residents speaking English at home (%)
Residents speaking English at home - Born in the United States (%)
Residents speaking English at home - Native, born elsewhere (%)
Residents speaking English at home - Foreign born (%)
Residents speaking Spanish at home (%)
Residents speaking Spanish at home - Born in the United States (%)
Residents speaking Spanish at home - Native, born elsewhere (%)
Residents speaking Spanish at home - Foreign born (%)
Residents speaking other language at home (%)
Residents speaking other language at home - Born in the United States (%)
Residents speaking other language at home - Native, born elsewhere (%)
Residents speaking other language at home - Foreign born (%)
Marital status - Never married (%)
Marital status - Now married (%)
Marital status - Separated (%)
Marital status - Widowed (%)
Marital status - Divorced (%)
Ancestries Reported - Arab (%)
Ancestries Reported - Czech (%)
Ancestries Reported - Danish (%)
Ancestries Reported - Dutch (%)
Ancestries Reported - English (%)
Ancestries Reported - French (%)
Ancestries Reported - French Canadian (%)
Ancestries Reported - German (%)
Ancestries Reported - Greek (%)
Ancestries Reported - Hungarian (%)
Ancestries Reported - Irish (%)
Ancestries Reported - Italian (%)
Ancestries Reported - Lithuanian (%)
Ancestries Reported - Norwegian (%)
Ancestries Reported - Polish (%)
Ancestries Reported - Portuguese (%)
Ancestries Reported - Russian (%)
Ancestries Reported - Scotch-Irish (%)
Ancestries Reported - Scottish (%)
Ancestries Reported - Slovak (%)
Ancestries Reported - Subsaharan African (%)
Ancestries Reported - Swedish (%)
Ancestries Reported - Swiss (%)
Ancestries Reported - Ukrainian (%)
Ancestries Reported - United States (%)
Ancestries Reported - Welsh (%)
Ancestries Reported - West Indian (%)
Ancestries Reported - Other (%)
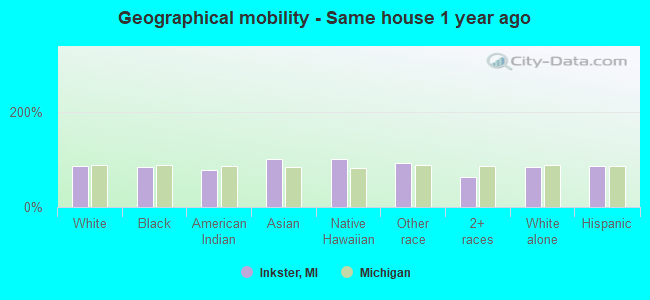
Geographical mobility - Same house 1 year ago (%)
Geographical mobility - Same house 1 year ago (%) - White
Geographical mobility - Same house 1 year ago (%) - Black or African American
Geographical mobility - Same house 1 year ago (%) - Asian
Geographical mobility - Same house 1 year ago (%) - Hispanic or Latino
Geographical mobility - Same house 1 year ago (%) - American Indian and Alaska Native
Geographical mobility - Same house 1 year ago (%) - Multirace
Geographical mobility - Same house 1 year ago (%) - Other Race
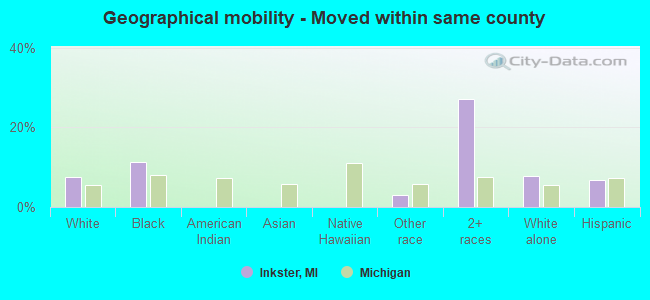
Geographical mobility - Moved within same county (%)
Geographical mobility - Moved within same county (%) - White
Geographical mobility - Moved within same county (%) - Black or African American
Geographical mobility - Moved within same county (%) - Asian
Geographical mobility - Moved within same county (%) - Hispanic or Latino
Geographical mobility - Moved within same county (%) - American Indian and Alaska Native
Geographical mobility - Moved within same county (%) - Multirace
Geographical mobility - Moved within same county (%) - Other Race
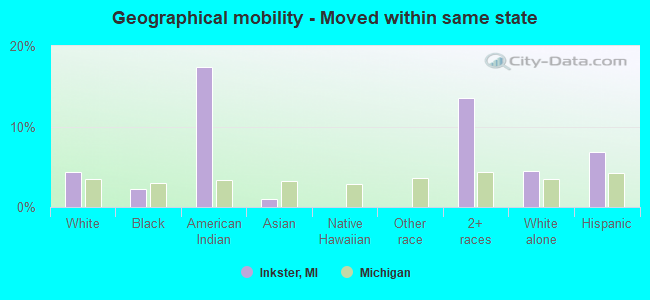
Geographical mobility - Moved from different county within same state (%)
Geographical mobility - Moved from different county within same state (%) - White
Geographical mobility - Moved from different county within same state (%) - Black or African American
Geographical mobility - Moved from different county within same state (%) - Asian
Geographical mobility - Moved from different county within same state (%) - Hispanic or Latino
Geographical mobility - Moved from different county within same state (%) - American Indian and Alaska Native
Geographical mobility - Moved from different county within same state (%) - Multirace
Geographical mobility - Moved from different county within same state (%) - Other Race
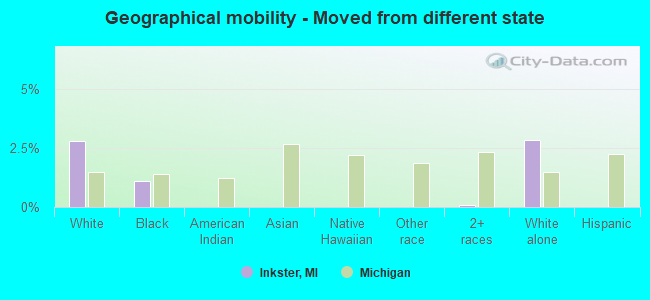
Geographical mobility - Moved from different state (%)
Geographical mobility - Moved from different state (%) - White
Geographical mobility - Moved from different state (%) - Black or African American
Geographical mobility - Moved from different state (%) - Asian
Geographical mobility - Moved from different state (%) - Hispanic or Latino
Geographical mobility - Moved from different state (%) - American Indian and Alaska Native
Geographical mobility - Moved from different state (%) - Multirace
Geographical mobility - Moved from different state (%) - Other Race
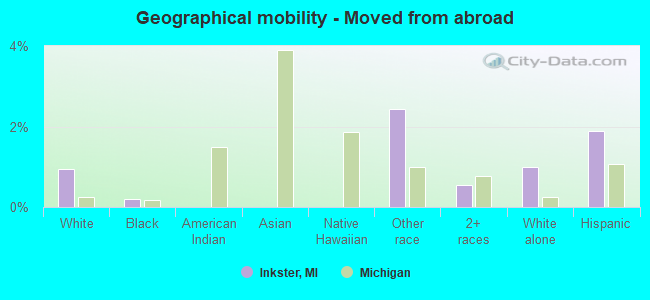
Geographical mobility - Moved from abroad (%)
Geographical mobility - Moved from abroad (%) - White
Geographical mobility - Moved from abroad (%) - Black or African American
Geographical mobility - Moved from abroad (%) - Asian
Geographical mobility - Moved from abroad (%) - Hispanic or Latino
Geographical mobility - Moved from abroad (%) - American Indian and Alaska Native
Geographical mobility - Moved from abroad (%) - Multirace
Geographical mobility - Moved from abroad (%) - Other Race
Place of birth for the foreign-born population - Ireland (%)
Place of birth for the foreign-born population - Denmark (%)
Place of birth for the foreign-born population - Norway (%)
Place of birth for the foreign-born population - Sweden (%)
Place of birth for the foreign-born population - United Kingdom (%)
Place of birth for the foreign-born population - England (%)
Place of birth for the foreign-born population - Scotland (%)
Place of birth for the foreign-born population - Other Northern Europe (%)
Place of birth for the foreign-born population - Austria (%)
Place of birth for the foreign-born population - Belgium (%)
Place of birth for the foreign-born population - France (%)
Place of birth for the foreign-born population - Germany (%)
Place of birth for the foreign-born population - Netherlands (%)
Place of birth for the foreign-born population - Switzerland (%)
Place of birth for the foreign-born population - Other Western Europe (%)
Place of birth for the foreign-born population - Greece (%)
Place of birth for the foreign-born population - Italy (%)
Place of birth for the foreign-born population - Portugal (%)
Place of birth for the foreign-born population - Spain (%)
Place of birth for the foreign-born population - Other Southern Europe (%)
Place of birth for the foreign-born population - Albania (%)
Place of birth for the foreign-born population - Belarus (%)
Place of birth for the foreign-born population - Bosnia and Herzegovina (%)
Place of birth for the foreign-born population - Bulgaria (%)
Place of birth for the foreign-born population - Croatia (%)
Place of birth for the foreign-born population - Czechoslovakia (%)
Place of birth for the foreign-born population - Hungary (%)
Place of birth for the foreign-born population - Latvia (%)
Place of birth for the foreign-born population - Lithuania (%)
Place of birth for the foreign-born population - North Macedonia (Macedonia) (%)
Place of birth for the foreign-born population - Moldova (%)
Place of birth for the foreign-born population - Poland (%)
Place of birth for the foreign-born population - Romania (%)
Place of birth for the foreign-born population - Russia (%)
Place of birth for the foreign-born population - Serbia (%)
Place of birth for the foreign-born population - Ukraine (%)
Place of birth for the foreign-born population - Other Eastern Europe (%)
Place of birth for the foreign-born population - China (%)
Place of birth for the foreign-born population - Hong Kong (%)
Place of birth for the foreign-born population - Taiwan (%)
Place of birth for the foreign-born population - Japan (%)
Place of birth for the foreign-born population - Korea (%)
Place of birth for the foreign-born population - Other Eastern Asia (%)
Place of birth for the foreign-born population - Afghanistan (%)
Place of birth for the foreign-born population - Bangladesh (%)
Place of birth for the foreign-born population - India (%)
Place of birth for the foreign-born population - Iran (%)
Place of birth for the foreign-born population - Kazakhstan (%)
Place of birth for the foreign-born population - Nepal (%)
Place of birth for the foreign-born population - Pakistan (%)
Place of birth for the foreign-born population - Sri Lanka (%)
Place of birth for the foreign-born population - Uzbekistan (%)
Place of birth for the foreign-born population - Other South Central Asia (%)
Place of birth for the foreign-born population - Burma (%)
Place of birth for the foreign-born population - Cambodia (%)
Place of birth for the foreign-born population - Indonesia (%)
Place of birth for the foreign-born population - Laos (%)
Place of birth for the foreign-born population - Malaysia (%)
Place of birth for the foreign-born population - Philippines (%)
Place of birth for the foreign-born population - Singapore (%)
Place of birth for the foreign-born population - Thailand (%)
Place of birth for the foreign-born population - Vietnam (%)
Place of birth for the foreign-born population - Other South Eastern Asia (%)
Place of birth for the foreign-born population - Armenia (%)
Place of birth for the foreign-born population - Iraq (%)
Place of birth for the foreign-born population - Israel (%)
Place of birth for the foreign-born population - Jordan (%)
Place of birth for the foreign-born population - Kuwait (%)
Place of birth for the foreign-born population - Lebanon (%)
Place of birth for the foreign-born population - Saudi Arabia (%)
Place of birth for the foreign-born population - Syria (%)
Place of birth for the foreign-born population - Turkey (%)
Place of birth for the foreign-born population - Yemen (%)
Place of birth for the foreign-born population - Other Western Asia (%)
Place of birth for the foreign-born population - Eritrea (%)
Place of birth for the foreign-born population - Ethiopia (%)
Place of birth for the foreign-born population - Kenya (%)
Place of birth for the foreign-born population - Somalia (%)
Place of birth for the foreign-born population - Uganda (%)
Place of birth for the foreign-born population - Zimbabwe (%)
Place of birth for the foreign-born population - Other Eastern Africa (%)
Place of birth for the foreign-born population - Cameroon (%)
Place of birth for the foreign-born population - Congo (%)
Place of birth for the foreign-born population - Democratic Republic of Congo (Zaire) (%)
Place of birth for the foreign-born population - Other Middle Africa (%)
Place of birth for the foreign-born population - Egypt (%)
Place of birth for the foreign-born population - Morocco (%)
Place of birth for the foreign-born population - Sudan (%)
Place of birth for the foreign-born population - Other Northern Africa (%)
Place of birth for the foreign-born population - South Africa (%)
Place of birth for the foreign-born population - Other Southern Africa (%)
Place of birth for the foreign-born population - Cabo Verde (%)
Place of birth for the foreign-born population - Ghana (%)
Place of birth for the foreign-born population - Liberia (%)
Place of birth for the foreign-born population - Nigeria (%)
Place of birth for the foreign-born population - Senegal (%)
Place of birth for the foreign-born population - Sierra Leone (%)
Place of birth for the foreign-born population - Other Western Africa (%)
Place of birth for the foreign-born population - Australia (%)
Place of birth for the foreign-born population - New Zealand (%)
Place of birth for the foreign-born population - Fiji (%)
Place of birth for the foreign-born population - Micronesia (%)
Place of birth for the foreign-born population - Bahamas (%)
Place of birth for the foreign-born population - Barbados (%)
Place of birth for the foreign-born population - Cuba (%)
Place of birth for the foreign-born population - Dominica (%)
Place of birth for the foreign-born population - Dominican Republic (%)
Place of birth for the foreign-born population - Grenada (%)
Place of birth for the foreign-born population - Haiti (%)
Place of birth for the foreign-born population - Jamaica (%)
Place of birth for the foreign-born population - St. Vincent and the Grenadines (%)
Place of birth for the foreign-born population - Trinidad and Tobago (%)
Place of birth for the foreign-born population - West Indies (%)
Place of birth for the foreign-born population - Other Caribbean (%)
Place of birth for the foreign-born population - Belize (%)
Place of birth for the foreign-born population - Costa Rica (%)
Place of birth for the foreign-born population - El Salvador (%)
Place of birth for the foreign-born population - Guatemala (%)
Place of birth for the foreign-born population - Honduras (%)
Place of birth for the foreign-born population - Mexico (%)
Place of birth for the foreign-born population - Nicaragua (%)
Place of birth for the foreign-born population - Panama (%)
Place of birth for the foreign-born population - Other Central America (%)
Place of birth for the foreign-born population - Argentina (%)
Place of birth for the foreign-born population - Bolivia (%)
Place of birth for the foreign-born population - Brazil (%)
Place of birth for the foreign-born population - Chile (%)
Place of birth for the foreign-born population - Colombia (%)
Place of birth for the foreign-born population - Ecuador (%)
Place of birth for the foreign-born population - Guyana (%)
Place of birth for the foreign-born population - Peru (%)
Place of birth for the foreign-born population - Uruguay (%)
Place of birth for the foreign-born population - Venezuela (%)
Place of birth for the foreign-born population - Other South America (%)
Place of birth for the foreign-born population - Canada (%)
Place of birth for the foreign-born population - Other Northern America (%)
Place of birth for the foreign-born population - Other (%)
Latest news about races in Inkster, MI collected exclusively by city-data.com from local newspapers, TV, and radio stations
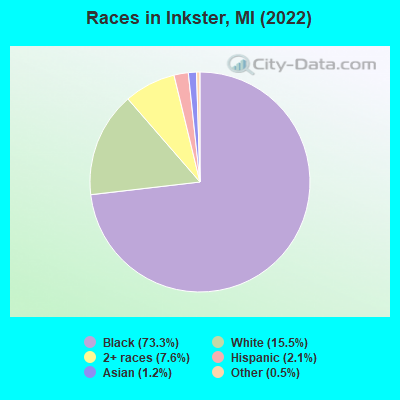
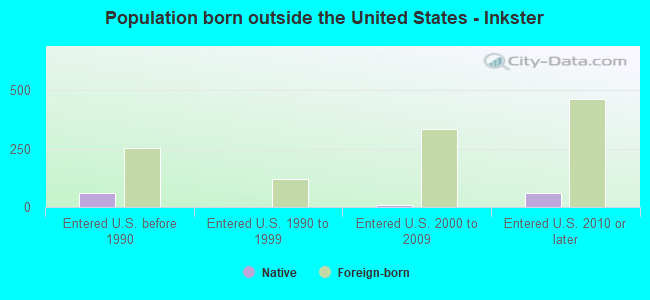
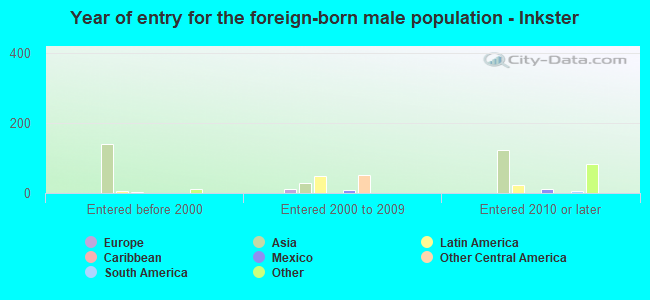
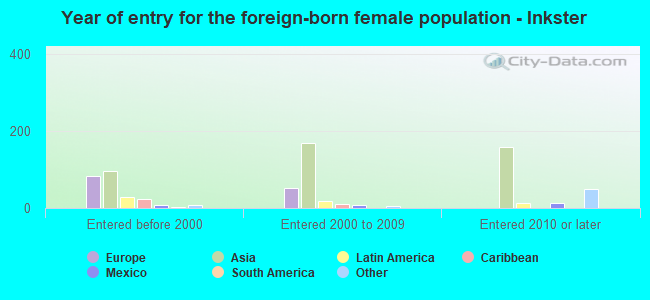
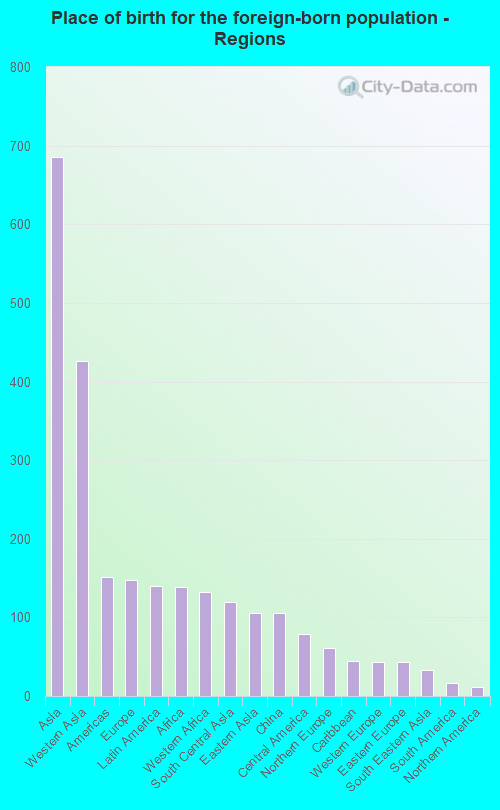
According to 2022 data, the most numerous races in Inkster, MI are White alone (3,948 residents), Black alone (18,688 residents), and Hispanic (524 residents). 92.5% of Inkster residents speak English at home. 4.4% of Inkster, MI residents are foreign-born (2.6% born in Asia, 0.6% born in Europe, 0.5% born in Latin America, 0.5% born in Africa), which is 36.1% less than the foreign-born rate of 6.0% across the entire state of Michigan.
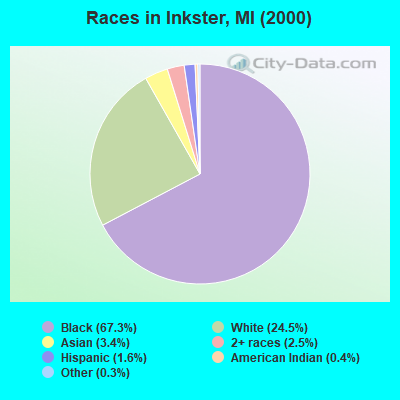
Race distribution in Inkster
2000 2022
7,806,691 78.6% White alone 1,402,047 14.1% Black alone 323,877 3.3% Hispanic 175,311 1.8% Asian alone 163,487 1.6% Two or more races 53,421 0.5% American Indian alone 11,465 0.1% Other race alone 2,145 0.02% Native Hawaiian and Other
7,289,051 72.6% White alone 1,310,464 13.1% Black alone 572,405 5.7% Hispanic 450,031 4.5% Two or more races 335,732 3.3% Asian alone 45,217 0.5% Other race alone 29,011 0.3% American Indian alone 2,207 0.02% Native Hawaiian and Other
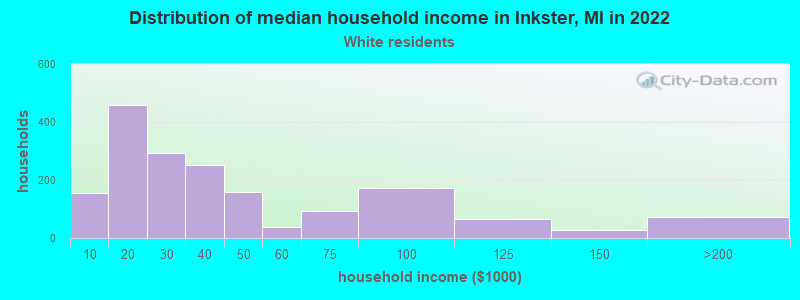
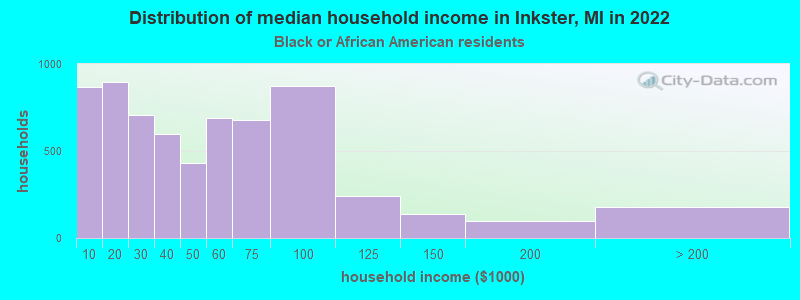
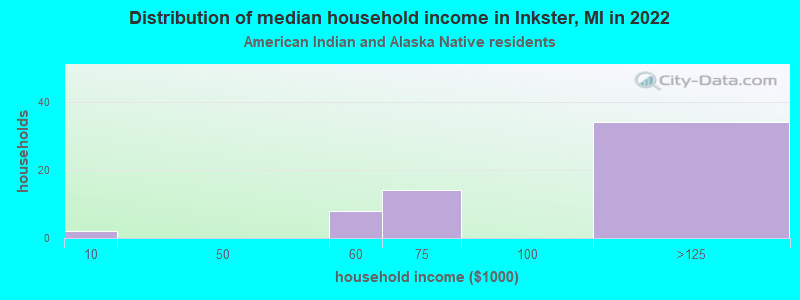
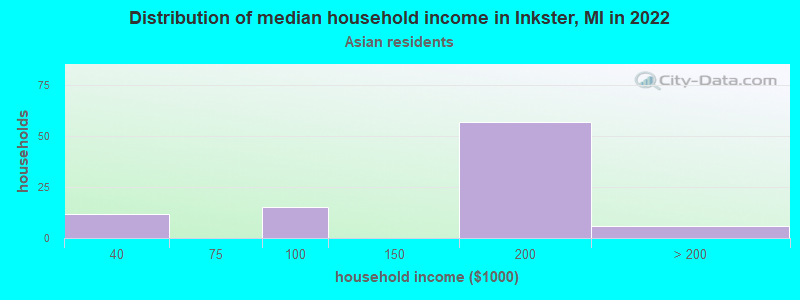
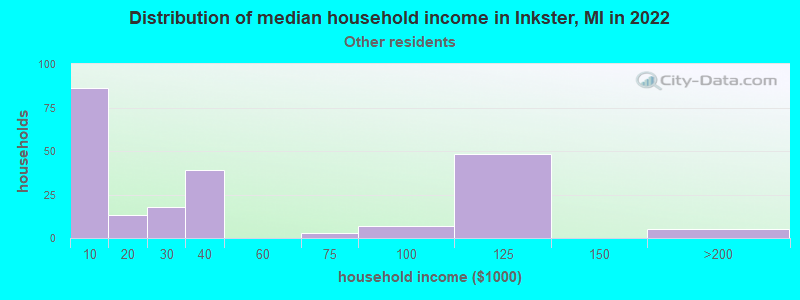
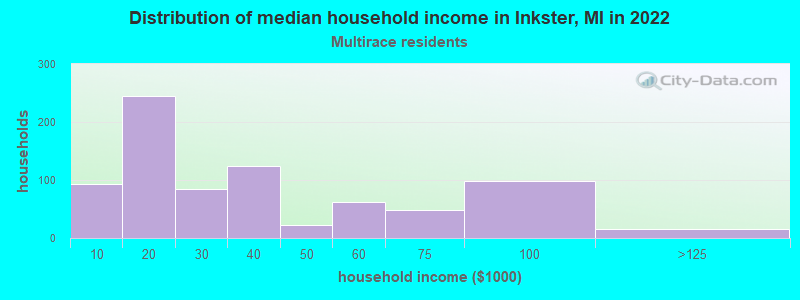
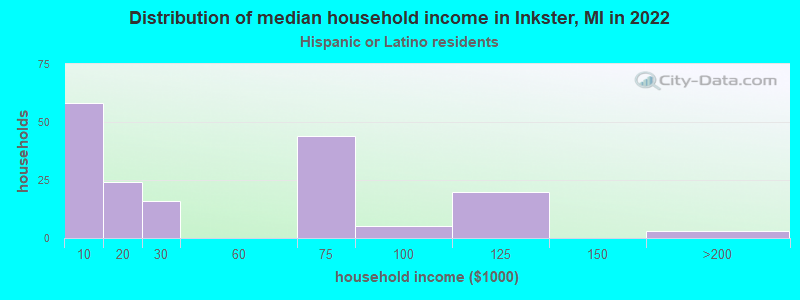
Income and house value in Inkster Median household income in 2022 $30,443 White non-Hispanic householders$43,936 Black householders$162,045 Asian householders$21,780 Two or more races householdersMedian 2022 house value $78,622 White Non-Hispanic householders$74,024 Black or African American householders$80,080 American Indian or Alaska Native householders $98,362 Asian householders$94,100 Some other race householders$77,613 Two or more races householders$88,380 Hispanic or Latino householders
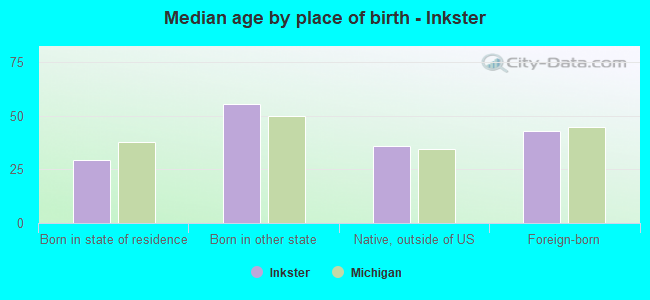
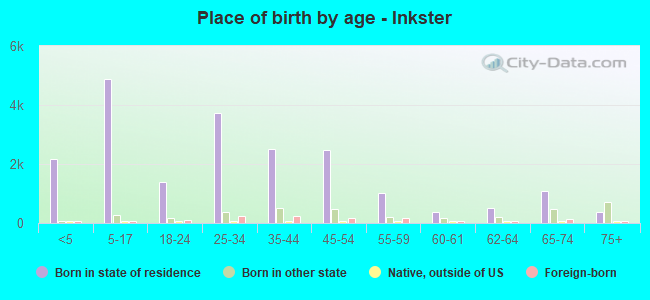
Median age by race in Inkster
42.9 Median age for White residents41.7 43.0 31.0 Median age for Black or African American residents28.9 33.4 69.8 Median age for American Indian / Alaska Native residents-795,074,757.3 64.7 41.7 Median age for Asian residents54.1 42.7 -934,108,526.2 Median age for Native Hawaiian / Pacific Islander residents-674,772,035.8 -699,588,476.7 33.2 Median age for Other race residents24.4 32.8 28.6 Median age for Two or more races residents18.6 29.5 42.7 Median age for White alone residents42.8 42.8 22.3 Median age for Hispanic or Latino residents19.0 32.6
Owner/renter occupied households by race in Inkster
House owners and renters - White residents 704 42.0% Owner occupied975 58.0% Renter occupiedHouse owners and renters - Black or African American residents 2,978 46.1% Owner occupied3,482 53.9% Renter occupiedHouse owners and renters - American Indian / Alaska Native residents 5 71.4% Owner occupied2 28.6% Renter occupiedHouse owners and renters - Asian residents 95 82.1% Owner occupied21 17.9% Renter occupiedHouse owners and renters - Other race residents 104 55.4% Owner occupied84 44.6% Renter occupiedHouse owners and renters - Two or more races residents 381 48.0% Owner occupied413 52.0% Renter occupiedHouse owners and renters - White alone residents 711 42.1% Owner occupied977 57.9% Renter occupiedHouse owners and renters - Hispanic or Latino residents 102 63.2% Owner occupied60 36.8% Renter occupied
Language usage in Inkster
English speakers - Total 92.5% of residents of Inkster speak English at home.
0.9% of residents speak Spanish at home 144 69.9% Speak English very well62 30.1% Speak English less than very well6.3% of residents speak other language at home 934 63.2% Speak English very well543 36.8% Speak English less than very well
English speakers - Born in the United States 95.6% of residents of Inkster speak English at home.
1.1% of residents speak Spanish at home 39 100.0% Speak English very well2.7% of residents speak other language at home 53 56.4% Speak English very well41 43.6% Speak English less than very well
English speakers - Native, born elsewhere 96.7% of residents of Inkster speak English at home.
15.2% of residents speak other language at home 8 57.1% Speak English very well6 42.9% Speak English less than very well
English speakers - Foreign-born 14.2% of residents of Inkster speak English at home.
5.8% of residents speak Spanish at home 37 55.2% Speak English very well30 44.8% Speak English less than very well77.8% of residents speak other language at home 491 54.9% Speak English very well404 45.1% Speak English less than very well
White (Caucasian) - Speak only English Native:
94.0% (3,030)Foreign-born:
15.0% (85)
White (Caucasian) - Speak another language Native:
6.3% (202)Foreign-born:
85.0% (482)
Black or African American - Speak only English Native:
98.3% (16,589)Foreign-born:
33.5% (50)
Black or African American - Speak another language Native:
1.5% (245)Foreign-born:
65.9% (97)
Asian - Speak only English Native:
53.3% (17)Foreign-born:
3.1% (8)
Asian - Speak another language Native:
45.5% (15)Foreign-born:
95.3% (250)
Other race - Speak only English Native:
72.7% (238)Foreign-born:
11.9% (10)
Other race - Speak another language Native:
19.2% (63)Foreign-born:
84.4% (70)
Two or more races - Speak another language Native:
5.5% (104)Foreign-born:
100.0% (56)
White alone - Speak only English Native:
93.6% (2,956)Foreign-born:
14.6% (87)
White alone - Speak another language Native:
6.4% (203)Foreign-born:
85.4% (508)
Hispanic or Latino - Speak only English Native:
74.6% (323)Foreign-born:
11.5% (10)
Hispanic or Latino - Speak another language Native:
24.6% (107)Foreign-born:
87.0% (73)
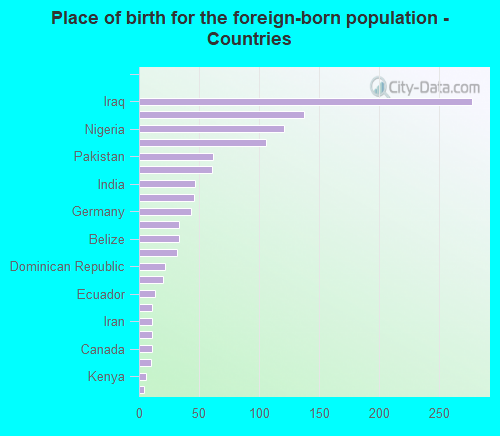
Foreign-born residents in Inkster 1,123 residents are foreign born (2.6% Asia , 0.6% Europe , 0.5% Latin America , 0.5% Africa ).
This city:
4.4%Michigan:
6.9%
Marital status for residents in Inkster Marital status - White (Caucasian) population 15 years and over
Males 47.0% Never married23.2% Now married6.4% Separated2.8% Widowed20.5% DivorcedFemales 32.6% Never married28.5% Now married8.4% Separated8.4% Widowed22.0% DivorcedWomen who gave birth in the past 12 months Now married:
100.0% (14)Unmarried:
0.0% (0)
Women who did not give birth in the past 12 months Now married:
28.6% (257)Unmarried:
71.4% (644)
Marital status - Black or African American population 15 years and over
Males 57.0% Never married28.7% Now married2.2% Separated3.9% Widowed8.2% DivorcedFemales 52.6% Never married22.7% Now married3.4% Separated6.7% Widowed14.5% DivorcedWomen who gave birth in the past 12 months Now married:
18.4% (58)Unmarried:
81.6% (257)
Women who did not give birth in the past 12 months Now married:
25.1% (1,053)Unmarried:
74.9% (3,143)
Marital status - Asian population 15 years and over
Males 64.8% Never married35.2% Now married0.0% Separated0.0% Widowed0.0% DivorcedFemales 61.0% Never married36.3% Now married2.7% Separated0.0% Widowed0.0% DivorcedWomen who gave birth in the past 12 months Now married:
100.0% (13)Unmarried:
0.0% (0)
Women who did not give birth in the past 12 months Now married:
21.2% (23)Unmarried:
78.8% (87)
Marital status - Other race population 15 years and over
Males 81.2% Never married13.8% Now married5.0% Separated0.0% Widowed0.0% DivorcedFemales 64.8% Never married26.9% Now married4.1% Separated0.0% Widowed4.1% DivorcedWomen who did not give birth in the past 12 months Now married:
22.3% (29)Unmarried:
77.7% (101)
Marital status - Two or more races population 15 years and over
Males 50.2% Never married37.8% Now married0.0% Separated0.0% Widowed12.0% DivorcedFemales 62.5% Never married9.5% Now married5.1% Separated4.7% Widowed18.2% DivorcedWomen who gave birth in the past 12 months Now married:
0.0% (0)Unmarried:
100.0% (67)
Women who did not give birth in the past 12 months Now married:
11.2% (82)Unmarried:
88.8% (656)
Marital status - White alone, not Hispanic / Latino population 15 years and over
Males 45.5% Never married23.9% Now married6.6% Separated2.9% Widowed21.2% DivorcedFemales 32.8% Never married28.2% Now married8.5% Separated8.5% Widowed22.0% DivorcedWomen who gave birth in the past 12 months Now married:
100.0% (14)Unmarried:
0.0% (0)
Women who did not give birth in the past 12 months Now married:
28.4% (257)Unmarried:
71.6% (649)
Marital status - Hispanic or Latino population 15 years and over
Males 82.9% Never married12.6% Now married4.5% Separated0.0% Widowed0.0% DivorcedFemales 69.0% Never married16.6% Now married8.6% Separated0.0% Widowed5.9% DivorcedWomen who gave birth in the past 12 months Now married:
0.0% (0)Unmarried:
100.0% (9)
Women who did not give birth in the past 12 months Now married:
20.4% (33)Unmarried:
79.6% (129)
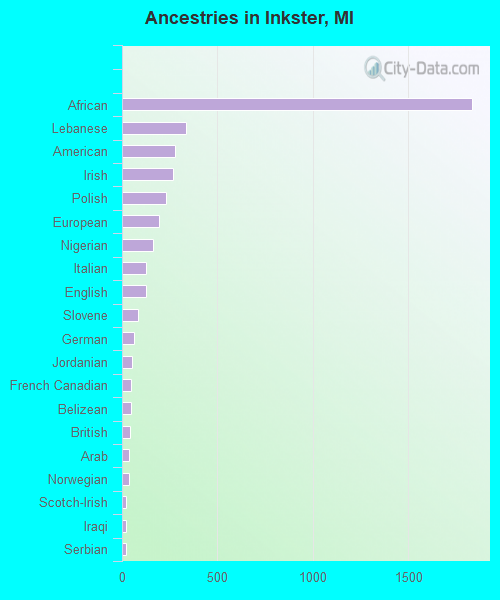
Ancestries in Inkster
1,830 10.8% African335 2.0% Lebanese277 1.6% American268 1.6% Irish228 1.3% Polish194 1.1% European163 1.0% Nigerian127 0.7% Italian124 0.7% English86 0.5% Slovene65 0.4% German52 0.3% Jordanian47 0.3% French Canadian47 0.3% Belizean43 0.3% British39 0.2% Arab36 0.2% Norwegian23 0.1% Scotch-Irish22 0.1% Iraqi19 0.1% Serbian16 0.09% Iranian16 0.09% Russian14 0.08% Macedonian12 0.07% Kenyan12 0.07% Swedish11 0.06% Slovak10 0.06% Liberian10 0.06% Greek9 0.05% French8 0.05% Hungarian7 0.04% Jamaican6 0.04% Finnish5 0.03% Scottish4 0.02% Canadian2 0.01% Armenian2 0.01% Maltese
Geographical mobility in Inkster Same house 1 year ago 3,339 84.7% White (Caucasian)15,690 84.2% Black or African American16 76.9% American Indian / Alaska Native309 100.0% Asian2 100.0% Native Hawaiian / Pacific Islander372 92.1% Other race1,358 63.4% Two or more races3,274 84.2% White alone, not Hispanic / Latino446 84.7% Hispanic or LatinoMoved within same county 294 7.5% White / Caucasian2,121 11.4% Black or African American12 3.0% Other race580 27.1% Two or more races307 7.9% White alone, not Hispanic / Latino36 6.9% Hispanic or LatinoMoved within same state 171 4.3% White / Caucasian410 2.2% Black or African American4 17.3% American Indian / Alaska Native3 1.0% Asian289 13.5% Two or more races174 4.5% White alone, not Hispanic / Latino36 6.9% Hispanic or LatinoMoved from different state 110 2.8% White / Caucasian208 1.1% Black or African American2 0.1% Two or more races109 2.8% White alone, not Hispanic / LatinoMoved from abroad 37 0.9% White39 0.2% Black or African American10 2.4% Other race12 0.5% Two or more races38 1.0% White alone, not Hispanic / Latino10 1.9% Hispanic or Latino
Children Nativity (place of birth) in Inkster
Children under 6 years - Living with two parents Both parents native 355 100.0% NativeBoth parents foreign-born 19 100.0% NativeOne native, one foreign-born parent 53 100.0% NativeChildren under 6 years - Living with one parent Native parent 1,769 100.0% NativeForeign-born parent 1 95.9% NativeChildren 6 to 17 years - Living with two parents Both parents native 1,084 99.9% Native1 0.1% Foreign-bornBoth parents foreign-born 48 69.5% Native21 30.5% Foreign-bornOne native, one foreign-born parent 68 100.0% NativeChildren 6 to 17 years - Living with one parent Native parent 3,253 100.0% NativeForeign-born parent 47 51.4% Native44 48.6% Foreign-born
Grandparents responsible for own grandchildren in Inkster
Grandparents (30 to 59 years) White / Caucasian 3 6.8% Responsible for grandchildren36 93.2% Not responsible for grandchildrenBlack or African American 111 52.1% Responsible for grandchildren102 47.9% Not responsible for grandchildrenAsian 9 100.0% Not responsible for grandchildrenOther race 34 100.0% Responsible for grandchildrenTwo or more races 10 36.2% Responsible for grandchildren17 63.8% Not responsible for grandchildrenWhite alone, not Hispanic / Latino 3 6.4% Responsible for grandchildren38 93.6% Not responsible for grandchildrenGrandparents (60 years and over) White / Caucasian 11 100.0% Responsible for grandchildrenBlack or African American 51 38.5% Responsible for grandchildren81 61.5% Not responsible for grandchildrenTwo or more races 4 15.3% Responsible for grandchildren25 84.7% Not responsible for grandchildrenWhite alone, not Hispanic / Latino 10 100.0% Responsible for grandchildren