Races in Islip, New York (NY) Detailed Stats
Data:
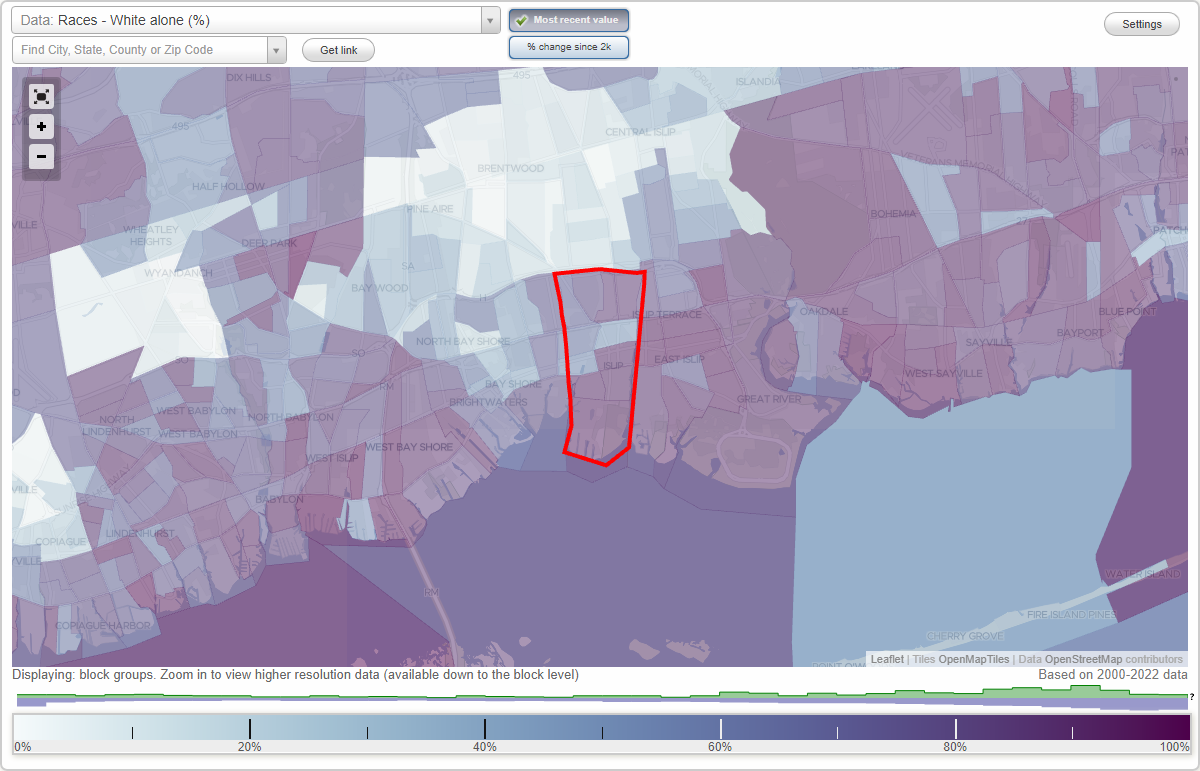
Races - White alone (%)
Races - White alone (% change since 2000)
Races - Black alone (%)
Races - Black alone (% change since 2000)
Races - American Indian alone (%)
Races - American Indian alone (% change since 2000)
Races - Asian alone (%)
Races - Asian alone (% change since 2000)
Races - Hispanic (%)
Races - Hispanic (% change since 2000)
Races - Native Hawaiian and Other Pacific Islander alone (%)
Races - Native Hawaiian and Other Pacific Islander alone (% change since 2000)
Races - Two or more races(%)
Races - Two or more races(% change since 2000)
Races - Other race alone (%)
Races - Other race alone (% change since 2000)
Racial diversity
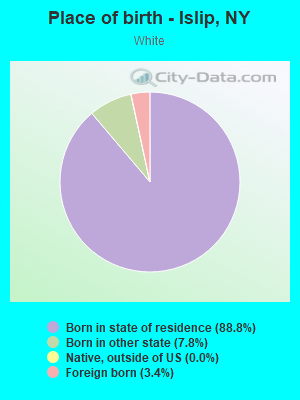
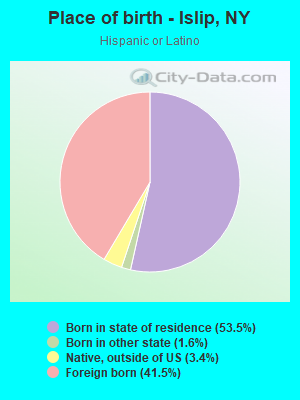
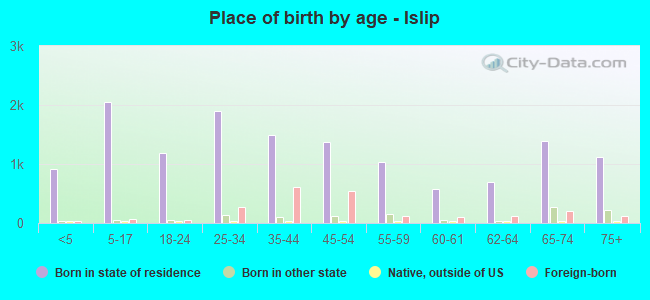
Place of birth - Born in state of residence (%)
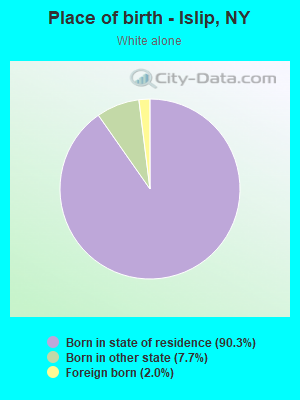
Place of birth - Born in state of residence (%) - White
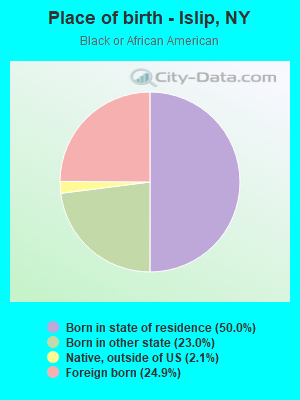
Place of birth - Born in state of residence (%) - Black or African American
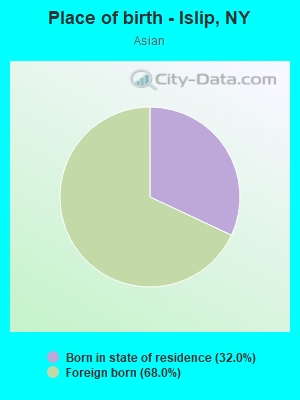
Place of birth - Born in state of residence (%) - Asian
Place of birth - Born in state of residence (%) - Hispanic or Latino
Place of birth - Born in state of residence (%) - American Indian and Alaska Native
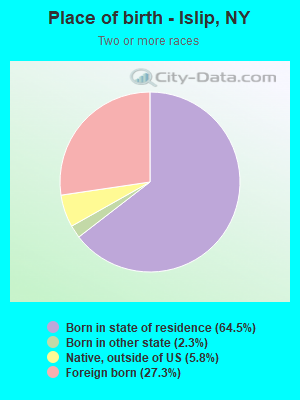
Place of birth - Born in state of residence (%) - Multirace
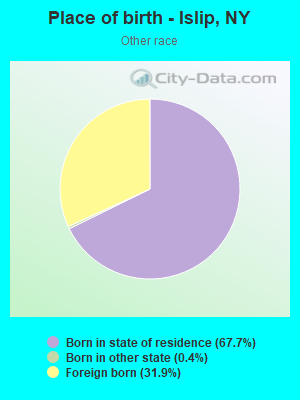
Place of birth - Born in state of residence (%) - Other Race
Place of birth - Born in other state (%)
Place of birth - Born in other state (%) - White
Place of birth - Born in other state (%) - Black or African American
Place of birth - Born in other state (%) - Asian
Place of birth - Born in other state (%) - Hispanic or Latino
Place of birth - Born in other state (%) - American Indian and Alaska Native
Place of birth - Born in other state (%) - Multirace
Place of birth - Born in other state (%) - Other Race
Place of birth - Native, outside of US (%)
Place of birth - Native, outside of US (%) - White
Place of birth - Native, outside of US (%) - Black or African American
Place of birth - Native, outside of US (%) - Asian
Place of birth - Native, outside of US (%) - Hispanic or Latino
Place of birth - Native, outside of US (%) - American Indian and Alaska Native
Place of birth - Native, outside of US (%) - Multirace
Place of birth - Native, outside of US (%) - Other Race
Place of birth - Foreign born (%)
Place of birth - Foreign born (%) - White
Place of birth - Foreign born (%) - Black or African American
Place of birth - Foreign born (%) - Asian
Place of birth - Foreign born (%) - Hispanic or Latino
Place of birth - Foreign born (%) - American Indian and Alaska Native
Place of birth - Foreign born (%) - Multirace
Place of birth - Foreign born (%) - Other Race
Residents speaking English at home (%)
Residents speaking English at home - Born in the United States (%)
Residents speaking English at home - Native, born elsewhere (%)
Residents speaking English at home - Foreign born (%)
Residents speaking Spanish at home (%)
Residents speaking Spanish at home - Born in the United States (%)
Residents speaking Spanish at home - Native, born elsewhere (%)
Residents speaking Spanish at home - Foreign born (%)
Residents speaking other language at home (%)
Residents speaking other language at home - Born in the United States (%)
Residents speaking other language at home - Native, born elsewhere (%)
Residents speaking other language at home - Foreign born (%)
Marital status - Never married (%)
Marital status - Now married (%)
Marital status - Separated (%)
Marital status - Widowed (%)
Marital status - Divorced (%)
Ancestries Reported - Arab (%)
Ancestries Reported - Czech (%)
Ancestries Reported - Danish (%)
Ancestries Reported - Dutch (%)
Ancestries Reported - English (%)
Ancestries Reported - French (%)
Ancestries Reported - French Canadian (%)
Ancestries Reported - German (%)
Ancestries Reported - Greek (%)
Ancestries Reported - Hungarian (%)
Ancestries Reported - Irish (%)
Ancestries Reported - Italian (%)
Ancestries Reported - Lithuanian (%)
Ancestries Reported - Norwegian (%)
Ancestries Reported - Polish (%)
Ancestries Reported - Portuguese (%)
Ancestries Reported - Russian (%)
Ancestries Reported - Scotch-Irish (%)
Ancestries Reported - Scottish (%)
Ancestries Reported - Slovak (%)
Ancestries Reported - Subsaharan African (%)
Ancestries Reported - Swedish (%)
Ancestries Reported - Swiss (%)
Ancestries Reported - Ukrainian (%)
Ancestries Reported - United States (%)
Ancestries Reported - Welsh (%)
Ancestries Reported - West Indian (%)
Ancestries Reported - Other (%)
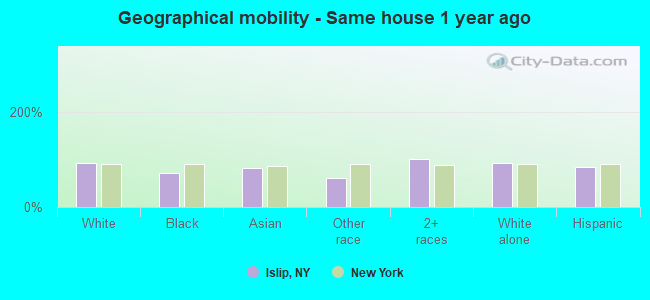
Geographical mobility - Same house 1 year ago (%)
Geographical mobility - Same house 1 year ago (%) - White
Geographical mobility - Same house 1 year ago (%) - Black or African American
Geographical mobility - Same house 1 year ago (%) - Asian
Geographical mobility - Same house 1 year ago (%) - Hispanic or Latino
Geographical mobility - Same house 1 year ago (%) - American Indian and Alaska Native
Geographical mobility - Same house 1 year ago (%) - Multirace
Geographical mobility - Same house 1 year ago (%) - Other Race
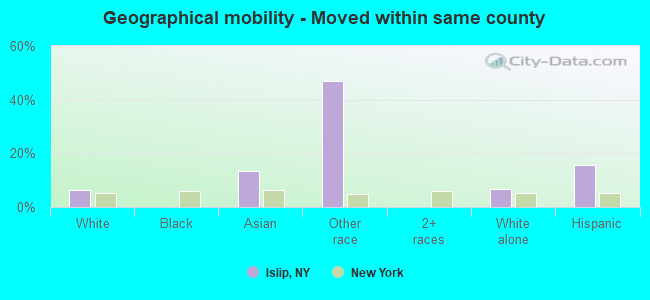
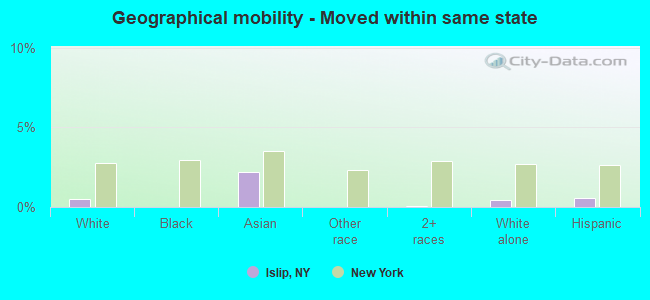
Geographical mobility - Moved within same county (%)
Geographical mobility - Moved within same county (%) - White
Geographical mobility - Moved within same county (%) - Black or African American
Geographical mobility - Moved within same county (%) - Asian
Geographical mobility - Moved within same county (%) - Hispanic or Latino
Geographical mobility - Moved within same county (%) - American Indian and Alaska Native
Geographical mobility - Moved within same county (%) - Multirace
Geographical mobility - Moved within same county (%) - Other Race
Geographical mobility - Moved from different county within same state (%)
Geographical mobility - Moved from different county within same state (%) - White
Geographical mobility - Moved from different county within same state (%) - Black or African American
Geographical mobility - Moved from different county within same state (%) - Asian
Geographical mobility - Moved from different county within same state (%) - Hispanic or Latino
Geographical mobility - Moved from different county within same state (%) - American Indian and Alaska Native
Geographical mobility - Moved from different county within same state (%) - Multirace
Geographical mobility - Moved from different county within same state (%) - Other Race
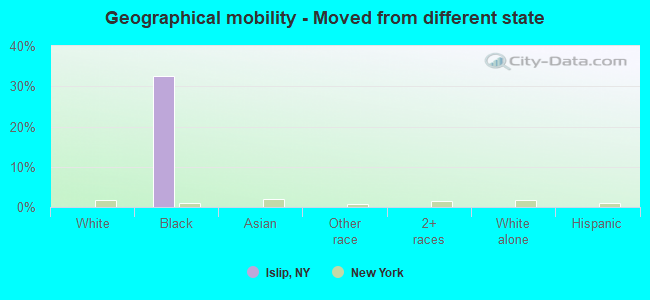
Geographical mobility - Moved from different state (%)
Geographical mobility - Moved from different state (%) - White
Geographical mobility - Moved from different state (%) - Black or African American
Geographical mobility - Moved from different state (%) - Asian
Geographical mobility - Moved from different state (%) - Hispanic or Latino
Geographical mobility - Moved from different state (%) - American Indian and Alaska Native
Geographical mobility - Moved from different state (%) - Multirace
Geographical mobility - Moved from different state (%) - Other Race
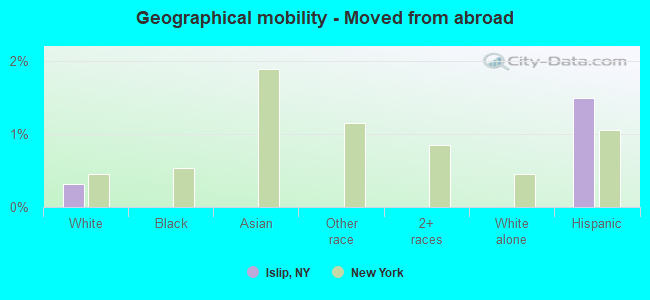
Geographical mobility - Moved from abroad (%)
Geographical mobility - Moved from abroad (%) - White
Geographical mobility - Moved from abroad (%) - Black or African American
Geographical mobility - Moved from abroad (%) - Asian
Geographical mobility - Moved from abroad (%) - Hispanic or Latino
Geographical mobility - Moved from abroad (%) - American Indian and Alaska Native
Geographical mobility - Moved from abroad (%) - Multirace
Geographical mobility - Moved from abroad (%) - Other Race
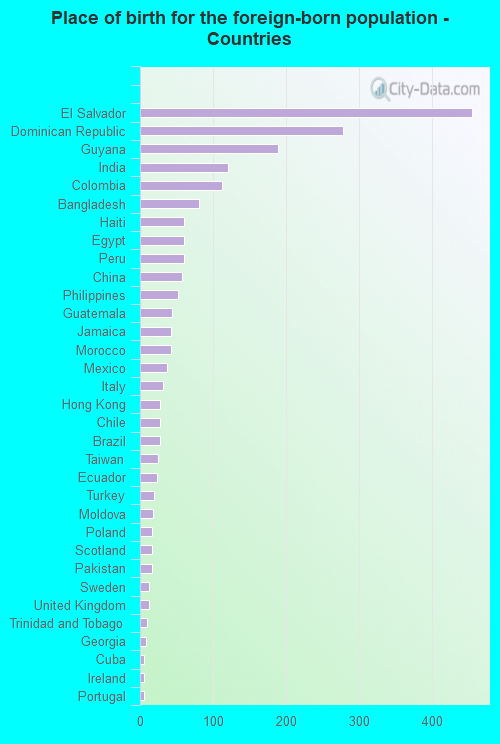
Place of birth for the foreign-born population - Ireland (%)
Place of birth for the foreign-born population - Denmark (%)
Place of birth for the foreign-born population - Norway (%)
Place of birth for the foreign-born population - Sweden (%)
Place of birth for the foreign-born population - United Kingdom (%)
Place of birth for the foreign-born population - England (%)
Place of birth for the foreign-born population - Scotland (%)
Place of birth for the foreign-born population - Other Northern Europe (%)
Place of birth for the foreign-born population - Austria (%)
Place of birth for the foreign-born population - Belgium (%)
Place of birth for the foreign-born population - France (%)
Place of birth for the foreign-born population - Germany (%)
Place of birth for the foreign-born population - Netherlands (%)
Place of birth for the foreign-born population - Switzerland (%)
Place of birth for the foreign-born population - Other Western Europe (%)
Place of birth for the foreign-born population - Greece (%)
Place of birth for the foreign-born population - Italy (%)
Place of birth for the foreign-born population - Portugal (%)
Place of birth for the foreign-born population - Spain (%)
Place of birth for the foreign-born population - Other Southern Europe (%)
Place of birth for the foreign-born population - Albania (%)
Place of birth for the foreign-born population - Belarus (%)
Place of birth for the foreign-born population - Bosnia and Herzegovina (%)
Place of birth for the foreign-born population - Bulgaria (%)
Place of birth for the foreign-born population - Croatia (%)
Place of birth for the foreign-born population - Czechoslovakia (%)
Place of birth for the foreign-born population - Hungary (%)
Place of birth for the foreign-born population - Latvia (%)
Place of birth for the foreign-born population - Lithuania (%)
Place of birth for the foreign-born population - North Macedonia (Macedonia) (%)
Place of birth for the foreign-born population - Moldova (%)
Place of birth for the foreign-born population - Poland (%)
Place of birth for the foreign-born population - Romania (%)
Place of birth for the foreign-born population - Russia (%)
Place of birth for the foreign-born population - Serbia (%)
Place of birth for the foreign-born population - Ukraine (%)
Place of birth for the foreign-born population - Other Eastern Europe (%)
Place of birth for the foreign-born population - China (%)
Place of birth for the foreign-born population - Hong Kong (%)
Place of birth for the foreign-born population - Taiwan (%)
Place of birth for the foreign-born population - Japan (%)
Place of birth for the foreign-born population - Korea (%)
Place of birth for the foreign-born population - Other Eastern Asia (%)
Place of birth for the foreign-born population - Afghanistan (%)
Place of birth for the foreign-born population - Bangladesh (%)
Place of birth for the foreign-born population - India (%)
Place of birth for the foreign-born population - Iran (%)
Place of birth for the foreign-born population - Kazakhstan (%)
Place of birth for the foreign-born population - Nepal (%)
Place of birth for the foreign-born population - Pakistan (%)
Place of birth for the foreign-born population - Sri Lanka (%)
Place of birth for the foreign-born population - Uzbekistan (%)
Place of birth for the foreign-born population - Other South Central Asia (%)
Place of birth for the foreign-born population - Burma (%)
Place of birth for the foreign-born population - Cambodia (%)
Place of birth for the foreign-born population - Indonesia (%)
Place of birth for the foreign-born population - Laos (%)
Place of birth for the foreign-born population - Malaysia (%)
Place of birth for the foreign-born population - Philippines (%)
Place of birth for the foreign-born population - Singapore (%)
Place of birth for the foreign-born population - Thailand (%)
Place of birth for the foreign-born population - Vietnam (%)
Place of birth for the foreign-born population - Other South Eastern Asia (%)
Place of birth for the foreign-born population - Armenia (%)
Place of birth for the foreign-born population - Iraq (%)
Place of birth for the foreign-born population - Israel (%)
Place of birth for the foreign-born population - Jordan (%)
Place of birth for the foreign-born population - Kuwait (%)
Place of birth for the foreign-born population - Lebanon (%)
Place of birth for the foreign-born population - Saudi Arabia (%)
Place of birth for the foreign-born population - Syria (%)
Place of birth for the foreign-born population - Turkey (%)
Place of birth for the foreign-born population - Yemen (%)
Place of birth for the foreign-born population - Other Western Asia (%)
Place of birth for the foreign-born population - Eritrea (%)
Place of birth for the foreign-born population - Ethiopia (%)
Place of birth for the foreign-born population - Kenya (%)
Place of birth for the foreign-born population - Somalia (%)
Place of birth for the foreign-born population - Uganda (%)
Place of birth for the foreign-born population - Zimbabwe (%)
Place of birth for the foreign-born population - Other Eastern Africa (%)
Place of birth for the foreign-born population - Cameroon (%)
Place of birth for the foreign-born population - Congo (%)
Place of birth for the foreign-born population - Democratic Republic of Congo (Zaire) (%)
Place of birth for the foreign-born population - Other Middle Africa (%)
Place of birth for the foreign-born population - Egypt (%)
Place of birth for the foreign-born population - Morocco (%)
Place of birth for the foreign-born population - Sudan (%)
Place of birth for the foreign-born population - Other Northern Africa (%)
Place of birth for the foreign-born population - South Africa (%)
Place of birth for the foreign-born population - Other Southern Africa (%)
Place of birth for the foreign-born population - Cabo Verde (%)
Place of birth for the foreign-born population - Ghana (%)
Place of birth for the foreign-born population - Liberia (%)
Place of birth for the foreign-born population - Nigeria (%)
Place of birth for the foreign-born population - Senegal (%)
Place of birth for the foreign-born population - Sierra Leone (%)
Place of birth for the foreign-born population - Other Western Africa (%)
Place of birth for the foreign-born population - Australia (%)
Place of birth for the foreign-born population - New Zealand (%)
Place of birth for the foreign-born population - Fiji (%)
Place of birth for the foreign-born population - Micronesia (%)
Place of birth for the foreign-born population - Bahamas (%)
Place of birth for the foreign-born population - Barbados (%)
Place of birth for the foreign-born population - Cuba (%)
Place of birth for the foreign-born population - Dominica (%)
Place of birth for the foreign-born population - Dominican Republic (%)
Place of birth for the foreign-born population - Grenada (%)
Place of birth for the foreign-born population - Haiti (%)
Place of birth for the foreign-born population - Jamaica (%)
Place of birth for the foreign-born population - St. Vincent and the Grenadines (%)
Place of birth for the foreign-born population - Trinidad and Tobago (%)
Place of birth for the foreign-born population - West Indies (%)
Place of birth for the foreign-born population - Other Caribbean (%)
Place of birth for the foreign-born population - Belize (%)
Place of birth for the foreign-born population - Costa Rica (%)
Place of birth for the foreign-born population - El Salvador (%)
Place of birth for the foreign-born population - Guatemala (%)
Place of birth for the foreign-born population - Honduras (%)
Place of birth for the foreign-born population - Mexico (%)
Place of birth for the foreign-born population - Nicaragua (%)
Place of birth for the foreign-born population - Panama (%)
Place of birth for the foreign-born population - Other Central America (%)
Place of birth for the foreign-born population - Argentina (%)
Place of birth for the foreign-born population - Bolivia (%)
Place of birth for the foreign-born population - Brazil (%)
Place of birth for the foreign-born population - Chile (%)
Place of birth for the foreign-born population - Colombia (%)
Place of birth for the foreign-born population - Ecuador (%)
Place of birth for the foreign-born population - Guyana (%)
Place of birth for the foreign-born population - Peru (%)
Place of birth for the foreign-born population - Uruguay (%)
Place of birth for the foreign-born population - Venezuela (%)
Place of birth for the foreign-born population - Other South America (%)
Place of birth for the foreign-born population - Canada (%)
Place of birth for the foreign-born population - Other Northern America (%)
Place of birth for the foreign-born population - Other (%)
Latest news about races in Islip, NY collected exclusively by city-data.com from local newspapers, TV, and radio stations
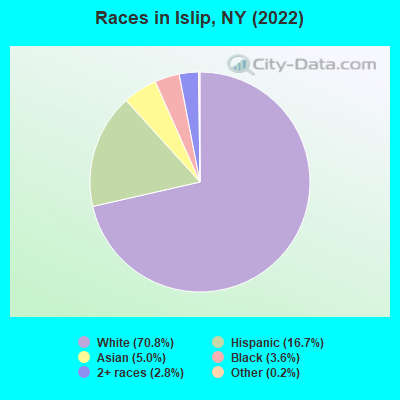
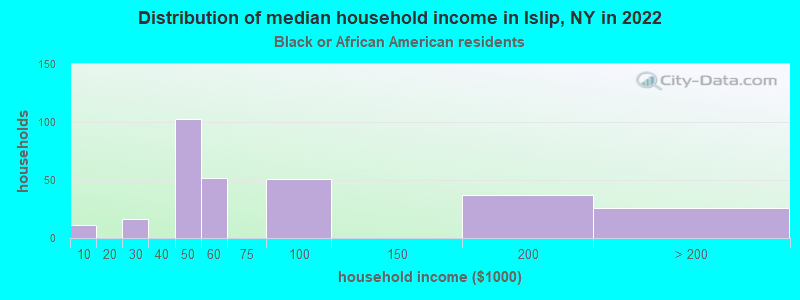
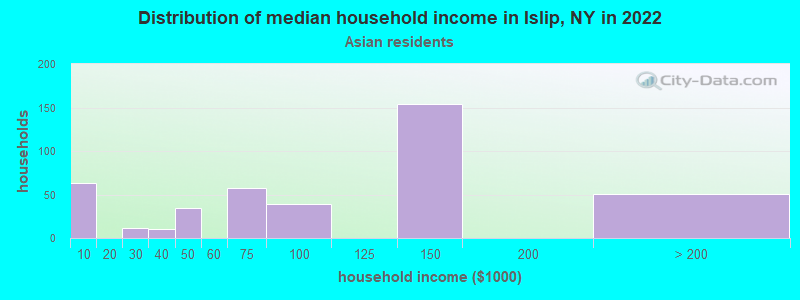
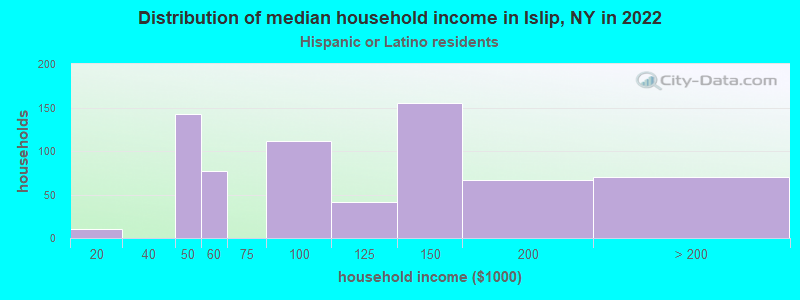
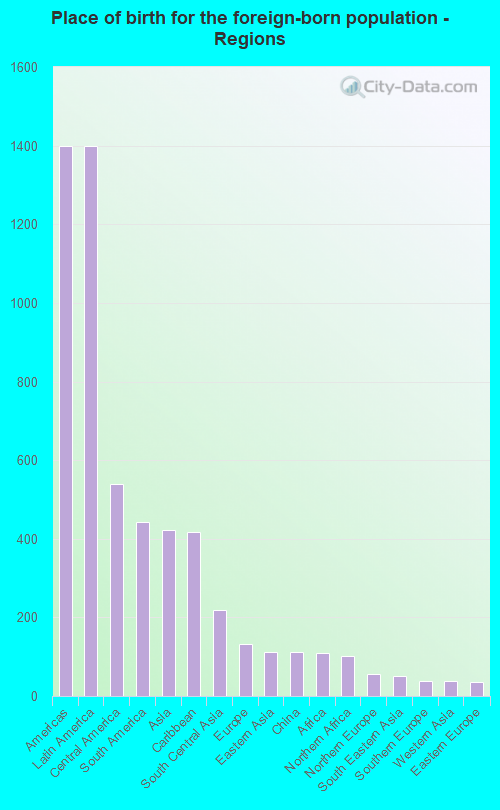
According to 2022 data, the most numerous races in Islip, NY are White alone (12,249 residents), Hispanic (2,886 residents), and Black alone (624 residents). 82.9% of Islip residents speak English at home. 11.9% of Islip, NY residents are foreign-born (8.2% born in Latin America, 2.5% born in Asia), which is 84.3% less than the foreign-born rate of 22.0% across the entire state of New York.
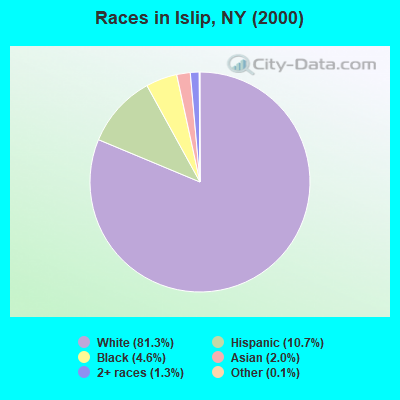
Race distribution in Islip
2000 2022
11,760,981 62.0% White alone 2,867,583 15.1% Hispanic 2,812,623 14.8% Black alone 1,035,926 5.5% Asian alone 366,116 1.9% Two or more races 75,499 0.4% Other race alone 52,499 0.3% American Indian alone 5,230 0.03% Native Hawaiian and Other
10,408,933 52.9% White alone 3,867,299 19.7% Hispanic 2,633,840 13.4% Black alone 1,776,286 9.0% Asian alone 732,670 3.7% Two or more races 216,110 1.1% Other race alone 35,082 0.2% American Indian alone 6,931 0.04% Native Hawaiian and Other
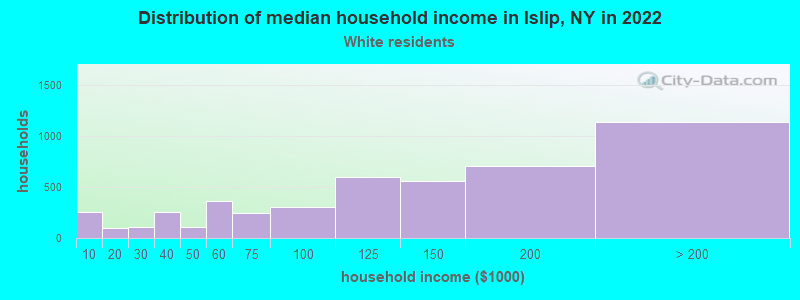
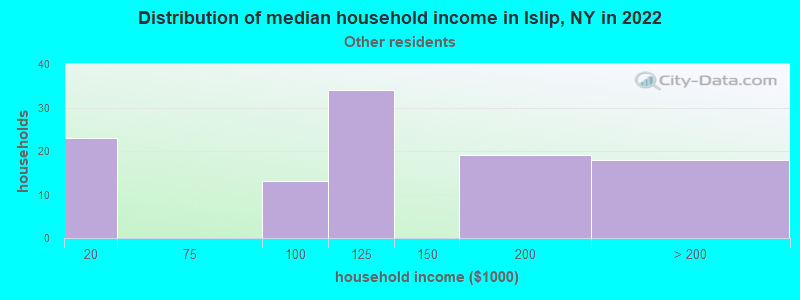
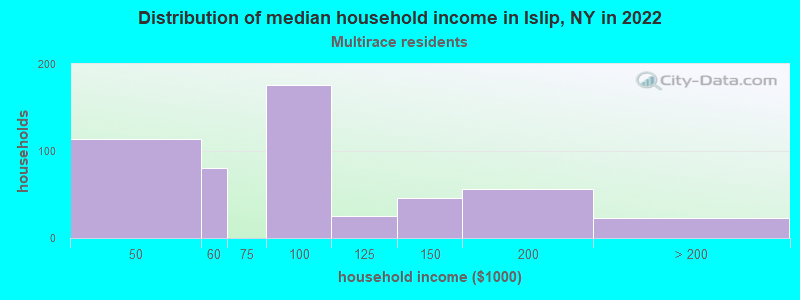
Income and house value in Islip Median household income in 2022 $126,793 White non-Hispanic householders$55,132 Black householders$113,481 Asian householders$106,766 Some other race householders$76,971 Two or more races householders$103,878 Hispanic or Latino race householdersMedian 2022 house value $513,980 White Non-Hispanic householders$470,629 Black or African American householders$289,503 American Indian or Alaska Native householders $629,782 Asian householders$522,294 Some other race householders$558,816 Two or more races householders$495,868 Hispanic or Latino householders
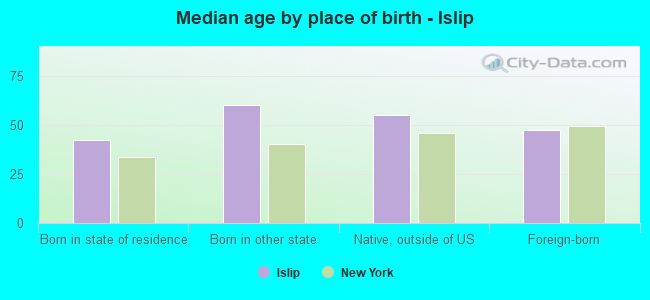
Median age by race in Islip
48.4 Median age for White residents46.4 52.2 62.2 Median age for Black or African American residents61.7 62.1 -748,832,865.7 Median age for American Indian / Alaska Native residents-807,017,543.1 -513,692,161.9 43.1 Median age for Asian residents48.7 43.2 -742,816,091.2 Median age for Native Hawaiian / Pacific Islander residents-831,187,409.8 -771,300,447.7 17.9 Median age for Other race residents13.7 20.5 33.8 Median age for Two or more races residents36.5 34.2 48.5 Median age for White alone residents46.3 51.6 33.0 Median age for Hispanic or Latino residents33.6 32.3
Owner/renter occupied households by race in Islip
House owners and renters - White residents 4,223 88.4% Owner occupied555 11.6% Renter occupiedHouse owners and renters - Black or African American residents 136 43.8% Owner occupied174 56.2% Renter occupiedHouse owners and renters - Asian residents 374 94.7% Owner occupied21 5.3% Renter occupiedHouse owners and renters - Other race residents 61 60.5% Owner occupied40 39.5% Renter occupiedHouse owners and renters - Two or more races residents 429 81.0% Owner occupied100 19.0% Renter occupiedHouse owners and renters - White alone residents 4,273 88.4% Owner occupied563 11.6% Renter occupiedHouse owners and renters - Hispanic or Latino residents 510 77.8% Owner occupied146 22.2% Renter occupied
Language usage in Islip
English speakers - Total 82.9% of residents of Islip speak English at home.
11.6% of residents speak Spanish at home 982 51.4% Speak English very well927 48.6% Speak English less than very well4.8% of residents speak other language at home 575 72.3% Speak English very well220 27.7% Speak English less than very well
English speakers - Born in the United States 96.1% of residents of Islip speak English at home.
2.0% of residents speak Spanish at home 24 100.0% Speak English very well2.2% of residents speak other language at home 26 100.0% Speak English very well
English speakers - Native, born elsewhere 31.4% of residents of Islip speak English at home.
59.5% of residents speak Spanish at home 34 47.2% Speak English very well38 52.8% Speak English less than very well
English speakers - Foreign-born 29.8% of residents of Islip speak English at home.
47.4% of residents speak Spanish at home 260 24.5% Speak English very well802 75.5% Speak English less than very well23.1% of residents speak other language at home 299 57.8% Speak English very well218 42.2% Speak English less than very well
White (Caucasian) - Speak only English Native:
98.3% (11,102)Foreign-born:
39.5% (163)
White (Caucasian) - Speak another language Native:
2.6% (295)Foreign-born:
63.5% (261)
Black or African American - Speak only English Native:
97.0% (465)Foreign-born:
94.2% (149)
Asian - Speak only English Native:
40.7% (99)Foreign-born:
31.4% (206)
Asian - Speak another language Native:
60.1% (147)Foreign-born:
55.0% (361)
Other race - Speak another language Native:
44.4% (198)Foreign-born:
100.0% (333)
Two or more races - Speak only English Native:
63.8% (1,013)Foreign-born:
6.0% (40)
Two or more races - Speak another language Native:
36.1% (573)Foreign-born:
94.8% (627)
White alone - Speak only English Native:
96.9% (11,175)Foreign-born:
58.7% (141)
White alone - Speak another language Native:
3.0% (351)Foreign-born:
41.4% (99)
Hispanic or Latino - Speak only English Native:
59.4% (825)Foreign-born:
12.3% (148)
Hispanic or Latino - Speak another language Native:
41.2% (573)Foreign-born:
87.2% (1,045)
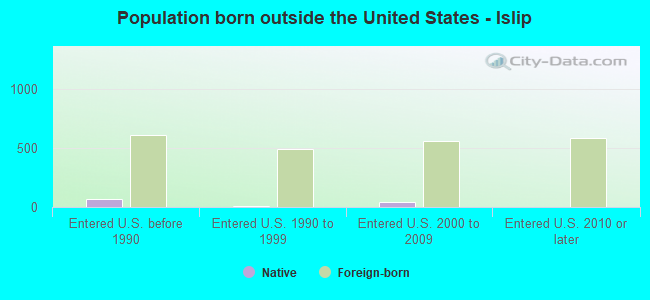
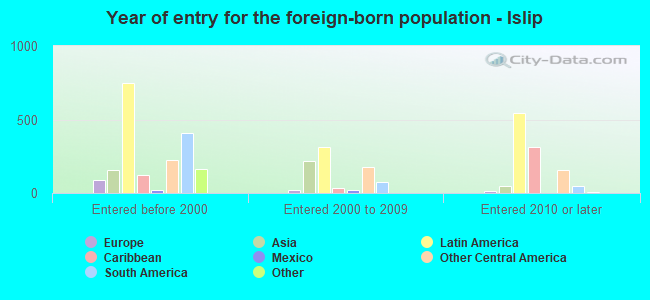
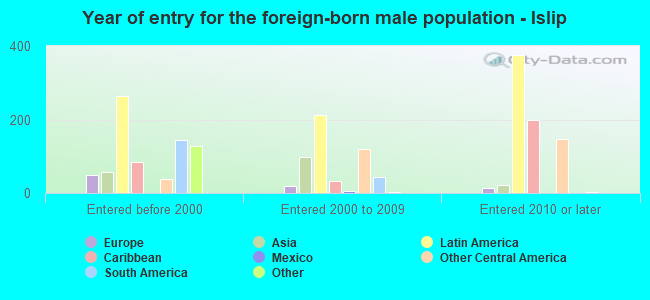
Foreign-born residents in Islip 2,064 residents are foreign born (8.2% Latin America , 2.5% Asia ).
This city:
11.9%New York:
22.6%
Marital status for residents in Islip Marital status - White (Caucasian) population 15 years and over
Males 31.7% Never married54.3% Now married1.8% Separated3.8% Widowed8.4% DivorcedFemales 27.8% Never married51.1% Now married0.5% Separated12.1% Widowed8.6% DivorcedWomen who gave birth in the past 12 months Now married:
75.9% (93)Unmarried:
24.1% (29)
Women who did not give birth in the past 12 months Now married:
41.6% (888)Unmarried:
58.4% (1,245)
Marital status - Black or African American population 15 years and over
Males 20.7% Never married58.1% Now married14.3% Separated0.0% Widowed6.9% DivorcedFemales 26.0% Never married58.6% Now married0.0% Separated9.3% Widowed6.2% DivorcedWomen who did not give birth in the past 12 months Now married:
68.0% (17)Unmarried:
32.0% (8)
Marital status - Asian population 15 years and over
Males 41.9% Never married58.1% Now married0.0% Separated0.0% Widowed0.0% DivorcedFemales 27.6% Never married62.7% Now married0.0% Separated0.7% Widowed8.9% DivorcedWomen who did not give birth in the past 12 months Now married:
79.3% (251)Unmarried:
20.7% (66)
Marital status - Other race population 15 years and over
Males 42.8% Never married57.2% Now married0.0% Separated0.0% Widowed0.0% DivorcedFemales 45.7% Never married42.9% Now married0.0% Separated4.7% Widowed6.7% DivorcedWomen who gave birth in the past 12 months Now married:
40.6% (19)Unmarried:
59.4% (28)
Women who did not give birth in the past 12 months Now married:
41.2% (112)Unmarried:
58.8% (160)
Marital status - Two or more races population 15 years and over
Males 48.2% Never married48.7% Now married0.3% Separated0.0% Widowed2.8% DivorcedFemales 40.3% Never married31.5% Now married1.7% Separated6.0% Widowed20.5% DivorcedWomen who gave birth in the past 12 months Now married:
100.0% (18)Unmarried:
0.0% (0)
Women who did not give birth in the past 12 months Now married:
35.1% (239)Unmarried:
64.9% (441)
Marital status - White alone, not Hispanic / Latino population 15 years and over
Males 31.7% Never married53.7% Now married1.9% Separated4.0% Widowed8.7% DivorcedFemales 28.3% Never married50.4% Now married0.5% Separated12.4% Widowed8.4% DivorcedWomen who gave birth in the past 12 months Now married:
75.9% (100)Unmarried:
24.1% (32)
Women who did not give birth in the past 12 months Now married:
40.2% (871)Unmarried:
59.8% (1,294)
Marital status - Hispanic or Latino population 15 years and over
Males 42.0% Never married55.9% Now married0.2% Separated0.0% Widowed1.9% DivorcedFemales 32.7% Never married44.1% Now married1.0% Separated5.5% Widowed16.7% DivorcedWomen who gave birth in the past 12 months Now married:
56.8% (26)Unmarried:
43.2% (20)
Women who did not give birth in the past 12 months Now married:
46.0% (357)Unmarried:
54.0% (419)
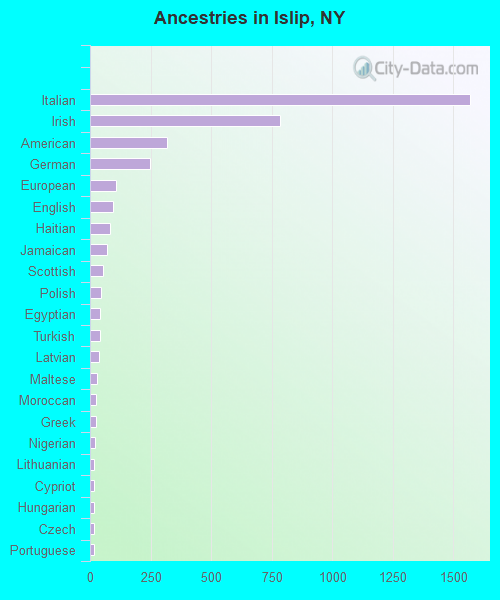
Ancestries in Islip
1,569 24.2% Italian784 12.1% Irish319 4.9% American247 3.8% German108 1.7% European96 1.5% English81 1.2% Haitian69 1.1% Jamaican52 0.8% Scottish45 0.7% Polish43 0.7% Egyptian43 0.7% Turkish37 0.6% Latvian28 0.4% Maltese26 0.4% Moroccan25 0.4% Greek20 0.3% Nigerian18 0.3% Lithuanian17 0.3% Cypriot17 0.3% Hungarian16 0.2% Czech15 0.2% Portuguese14 0.2% Estonian12 0.2% African9 0.1% Eastern European9 0.1% Swedish8 0.1% Dutch7 0.1% Ukrainian6 0.09% French Canadian5 0.08% British3 0.05% Northern European3 0.05% Russian
Children Nativity (place of birth) in Islip
Children under 6 years - Living with two parents Both parents native 664 100.0% NativeBoth parents foreign-born 51 100.0% NativeOne native, one foreign-born parent 177 100.0% NativeChildren under 6 years - Living with one parent Native parent 53 100.0% NativeForeign-born parent 71 100.0% NativeChildren 6 to 17 years - Living with two parents Both parents native 927 98.5% Native14 1.5% Foreign-bornBoth parents foreign-born 312 90.7% Native32 9.3% Foreign-bornOne native, one foreign-born parent 226 97.0% Native7 3.0% Foreign-bornChildren 6 to 17 years - Living with one parent Native parent 426 100.0% NativeForeign-born parent 20 51.5% Native18 48.5% Foreign-born
Grandparents responsible for own grandchildren in Islip
Grandparents (30 to 59 years) White / Caucasian 49 79.6% Responsible for grandchildren12 20.4% Not responsible for grandchildrenBlack or African American 5 100.0% Not responsible for grandchildrenOther race 15 52.8% Responsible for grandchildren13 47.2% Not responsible for grandchildrenTwo or more races 66 100.0% Not responsible for grandchildrenWhite alone, not Hispanic / Latino 14 100.0% Not responsible for grandchildrenHispanic or Latino 73 63.8% Responsible for grandchildren41 36.2% Not responsible for grandchildrenGrandparents (60 years and over) White / Caucasian 63 22.9% Responsible for grandchildren213 77.1% Not responsible for grandchildrenTwo or more races 23 100.0% Not responsible for grandchildrenWhite alone, not Hispanic / Latino 31 12.1% Responsible for grandchildren225 87.9% Not responsible for grandchildrenHispanic or Latino 28 50.5% Responsible for grandchildren27 49.5% Not responsible for grandchildren