Estimated zip code population in 2022: 13,286 Zip code population in 2010: 14,961 Zip code population in 2000: 15,083
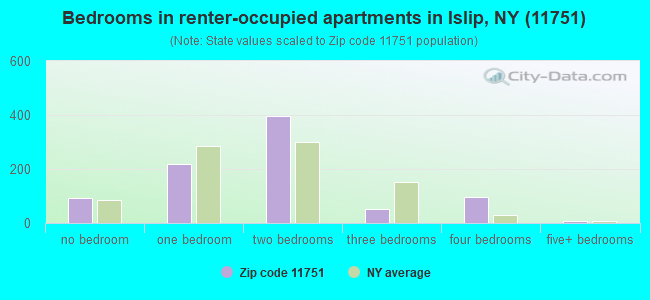
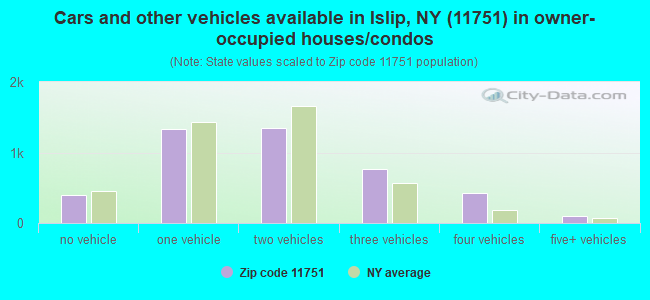
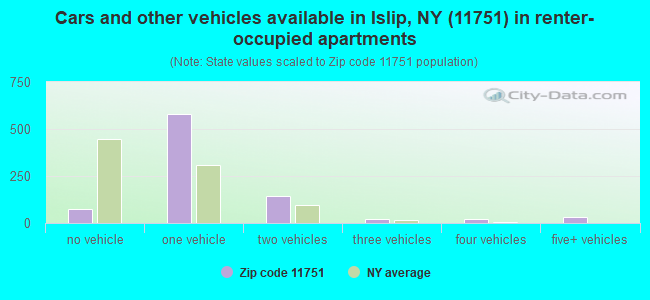
Houses and condos: 5,515 Renter-occupied apartments: 868
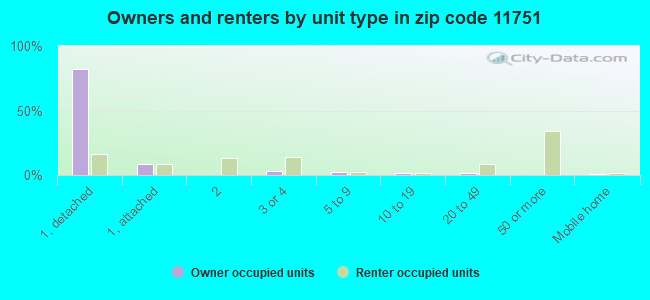
% of renters here:
16%
State:
46%
March 2022 cost of living index in zip code 11751: 149.9 (very high, U.S. average is 100)
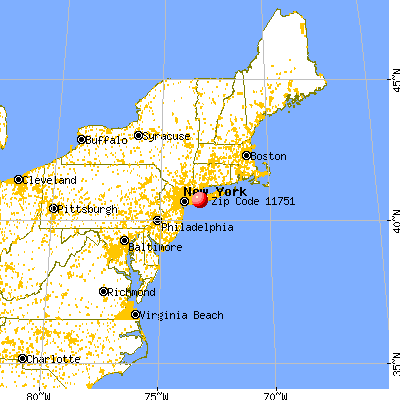
Land area: 4.0 sq. mi. Water area: 0.6 sq. mi.
Population density: 3,307 people per square mile
(average).
OSM Map
General Map
Google Map
MSN Map
OSM Map
General Map
Google Map
MSN Map
OSM Map
General Map
Google Map
MSN Map
OSM Map
General Map
Google Map
MSN Map
Please wait while loading the map...
Real estate property taxes paid for housing units in 2022:
This zip code:
2.0% ($9,805)
New York:
1.5% ($6,180)
Median real estate property taxes paid for housing units with mortgages in 2022: $9,858 (1.9%) Median real estate property taxes paid for housing units with no mortgage in 2022: $9,755 (2.2%)
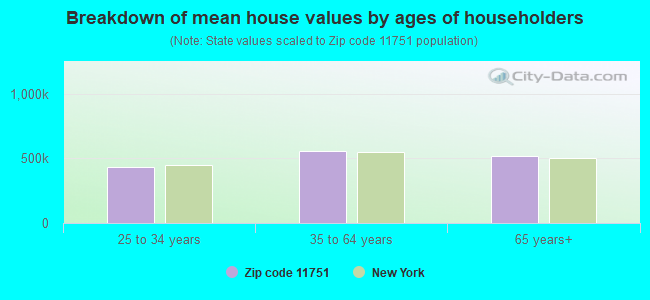
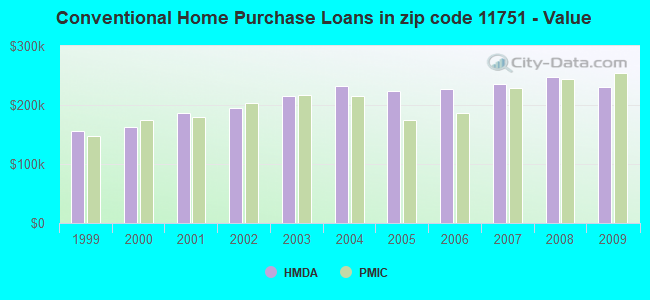
Estimated median house/condo value in 2022: $489,216
11751:
$489,216
New York:
$400,400
According to our research of New York and other state lists, there were 3 registered sex offenders living in 11751 zip code as of April 27, 2024. The ratio of all residents to sex offenders in zip code 11751 is 4,839 to 1. The ratio of registered sex offenders to all residents in this zip code is much lower than the state average.
Median resident age:
This zip code:
46.4 years
New York median age:
40.0 years
Average household size:
This zip code:
2.5 people
New York:
2.5 people
Averages for the 2020 tax year for zip code 11751, filed in 2021:
Average Adjusted Gross Income (AGI) in 2020: $92,380 (Individual Income Tax Returns)
Here:
$92,380
State:
$90,930
Salary/wage: $77,729 (reported on 83.1% of returns)
Here:
$77,729
State:
$72,104
(% of AGI for various income ranges: 1137.1% for AGIs below $25k, 3739.0% for AGIs $25k-50k, 6840.6% for AGIs $50k-75k, 9693.1% for AGIs $75k-100k, 17821.7% for AGIs $100k-200k, 62692.2% for AGIs over 200k)
Taxable interest for individuals: $1,647 (reported on 47.7% of returns)
This zip code:
$1,647
New York:
$3,075
(% of AGI for various income ranges: 22.1% for AGIs below $25k, 27.6% for AGIs $25k-50k, 45.7% for AGIs $50k-75k, 116.8% for AGIs $75k-100k, 138.3% for AGIs $100k-200k, 1214.8% for AGIs over 200k)
Ordinary dividends: $5,065 (reported on 25.1% of returns)
Here:
$5,065
State:
$11,095
(% of AGI for various income ranges: 32.2% for AGIs below $25k, 50.8% for AGIs $25k-50k, 89.3% for AGIs $50k-75k, 117.7% for AGIs $75k-100k, 289.2% for AGIs $100k-200k, 1822.6% for AGIs over 200k)
Net capital gain/loss in AGI: +$16,319 (reported on 22.5% of returns)
Here:
+$16,319
State:
+$44,925
(% of AGI for various income ranges: 18.4% for AGIs below $25k, 30.4% for AGIs $25k-50k, 69.3% for AGIs $50k-75k, 133.7% for AGIs $75k-100k, 364.6% for AGIs $100k-200k, 8946.7% for AGIs over 200k)
Profit/loss from business: +$16,536 (reported on 12.8% of returns)
Here:
+$16,536
State:
+$14,940
(% of AGI for various income ranges: 80.6% for AGIs below $25k, 159.3% for AGIs $25k-50k, 153.1% for AGIs $50k-75k, 144.7% for AGIs $75k-100k, 267.1% for AGIs $100k-200k, 3505.9% for AGIs over 200k)
Taxable individual retirement arrangement distribution: $18,934 (reported on 9.3% of returns)
11751:
$18,934
New York:
$19,609
(% of AGI for various income ranges: 53.9% for AGIs below $25k, 79.3% for AGIs $25k-50k, 219.3% for AGIs $50k-75k, 319.4% for AGIs $75k-100k, 453.4% for AGIs $100k-200k, 1616.7% for AGIs over 200k)
Self-employed (Keogh) retirement plans: $22,740 (reported on 0.6% of returns)
11751:
$22,740
New York:
$32,497
(% of AGI for various income ranges: 421.1% for AGIs over 200k)
Total itemized deductions: $26,594 (reported on 18.1% of returns)
Here:
$26,594
State:
$39,326
(% of AGI for various income ranges: 108.6% for AGIs below $25k, 250.1% for AGIs $25k-50k, 539.2% for AGIs $50k-75k, 886.5% for AGIs $75k-100k, 1279.0% for AGIs $100k-200k, 4375.6% for AGIs over 200k)
Charity contributions: $3,690 (reported on 16.4% of returns)
Here:
$3,690
State:
$15,420
(% of AGI for various income ranges: 7.4% for AGIs below $25k, 20.0% for AGIs $25k-50k, 46.0% for AGIs $50k-75k, 86.9% for AGIs $75k-100k, 171.7% for AGIs $100k-200k, 708.1% for AGIs over 200k)
Taxes paid: $9,417 (reported on 18.1% of returns)
11751:
$9,417
State:
$9,183
(% of AGI for various income ranges: 51.2% for AGIs below $25k, 90.4% for AGIs $25k-50k, 212.3% for AGIs $50k-75k, 360.6% for AGIs $75k-100k, 478.1% for AGIs $100k-200k, 1213.3% for AGIs over 200k)
Earned income credit: $1,704 (reported on 6.8% of returns)
Here:
$1,704
State:
$2,138
(% of AGI for various income ranges: 43.8% for AGIs below $25k, 34.2% for AGIs $25k-50k)
Percentage of individuals using paid preparers for their 2020 taxes: 95.4%
Here:
95%
State:
95%
(% for various income ranges: 93.4% for AGIs below $25k, 95.5% for AGIs $25k-50k, 95.9% for AGIs $50k-75k, 96.8% for AGIs $75k-100k, 96.5% for AGIs $100k-200k, 96.0% for AGIs over 200k)
Averages for the 2012 tax year for zip code 11751, filed in 2013:
Average Adjusted Gross Income (AGI) in 2012: $77,126 (Individual Income Tax Returns)
Here:
$77,126
State:
$77,088
Salary/wage: $66,386 (reported on 84.9% of returns)
Here:
$66,386
State:
$60,593
(% of AGI for various income ranges: 69.8% for AGIs below $25k, 76.5% for AGIs $25k-50k, 77.0% for AGIs $50k-75k, 76.3% for AGIs $75k-100k, 81.3% for AGIs $100k-200k, 58.4% for AGIs over 200k)
Taxable interest for individuals: $1,154 (reported on 50.5% of returns)
This zip code:
$1,154
New York:
$3,125
(% of AGI for various income ranges: 1.8% for AGIs below $25k, 0.7% for AGIs $25k-50k, 0.6% for AGIs $50k-75k, 0.6% for AGIs $75k-100k, 0.5% for AGIs $100k-200k, 1.0% for AGIs over 200k)
Ordinary dividends: $5,356 (reported on 25.9% of returns)
Here:
$5,356
State:
$10,299
(% of AGI for various income ranges: 2.4% for AGIs below $25k, 1.2% for AGIs $25k-50k, 1.1% for AGIs $50k-75k, 1.0% for AGIs $75k-100k, 0.8% for AGIs $100k-200k, 3.8% for AGIs over 200k)
Net capital gain/loss in AGI: +$11,218 (reported on 19.3% of returns)
Here:
+$11,218
State:
+$42,474
(% of AGI for various income ranges: 0.2% for AGIs $50k-75k, 0.4% for AGIs $100k-200k, 9.7% for AGIs over 200k)
Profit/loss from business: +$18,428 (reported on 12.6% of returns)
Here:
+$18,428
State:
+$16,168
(% of AGI for various income ranges: 6.0% for AGIs below $25k, 3.2% for AGIs $25k-50k, 2.2% for AGIs $50k-75k, 1.6% for AGIs $75k-100k, 2.0% for AGIs $100k-200k, 4.8% for AGIs over 200k)
Taxable individual retirement arrangement distribution: $15,773 (reported on 10.5% of returns)
11751:
$15,773
New York:
$17,621
(% of AGI for various income ranges: 2.9% for AGIs below $25k, 2.5% for AGIs $25k-50k, 2.2% for AGIs $50k-75k, 2.7% for AGIs $75k-100k, 1.7% for AGIs $100k-200k, 2.2% for AGIs over 200k)
Self-employment retirement plans: $21,300 (reported on 0.8% of returns)
11751:
$21,300
New York:
$27,330
Total itemized deductions: $30,594 (25% of AGI, reported on 53.0% of returns)
Here:
$30,594
State:
$34,985
Here:
25.2% of AGI
State:
21.3% of AGI
(% of AGI for various income ranges: 18.0% for AGIs below $25k, 18.1% for AGIs $25k-50k, 21.8% for AGIs $50k-75k, 23.8% for AGIs $75k-100k, 23.1% for AGIs $100k-200k, 18.2% for AGIs over 200k)
Charity contributions: $2,424 (reported on 48.7% of returns)
Here:
$2,424
State:
$5,572
(% of AGI for various income ranges: 1.0% for AGIs below $25k, 1.4% for AGIs $25k-50k, 1.6% for AGIs $50k-75k, 1.8% for AGIs $75k-100k, 1.8% for AGIs $100k-200k, 1.2% for AGIs over 200k)
Taxes paid: $16,483 (reported on 53.0% of returns)
11751:
$16,483
State:
$18,656
(% of AGI for various income ranges: 8.2% for AGIs below $25k, 8.2% for AGIs $25k-50k, 10.1% for AGIs $50k-75k, 12.2% for AGIs $75k-100k, 11.9% for AGIs $100k-200k, 12.2% for AGIs over 200k)
Earned income credit: $1,721 (reported on 8.9% of returns)
Here:
$1,721
State:
$2,230
(% of AGI for various income ranges: 3.1% for AGIs below $25k, 0.7% for AGIs $25k-50k)
Percentage of individuals using paid preparers for their 2012 taxes: 72.4%
Here:
72%
State:
66%
(% for various income ranges: 65.1% for AGIs below $25k, 68.8% for AGIs $25k-50k, 74.1% for AGIs $50k-75k, 77.9% for AGIs $75k-100k, 79.1% for AGIs $100k-200k, 87.2% for AGIs over 200k)
Averages for the 2004 tax year for zip code 11751, filed in 2005:
Average Adjusted Gross Income (AGI) in 2004: $65,109 (Individual Income Tax Returns)
Here:
$65,109
State:
$59,519
Salary/wage: $57,008 (reported on 84.9% of returns)
Here:
$57,008
State:
$50,673
(% of AGI for various income ranges: 129.7% for AGIs below $10k, 68.7% for AGIs $10k-25k, 78.9% for AGIs $25k-50k, 81.1% for AGIs $50k-75k, 81.8% for AGIs $75k-100k, 68.4% for AGIs over 100k)
Taxable interest for individuals: $1,502 (reported on 65.0% of returns)
This zip code:
$1,502
New York:
$2,377
(% of AGI for various income ranges: 9.0% for AGIs below $10k, 3.3% for AGIs $10k-25k, 1.6% for AGIs $25k-50k, 1.3% for AGIs $50k-75k, 0.9% for AGIs $75k-100k, 1.4% for AGIs over 100k)
Taxable dividends: $2,318 (reported on 32.3% of returns)
Here:
$2,318
State:
$5,394
(% of AGI for various income ranges: 5.4% for AGIs below $10k, 2.3% for AGIs $10k-25k, 1.1% for AGIs $25k-50k, 1.1% for AGIs $50k-75k, 0.8% for AGIs $75k-100k, 1.1% for AGIs over 100k)
Net capital gain/loss: +$4,702 (reported on 24.1% of returns)
Here:
+$4,702
State:
+$23,581
(% of AGI for various income ranges: -5.8% for AGIs below $10k, 0.2% for AGIs $10k-25k, -0.1% for AGIs $25k-50k, 0.4% for AGIs $50k-75k, 0.7% for AGIs $75k-100k, 3.2% for AGIs over 100k)
Profit/loss from business: +$14,529 (reported on 12.8% of returns)
Here:
+$14,529
State:
+$13,809
(% of AGI for various income ranges: 10.7% for AGIs below $10k, 6.4% for AGIs $10k-25k, 3.3% for AGIs $25k-50k, 2.1% for AGIs $50k-75k, 2.3% for AGIs $75k-100k, 2.7% for AGIs over 100k)
IRA payment deduction: $3,345 (reported on 3.6% of returns)
11751:
$3,345
New York:
$3,115
(% of AGI for various income ranges: 0.1% for AGIs $10k-25k, 0.3% for AGIs $25k-50k, 0.3% for AGIs $50k-75k, 0.2% for AGIs $75k-100k, 0.1% for AGIs over 100k)
Self-employed pension: $18,000 (reported on 0.9% of returns)
Here:
$18,000
New York:
$19,016
(% of AGI for various income ranges: 0.1% for AGIs $50k-75k, 0.1% for AGIs $75k-100k, 0.4% for AGIs over 100k)
Total itemized deductions: $24,288 (25% of AGI, reported on 56.1% of returns)
Here:
$24,288
State:
$25,864
Here:
24.7% of AGI
State:
21.9% of AGI
(% of AGI for various income ranges: 20.2% for AGIs below $10k, 19.8% for AGIs $10k-25k, 20.7% for AGIs $25k-50k, 25.2% for AGIs $50k-75k, 25.0% for AGIs $75k-100k, 18.5% for AGIs over 100k)
Charity contributions deductions: $2,653 (3% of AGI, reported on 53.6% of returns)
Here:
$2,653
State:
$4,439
Here:
2.6% of AGI
State:
3.6% of AGI
(% of AGI for various income ranges: 1.7% for AGIs below $10k, 1.8% for AGIs $10k-25k, 2.1% for AGIs $25k-50k, 2.6% for AGIs $50k-75k, 2.6% for AGIs $75k-100k, 2.0% for AGIs over 100k)
Total tax: $10,616 (reported on 80.8% of returns)
11751:
$10,616
State:
$11,730
(% of AGI for various income ranges: 3.4% for AGIs below $10k, 4.3% for AGIs $10k-25k, 7.2% for AGIs $25k-50k, 8.5% for AGIs $50k-75k, 9.2% for AGIs $75k-100k, 18.3% for AGIs over 100k)
Earned income credit: $1,441 (reported on 7.5% of returns)
Here:
$1,441
State:
$1,757
Percentage of individuals using paid preparers for their 2004 taxes: 72.3%
Here:
72%
State:
67%
(% for various income ranges: 60.1% for AGIs below $10k, 67.4% for AGIs $10k-25k, 70.1% for AGIs $25k-50k, 78.5% for AGIs $50k-75k, 76.8% for AGIs $75k-100k, 82.3% for AGIs over 100k)
Household received Food Stamps/SNAP in the past 12 months: 252 Household did not receive Food Stamps/SNAP in the past 12 months: 4,970
Women who had a birth in the past 12 months: 109 (88 now married, 20 unmarried) Women who did not have a birth in the past 12 months: 2,571 (1,087 now married, 1,476 unmarried)
Housing units in zip code 11751 with a mortgage: 2,482 (314 second mortgage, 17 home equity loan, 280 both second mortgage and home equity loan) Houses without a mortgage: 252
Median monthly owner costs for units with a mortgage: $3,058 Median monthly owner costs for units without a mortgage: $1,443
Residents with income below the poverty level in 2022:
This zip code:
5.4%
Whole state:
14.3%
Residents with income below 50% of the poverty level in 2022:
This zip code:
0.9%
Whole state:
6.8%
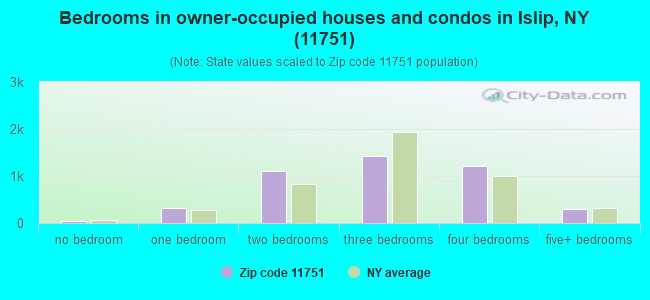
Median number of rooms in houses and condos:
Here:
6.7
State:
6.3
Median number of rooms in apartments:
Here:
3.9
State:
3.8
Notable locations in this zip code not listed on our city pages
Notable locations in zip code 11751: Bayberry Yacht Club (A), Islip Station (B), Islip Speedway (C), Islip Public Library (D), Islip Fire Department (E), Islip Town Hall (F), Pearl Garden Manor Assisted Living Facility (G). Display/hide their locations on the map
Churches in zip code 11751 include: Iglesia Apostolica Fuente Del (A), Iglesia de Salvacion (B), New Beginnings Church (C), New Bethany Baptist Church (D), United Methodist Church of Islip (E), Trinity Lutheran Church (F), Saint Mark's Episcopal Church (G), Presbyterian Church of Islip (H). Display/hide their locations on the map
1,601 married couples with children.
223 single-parent households (34 men, 189 women).
88.4% of residents of 11751 zip code speak English at home.
6.8% of residents speak Spanish at home (54% very well, 16% well, 16% not well, 15% not at all).
2.5% of residents speak other Indo-European language at home (88% very well, 9% well, 3% not well).
1.8% of residents speak Asian or Pacific Island language at home (44% very well, 38% well, 15% not well, 3% not at all).
0.4% of residents speak other language at home (57% very well, 36% well, 7% not well).
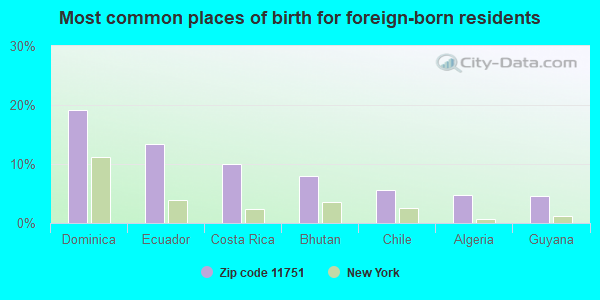
Foreign born population: 1,382 (10.4%) (59.2% of them are naturalized citizens)
This zip code:
10.4%
Whole state:
22.7%
19%Dominica
13%Ecuador
10%Costa Rica
8%Bhutan
6%Chile
5%Algeria
5%Guyana
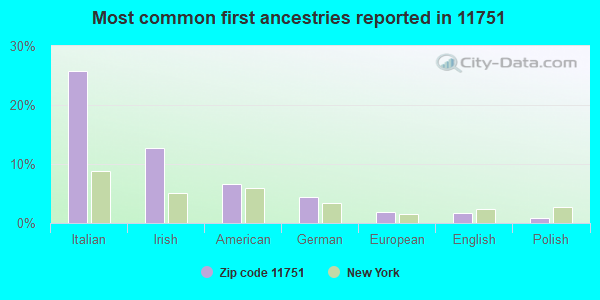
26%Italian
13%Irish
7%American
4%German
2%European
2%English
1%Polish
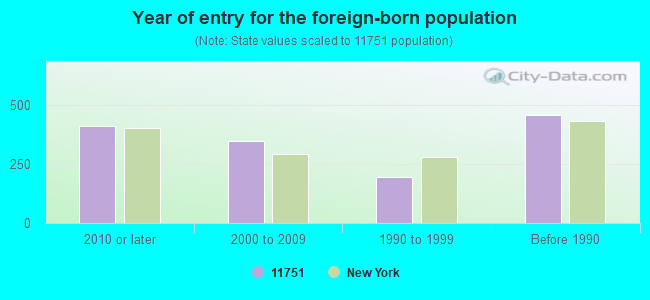
Year of entry for the foreign-born population
4112010 or later
3482000 to 2009
1941990 to 1999
459Before 1990
Major facilities with environmental interests located in this zip code:
ADVANCED INTERCONNECTION TECH INC (181 FREEMAN AVE., S/O SOUTHERN STATE PKWY. in ISLIP, NY)
STATE MASTER (New York facility tracking) - AIR PROGRAM, HAZARDOUS WASTE PROGRAM STATE MASTER (New York facility tracking) - AIR PROGRAM, HAZARDOUS WASTE BIENNIAL REPORTER (Resource Conservation and Recovery Act (tracking hazardous waste)) Large Quantity Generators, more that 1000 kg of hazardous waste/month (Resource Conservation and Recovery Act (tracking hazardous waste)) - notification Business SIC classification: ELECTRONIC COMPONENTS Business NAICS classification: ELECTRONIC CONNECTOR MANUFACTURING. Organizations: TIRS EAST LP (CONTACT/OPERATOR)
, JOSEPH P HAMMOND (CONTACT/OWNER)
, ADVANCED INTERCONNECTION TECHNOLOGY INC (LEGALLY RESPONSIBLE PARTY)
Alternative names: ADVANCED INTERCONNECTION TECH PROPERTY
BI COUNTY COLLISION (227 MAIN ST in ISLIP, NY)
AIR MINOR (AIRS/AFS) STATE MASTER (New York facility tracking) - AIR PROGRAM Conditionally Exempt Small Quantity Generators, less than 100 kg/month of hazardous waste (Resource Conservation and Recovery Act (tracking hazardous waste)) Business SIC classification: TOP, BODY, AND UPHOLSTERY REPAIR SHOPS AND PAINT SHOPS Business NAICS classification: AUTOMOTIVE BODY, PAINT, AND INTERIOR REPAIR AND MAINTENANCE. Organizations: BI COUNTY COLLISION INC, FRANK ZACCHEO (CONTACT/OPERATOR)
, PAUL DILL JR (CONTACT/OWNER)
Alternative names: BI COUNTY AUTO BODY INC.
ISLIP CLEANERS & TAILORS (464 MAIN ST in ISLIP, NY)
AIR MINOR (AIRS/AFS) STATE MASTER (New York facility tracking) - AIR PROGRAM Small Quantity Generators, between 100 kg and 1000 kg of hazardous waste/month (Resource Conservation and Recovery Act (tracking hazardous waste)) Business SIC classification: DRYCLEANING PLANTS, EXCEPT RUG CLEANING Business NAICS classification: DRYCLEANING AND LAUNDRY SERVICES (EXCEPT COIN-OPERATED). Organizations: BETTAONE INC (LEGALLY RESPONSIBLE PARTY)
GRINNELL LITHOGRAPHIC (265 MOFFIT BLVD. in ISLIP, NY)
STATE MASTER (New York facility tracking) - AIR PROGRAM, HAZARDOUS WASTE PROGRAM COMPLIANCE ACTIVITY (Tracking inspections of insecticide, fungicide, and rodenticide, and toxic substances) TRI REPORTER (Tracking of toxic chemicals releasing facilities) Business SIC classification: COMMERCIAL PRINTING, LITHOGRAPHIC; COMMERCIAL PRINTING, GRAVURE Organizations: GRINNELL LITHOGRAPHIC COMPANY INC (LEGALLY RESPONSIBLE PARTY)
Alternative names: GRINELL LITHOGRAPHIC CO, INC
BILL BOUCHER S AUTOBODY PROPERTY (350 MOFFITT BOULEVARD in ISLIP, NY)
STATE MASTER (New York facility tracking) - AIR PROGRAM, HAZARDOUS WASTE PROGRAM Small Quantity Generators, between 100 kg and 1000 kg of hazardous waste/month (Resource Conservation and Recovery Act (tracking hazardous waste)) - notification Organizations: WILLIAM J BOUCHER (CONTACT/OWNER)
, BILL BOUCHER S AUTOBODY INC (LEGALLY RESPONSIBLE PARTY)
Alternative names: BILL BOUCHERS AUTO BODY, BILL BOUCHER'S AUTOBODY INC
ALADDIN PACKAGING PROPERTY (40 RANICK RD in ISLIP, NY)
STATE MASTER (New York facility tracking) - AIR PROGRAM, AIR MAJOR CRITERIA AND HAZARDOUS AIR POLLUTANT INVENTORY (Inventory of air pollution sources) Business SIC classification: PACKAGING PAPER AND PLASTICS FILM, COATED AND LAMINATED; COMMERCIAL PRINTING Business NAICS classification: PLASTICS PACKAGING FILM AND SHEET (INCLUDING LAMINATED) MANUFACTURING. Organizations: BLEYER INDUSTRIES INC (LEGALLY RESPONSIBLE PARTY)
Alternative names: ALADDIN TRANSPARENT PACKAGING
GRINNELL LITHOGRAPHIC CO INC (185 GRANT AVE in ISLIP, NY)
(Integrated Compliance Information System) - ICIS-02-1989-0206, FORMAL ENFORCEMENT ACTION Small Quantity Generators, between 100 kg and 1000 kg of hazardous waste/month (Resource Conservation and Recovery Act (tracking hazardous waste)) Business SIC classification: COMMERCIAL PRINTING, LITHOGRAPHIC Business NAICS classification: COMMERCIAL LITHOGRAPHIC PRINTING.
ISLIP HS ( in ISLIP, NY)
(National Center for Education Statistics) - STATE ID-580502020001 Organizations: ISLIP UFSD (SCHOOL DISTRICT)
ISLIP K-1 CENTER ( in ISLIP, NY)
(National Center for Education Statistics) - STATE ID-580502020006 Organizations: ISLIP UFSD (SCHOOL DISTRICT)
ISLIP MS ( in ISLIP, NY)
(National Center for Education Statistics) - STATE ID-580502020004 Organizations: ISLIP UFSD (SCHOOL DISTRICT)
COMMACK ROAD ES ( in ISLIP, NY)
(National Center for Education Statistics) - STATE ID-580502020002 Organizations: ISLIP UFSD (SCHOOL DISTRICT)
ITS INSTRUMENT CORP (204 W MAIN ST in ISLIP, NY)
HAZARDOUS WASTE BIENNIAL REPORTER (Resource Conservation and Recovery Act (tracking hazardous waste)) Large Quantity Generators, more that 1000 kg of hazardous waste/month (Resource Conservation and Recovery Act (tracking hazardous waste)) - notification Organizations: ELFRIEDA COLLINS (CONTACT/OWNER)
Alternative names: ISLAND TECHNICAL SERVICE
74 CARLTON REALTY CORP (74 CARLTON AVE in ISLIP, NY)
Large Quantity Generators, more that 1000 kg of hazardous waste/month (Resource Conservation and Recovery Act (tracking hazardous waste)) - notification
Housing units lacking complete plumbing facilities: 0.4% Housing units lacking complete kitchen facilities: 1.0%
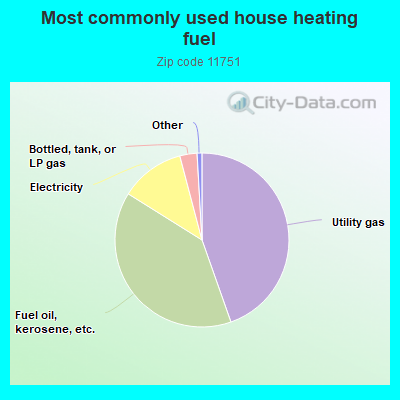
44.6%Utility gas
39.3%Fuel oil, kerosene, etc.
12.0%Electricity
3.2%Bottled, tank, or LP gas
Population in 1990: 21,721.
Place of birth for U.S.-born residents:
This state: 10,777
Northeast: 430
Midwest: 58
South: 518
West: 41
68% of the 11751 zip code residents lived in the same house 5 years ago. Out of people who lived in different houses, 82% lived in this county. Out of people who lived in different counties, 50% lived in New York.
90% of the 11751 zip code residents lived in the same house 1 year ago. Out of people who lived in different houses, 68% moved from this county. Out of people who lived in different houses, 7% moved from different county within same state. Out of people who lived in different houses, 19% moved from different state. Out of people who lived in different houses, 5% moved from abroad.
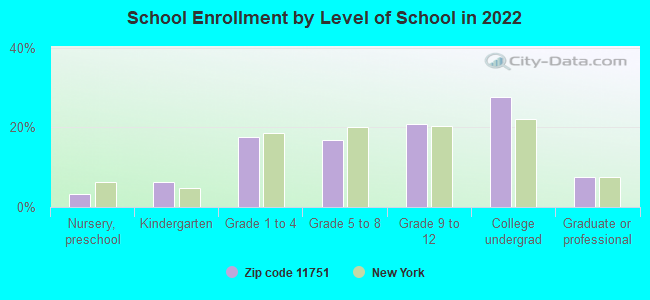
Private vs. public school enrollment:
Students in private schools in grades 1 to 8 (elementary and middle school): 43
Here:
5.1%
New York:
15.6%
Students in private schools in grades 9 to 12 (high school): 55
Here:
10.7%
New York:
15.0%
Students in private undergraduate colleges: 58
Here:
8.7%
New York:
39.2%
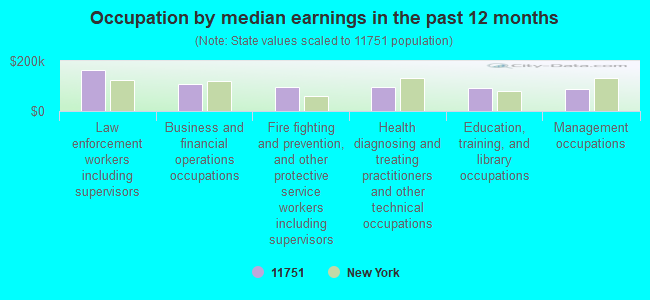
Occupation by median earnings in the past 12 months ($)
163,511Law enforcement workers including supervisors
107,379Business and financial operations occupations
96,787Fire fighting and prevention, and other protective service workers including supervisors
95,517Health diagnosing and treating practitioners and other technical occupations
91,415Education, training, and library occupations
88,128Management occupations
Companies with federal contracts located in this zip code:
I T S INSTRUMENT CORPORATION (204 MAIN ST in ISLIP, NY; small business) : $844,254 in 22 contractsfrom 2000 to 2006
Contracts for Cable, Cord, and Wire Assemblies: Communications Equipment, Electrical Control Equipment, Electrical and Electronic assemblies, Boards, Cards, and Associated Hardware, Guns, through 30 mm, and moreby Navy, Army, Defense Logistics Agency Signed by year:2000: $46,288; 2001: $0; 2002: $40,450; 2003: $176,490; 2004: $238,170; 2005: $230,311; 2006: $112,545.
Biggest contracts:
$176,490 with Navy for Cable, Cord, and Wire Assemblies: Communications Equipment. Signed on 2003-09-03. Completion date: 2005-11-11.
$147,960 with Army for Electrical Control Equipment. Signed on 2004-05-03. Completion date: 2004-12-31.
$97,210 with Navy for Cable, Cord, and Wire Assemblies: Communications Equipment. Signed on 2005-04-19. Completion date: 2005-08-09.
$66,225, same as above.Signed on 2006-02-14. Completion date: 2006-07-18.
SELECTRON MGMT CORP (3 BEECH STREET in ISLIP, NY; small business) : $488,629 in 24 contractsfrom 2002 to 2005
Contracts for Optical Sighting and Ranging Equipment, Optical Instruments, Test Equipment, Components and Accessories, Glass Fabricated Materials, ADPE System Configuration, and moreby Navy, Army, NASA Signed by year:2000: $0; 2001: $0; 2002: $51,992; 2003: $141,468; 2004: $295,419; 2005: -$250; 2006: $0.
Biggest contracts:
$248,600 with Navy for Optical Sighting and Ranging Equipment. Signed on 2004-01-29. Completion date: 2004-04-30.
$83,800, same as above.Signed on 2003-07-22. Completion date: 2003-10-27.
$42,240, same as above.Signed on 2002-12-05. Completion date: 2003-02-20.
$31,913 with Army for Optical Instruments, Test Equipment, Components and Accessories. Signed on 2003-03-24. Completion date: 2003-08-31.
SELECTRON INTERNATIONAL OPTRON (3 BEECH ST in ISLIP, NY; small business) : $417,110 in 21 contractsfrom 2004 to 2006
Contracts for Electrical and Electronic Properties Measuring and Testing Instruments, Night Vision Equipment, Emitted and Reflected Radiation, Optical Instruments, Test Equipment, Components and Accessories, Optical Sighting and Ranging Equipment, and moreby Navy, Defense Logistics Agency, Army Signed by year:2000: $0; 2001: $0; 2002: $0; 2003: $0; 2004: $204,797; 2005: $209,013; 2006: $3,300.
Biggest contracts:
$88,400 with Navy for Electrical and Electronic Properties Measuring and Testing Instruments. Signed on 2005-05-03. Completion date: 2005-09-30.
$58,800 with Defense Logistics Agency for Night Vision Equipment, Emitted and Reflected Radiation. Signed on 2005-10-28. Completion date: 2006-04-26.
$52,141, same as above.Signed on 2004-09-21. Completion date: 2005-01-19.
$29,850 with Navy for Optical Instruments, Test Equipment, Components and Accessories. Signed on 2004-12-01. Completion date: 2005-05-03.
Top industries in this zip code by the number of employees in 2005:
Professional, Scientific, and Technical Services: Computer Systems Design Services (100-249 employees: 1 establishment, 1-4 employees: 3 establishments)
Administrative and Support and Waste Management and Remediation Services: Security Guards and Patrol Services (100-249: 1, 1-4: 1)
2003 - 2018 National Fire Incident Reporting System (NFIRS) incidents
Based on the data from the years 2003 - 2018 the average number of fire incidents per year is 7. The highest number of reported fire incidents - 24 took place in 2003, and the least - 0 in 2007. The data has a decreasing trend.
When looking into fire subcategories, the most reports belonged to: Structure Fires (73.9%), and Outside Fires (15.7%).
Fire incident types reported to NFIRS in Zip Code 11751


 Nearest zip codes: 11706, 11730, 11752, 11718, 11739, 11722.


 Based on the data from the years 2003 - 2018 the average number of fire incidents per year is 7. The highest number of reported fire incidents - 24 took place in 2003, and the least - 0 in 2007. The data has a decreasing trend.
 When looking into fire subcategories, the most reports belonged to: Structure Fires (73.9%), and Outside Fires (15.7%).