Estimated zip code population in 2022: 13,943 Zip code population in 2010: 14,712 Zip code population in 2000: 16,050
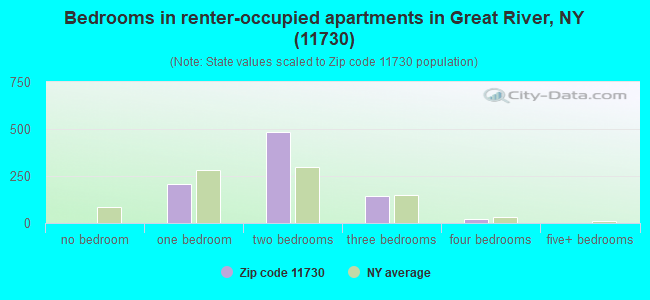
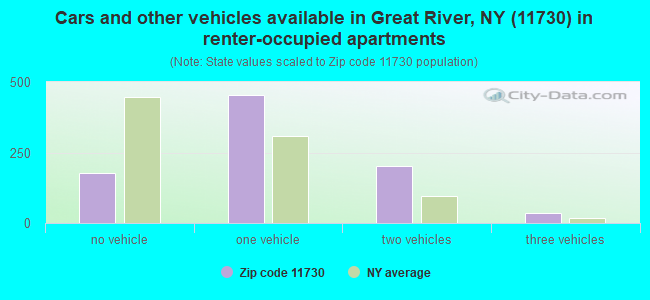
Houses and condos: 5,277 Renter-occupied apartments: 870
% of renters here:
17%
State:
46%
March 2022 cost of living index in zip code 11730: 149.9 (very high, U.S. average is 100)
Land area: 7.6 sq. mi. Water area: 1.7 sq. mi.
Population density: 1,826 people per square mile
(low).
OSM Map
General Map
Google Map
MSN Map
OSM Map
General Map
Google Map
MSN Map
OSM Map
General Map
Google Map
MSN Map
OSM Map
General Map
Google Map
MSN Map
Please wait while loading the map...
Real estate property taxes paid for housing units in 2022:
This zip code:
1.7% ($9,805)
New York:
1.5% ($6,180)
Median real estate property taxes paid for housing units with mortgages in 2022: $9,858 (1.7%) Median real estate property taxes paid for housing units with no mortgage in 2022: $9,755 (1.8%)
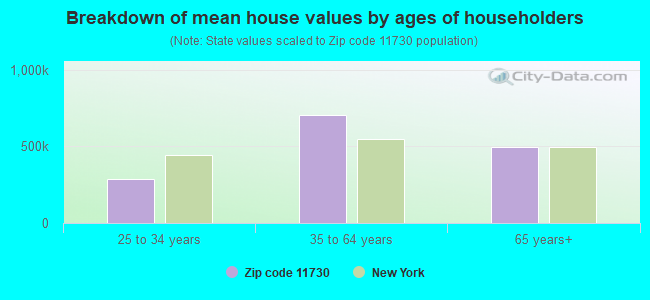
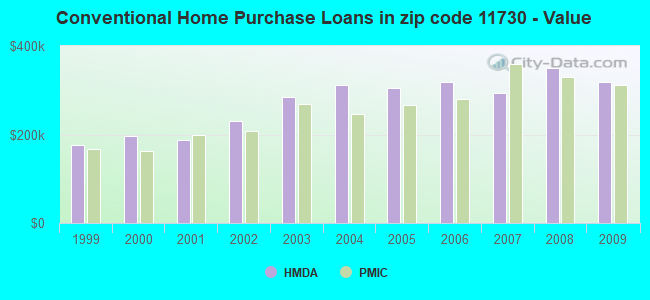
Estimated median house/condo value in 2022: $565,209
11730:
$565,209
New York:
$400,400
According to our research of New York and other state lists, there were 6 registered sex offenders living in 11730 zip code as of April 27, 2024. The ratio of all residents to sex offenders in zip code 11730 is 2,395 to 1. The ratio of registered sex offenders to all residents in this zip code is much lower than the state average.
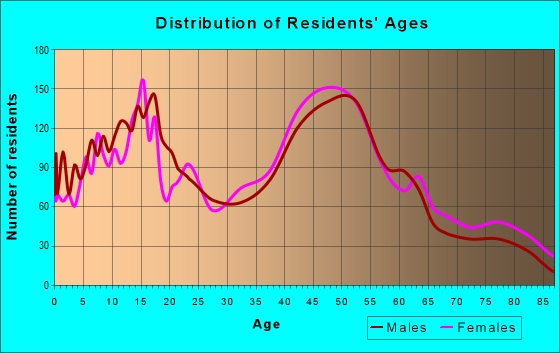
Median resident age:
This zip code:
43.2 years
New York median age:
40.0 years
Average household size:
This zip code:
2.7 people
New York:
2.5 people
Averages for the 2020 tax year for zip code 11730, filed in 2021:
Average Adjusted Gross Income (AGI) in 2020: $105,809 (Individual Income Tax Returns)
Here:
$105,809
State:
$90,930
Salary/wage: $89,411 (reported on 83.1% of returns)
Here:
$89,411
State:
$72,104
(% of AGI for various income ranges: 1174.3% for AGIs below $25k, 3480.6% for AGIs $25k-50k, 6435.2% for AGIs $50k-75k, 9945.5% for AGIs $75k-100k, 18028.8% for AGIs $100k-200k, 67698.2% for AGIs over 200k)
Taxable interest for individuals: $1,449 (reported on 50.1% of returns)
This zip code:
$1,449
New York:
$3,075
(% of AGI for various income ranges: 30.6% for AGIs below $25k, 34.9% for AGIs $25k-50k, 63.3% for AGIs $50k-75k, 85.3% for AGIs $75k-100k, 101.4% for AGIs $100k-200k, 871.8% for AGIs over 200k)
Ordinary dividends: $4,481 (reported on 28.6% of returns)
Here:
$4,481
State:
$11,095
(% of AGI for various income ranges: 36.0% for AGIs below $25k, 65.9% for AGIs $25k-50k, 68.9% for AGIs $50k-75k, 135.5% for AGIs $75k-100k, 180.9% for AGIs $100k-200k, 1697.4% for AGIs over 200k)
Net capital gain/loss in AGI: +$15,425 (reported on 25.8% of returns)
Here:
+$15,425
State:
+$44,925
(% of AGI for various income ranges: 31.7% for AGIs below $25k, 41.7% for AGIs $25k-50k, 56.3% for AGIs $50k-75k, 118.5% for AGIs $75k-100k, 336.1% for AGIs $100k-200k, 7652.6% for AGIs over 200k)
Profit/loss from business: +$17,000 (reported on 12.7% of returns)
Here:
+$17,000
State:
+$14,940
(% of AGI for various income ranges: 71.7% for AGIs below $25k, 117.7% for AGIs $25k-50k, 169.6% for AGIs $50k-75k, 217.7% for AGIs $75k-100k, 379.8% for AGIs $100k-200k, 2424.1% for AGIs over 200k)
Taxable individual retirement arrangement distribution: $17,291 (reported on 10.0% of returns)
11730:
$17,291
New York:
$19,609
(% of AGI for various income ranges: 64.0% for AGIs below $25k, 123.5% for AGIs $25k-50k, 177.3% for AGIs $50k-75k, 290.6% for AGIs $75k-100k, 421.6% for AGIs $100k-200k, 1175.6% for AGIs over 200k)
Self-employed (Keogh) retirement plans: $24,580 (reported on 0.6% of returns)
11730:
$24,580
New York:
$32,497
(% of AGI for various income ranges: 361.5% for AGIs over 200k)
Total itemized deductions: $27,907 (reported on 19.0% of returns)
Here:
$27,907
State:
$39,326
(% of AGI for various income ranges: 135.3% for AGIs below $25k, 241.1% for AGIs $25k-50k, 474.1% for AGIs $50k-75k, 851.3% for AGIs $75k-100k, 1364.7% for AGIs $100k-200k, 4199.4% for AGIs over 200k)
Charity contributions: $4,540 (reported on 17.3% of returns)
Here:
$4,540
State:
$15,420
(% of AGI for various income ranges: 5.5% for AGIs below $25k, 19.0% for AGIs $25k-50k, 35.6% for AGIs $50k-75k, 100.6% for AGIs $75k-100k, 171.7% for AGIs $100k-200k, 940.0% for AGIs over 200k)
Taxes paid: $9,466 (reported on 18.9% of returns)
11730:
$9,466
State:
$9,183
(% of AGI for various income ranges: 40.5% for AGIs below $25k, 77.8% for AGIs $25k-50k, 174.1% for AGIs $50k-75k, 345.1% for AGIs $75k-100k, 511.6% for AGIs $100k-200k, 1140.6% for AGIs over 200k)
Earned income credit: $1,581 (reported on 5.4% of returns)
Here:
$1,581
State:
$2,138
(% of AGI for various income ranges: 32.8% for AGIs below $25k, 31.4% for AGIs $25k-50k)
Percentage of individuals using paid preparers for their 2020 taxes: 95.4%
Here:
95%
State:
95%
(% for various income ranges: 93.9% for AGIs below $25k, 94.2% for AGIs $25k-50k, 95.5% for AGIs $50k-75k, 95.2% for AGIs $75k-100k, 96.9% for AGIs $100k-200k, 96.7% for AGIs over 200k)
Averages for the 2012 tax year for zip code 11730, filed in 2013:
Average Adjusted Gross Income (AGI) in 2012: $88,621 (Individual Income Tax Returns)
Here:
$88,621
State:
$77,088
Salary/wage: $73,883 (reported on 85.0% of returns)
Here:
$73,883
State:
$60,593
(% of AGI for various income ranges: 72.3% for AGIs below $25k, 76.0% for AGIs $25k-50k, 74.7% for AGIs $50k-75k, 72.7% for AGIs $75k-100k, 82.2% for AGIs $100k-200k, 56.2% for AGIs over 200k)
Taxable interest for individuals: $1,575 (reported on 56.0% of returns)
This zip code:
$1,575
New York:
$3,125
(% of AGI for various income ranges: 1.5% for AGIs below $25k, 0.9% for AGIs $25k-50k, 0.6% for AGIs $50k-75k, 0.9% for AGIs $75k-100k, 0.4% for AGIs $100k-200k, 1.7% for AGIs over 200k)
Ordinary dividends: $4,480 (reported on 28.6% of returns)
Here:
$4,480
State:
$10,299
(% of AGI for various income ranges: 1.6% for AGIs below $25k, 1.2% for AGIs $25k-50k, 1.2% for AGIs $50k-75k, 1.2% for AGIs $75k-100k, 0.8% for AGIs $100k-200k, 2.3% for AGIs over 200k)
Net capital gain/loss in AGI: +$23,388 (reported on 21.5% of returns)
Here:
+$23,388
State:
+$42,474
(% of AGI for various income ranges: 0.2% for AGIs $25k-50k, 0.4% for AGIs $50k-75k, 0.2% for AGIs $75k-100k, 0.4% for AGIs $100k-200k, 16.0% for AGIs over 200k)
Profit/loss from business: +$13,102 (reported on 12.6% of returns)
Here:
+$13,102
State:
+$16,168
(% of AGI for various income ranges: 5.1% for AGIs below $25k, 3.1% for AGIs $25k-50k, 2.2% for AGIs $50k-75k, 1.8% for AGIs $75k-100k, 1.5% for AGIs $100k-200k, 1.5% for AGIs over 200k)
Taxable individual retirement arrangement distribution: $14,339 (reported on 10.9% of returns)
11730:
$14,339
New York:
$17,621
(% of AGI for various income ranges: 3.5% for AGIs below $25k, 2.2% for AGIs $25k-50k, 2.5% for AGIs $50k-75k, 2.9% for AGIs $75k-100k, 1.8% for AGIs $100k-200k, 0.9% for AGIs over 200k)
Self-employment retirement plans: $24,340 (reported on 0.7% of returns)
11730:
$24,340
New York:
$27,330
Total itemized deductions: $33,272 (24% of AGI, reported on 54.6% of returns)
Here:
$33,272
State:
$34,985
Here:
23.8% of AGI
State:
21.3% of AGI
(% of AGI for various income ranges: 18.0% for AGIs below $25k, 17.7% for AGIs $25k-50k, 21.1% for AGIs $50k-75k, 23.1% for AGIs $75k-100k, 22.9% for AGIs $100k-200k, 17.9% for AGIs over 200k)
Charity contributions: $2,780 (reported on 50.6% of returns)
Here:
$2,780
State:
$5,572
(% of AGI for various income ranges: 0.9% for AGIs below $25k, 1.2% for AGIs $25k-50k, 1.7% for AGIs $50k-75k, 1.9% for AGIs $75k-100k, 1.7% for AGIs $100k-200k, 1.5% for AGIs over 200k)
Taxes paid: $17,902 (reported on 54.5% of returns)
11730:
$17,902
State:
$18,656
(% of AGI for various income ranges: 7.7% for AGIs below $25k, 8.4% for AGIs $25k-50k, 10.3% for AGIs $50k-75k, 11.8% for AGIs $75k-100k, 12.1% for AGIs $100k-200k, 10.7% for AGIs over 200k)
Earned income credit: $1,700 (reported on 7.0% of returns)
Here:
$1,700
State:
$2,230
(% of AGI for various income ranges: 2.6% for AGIs below $25k, 0.5% for AGIs $25k-50k)
Percentage of individuals using paid preparers for their 2012 taxes: 71.2%
Here:
71%
State:
66%
(% for various income ranges: 61.3% for AGIs below $25k, 65.8% for AGIs $25k-50k, 72.9% for AGIs $50k-75k, 77.9% for AGIs $75k-100k, 80.0% for AGIs $100k-200k, 85.4% for AGIs over 200k)
Averages for the 2004 tax year for zip code 11730, filed in 2005:
Average Adjusted Gross Income (AGI) in 2004: $69,782 (Individual Income Tax Returns)
Here:
$69,782
State:
$59,519
Salary/wage: $62,069 (reported on 84.8% of returns)
Here:
$62,069
State:
$50,673
(% of AGI for various income ranges: 102.5% for AGIs below $10k, 66.4% for AGIs $10k-25k, 78.3% for AGIs $25k-50k, 77.5% for AGIs $50k-75k, 82.6% for AGIs $75k-100k, 72.5% for AGIs over 100k)
Taxable interest for individuals: $1,674 (reported on 68.8% of returns)
This zip code:
$1,674
New York:
$2,377
(% of AGI for various income ranges: 9.8% for AGIs below $10k, 3.6% for AGIs $10k-25k, 1.4% for AGIs $25k-50k, 1.1% for AGIs $50k-75k, 0.7% for AGIs $75k-100k, 1.9% for AGIs over 100k)
Taxable dividends: $2,722 (reported on 33.9% of returns)
Here:
$2,722
State:
$5,394
(% of AGI for various income ranges: 8.0% for AGIs below $10k, 2.1% for AGIs $10k-25k, 1.3% for AGIs $25k-50k, 0.7% for AGIs $50k-75k, 0.8% for AGIs $75k-100k, 1.5% for AGIs over 100k)
Net capital gain/loss: +$5,311 (reported on 26.4% of returns)
Here:
+$5,311
State:
+$23,581
(% of AGI for various income ranges: -3.3% for AGIs below $10k, -0.1% for AGIs $10k-25k, 0.2% for AGIs $25k-50k, 0.5% for AGIs $50k-75k, 1.1% for AGIs $75k-100k, 3.2% for AGIs over 100k)
Profit/loss from business: +$16,828 (reported on 13.0% of returns)
Here:
+$16,828
State:
+$13,809
(% of AGI for various income ranges: 12.3% for AGIs below $10k, 5.4% for AGIs $10k-25k, 3.4% for AGIs $25k-50k, 3.3% for AGIs $50k-75k, 2.7% for AGIs $75k-100k, 2.9% for AGIs over 100k)
IRA payment deduction: $3,399 (reported on 4.0% of returns)
11730:
$3,399
New York:
$3,115
(% of AGI for various income ranges: 0.8% for AGIs below $10k, 0.4% for AGIs $10k-25k, 0.3% for AGIs $25k-50k, 0.3% for AGIs $50k-75k, 0.2% for AGIs $75k-100k, 0.1% for AGIs over 100k)
Self-employed pension: $14,986 (reported on 1.1% of returns)
Here:
$14,986
New York:
$19,016
(% of AGI for various income ranges: 0.2% for AGIs $50k-75k, 0.1% for AGIs $75k-100k, 0.3% for AGIs over 100k)
Total itemized deductions: $26,121 (25% of AGI, reported on 57.3% of returns)
Here:
$26,121
State:
$25,864
Here:
25.0% of AGI
State:
21.9% of AGI
(% of AGI for various income ranges: 21.0% for AGIs below $10k, 17.8% for AGIs $10k-25k, 20.6% for AGIs $25k-50k, 24.1% for AGIs $50k-75k, 25.3% for AGIs $75k-100k, 20.1% for AGIs over 100k)
Charity contributions deductions: $3,020 (3% of AGI, reported on 54.7% of returns)
Here:
$3,020
State:
$4,439
Here:
2.8% of AGI
State:
3.6% of AGI
(% of AGI for various income ranges: 1.0% for AGIs below $10k, 1.5% for AGIs $10k-25k, 2.1% for AGIs $25k-50k, 2.4% for AGIs $50k-75k, 2.6% for AGIs $75k-100k, 2.4% for AGIs over 100k)
Total tax: $11,208 (reported on 83.0% of returns)
11730:
$11,208
State:
$11,730
(% of AGI for various income ranges: 4.1% for AGIs below $10k, 4.3% for AGIs $10k-25k, 7.3% for AGIs $25k-50k, 8.5% for AGIs $50k-75k, 8.9% for AGIs $75k-100k, 17.7% for AGIs over 100k)
Earned income credit: $1,352 (reported on 5.2% of returns)
Here:
$1,352
State:
$1,757
Percentage of individuals using paid preparers for their 2004 taxes: 70.9%
Here:
71%
State:
67%
(% for various income ranges: 57.4% for AGIs below $10k, 65.5% for AGIs $10k-25k, 68.6% for AGIs $25k-50k, 74.5% for AGIs $50k-75k, 79.8% for AGIs $75k-100k, 79.4% for AGIs over 100k)
Household received Food Stamps/SNAP in the past 12 months: 151 Household did not receive Food Stamps/SNAP in the past 12 months: 4,956
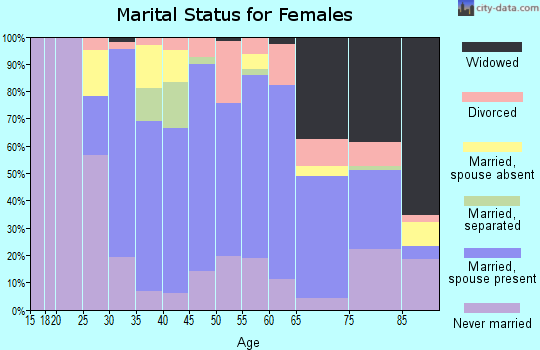
Women who had a birth in the past 12 months: 67 (66 now married, 0 unmarried) Women who did not have a birth in the past 12 months: 2,668 (1,040 now married, 1,624 unmarried)
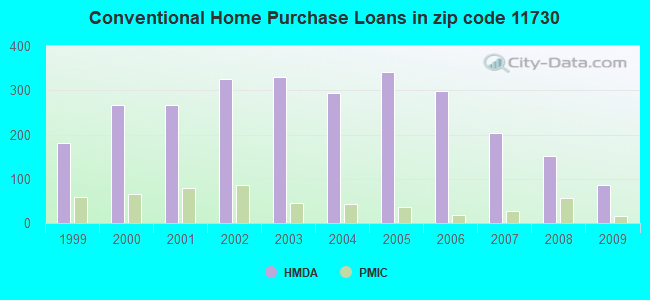
Housing units in zip code 11730 with a mortgage: 2,918 (317 second mortgage, 305 both second mortgage and home equity loan) Houses without a mortgage: 79
Median monthly owner costs for units with a mortgage: $3,163 Median monthly owner costs for units without a mortgage: $1,329
Residents with income below the poverty level in 2022:
This zip code:
3.9%
Whole state:
14.3%
Residents with income below 50% of the poverty level in 2022:
This zip code:
1.1%
Whole state:
6.8%
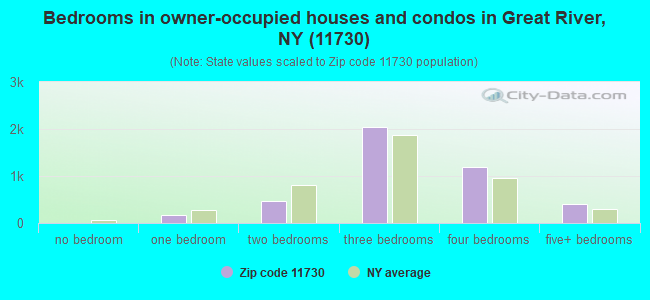
Median number of rooms in houses and condos:
Here:
6.9
State:
6.3
Median number of rooms in apartments:
Here:
4.2
State:
3.8
Notable locations in this zip code not listed on our city pages
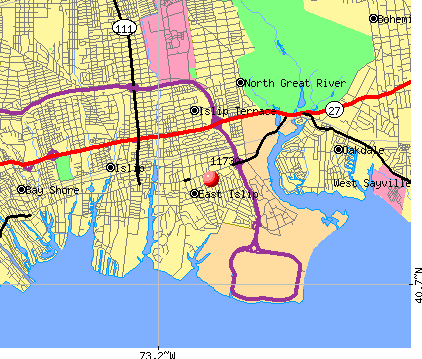
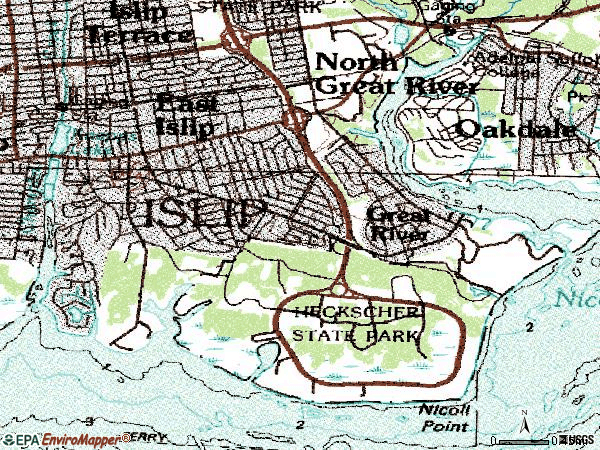
Notable locations in zip code 11730: Timber Point Country Club (A), East Islip Marina (B), Great River Station (C), Sunrise Business Center (D), Brookwood Hall (E), East Islip Public Library (F), East Islip Fire Department (G), Islip Art Museum (H), Bayway Arts Center (I), Little Flower for Rehabilitation and Nursing (J). Display/hide their locations on the map
Churches in zip code 11730 include: Saint Stephens Anglican Church (A), Saint Mary's Roman Catholic Church (B), Christian Reformed Church (C). Display/hide their locations on the map
Parks in zip code 11730 include: Islip Meadows County Nature Preserve (1), Brookwood Hall Park (2), Heckscher State Park (3). Display/hide their locations on the map
In group quarters: 137 (-1 institutionalized population)
Size of family households: 1,224 2-persons, 783 3-persons, 899 4-persons, 424 5-persons, 80 6-persons, 33 7-or-more-persons
Size of nonfamily households: 1,406 1-person, 301 2-persons, 6 3-persons
2,103 married couples with children.
452 single-parent households (165 men, 287 women).
84.5% of residents of 11730 zip code speak English at home.
10.9% of residents speak Spanish at home (85% very well, 12% well, 3% not well).
1.1% of residents speak other Indo-European language at home (51% very well, 49% well).
2.1% of residents speak Asian or Pacific Island language at home (90% very well, 10% well).
1.4% of residents speak other language at home (70% very well, 19% well, 11% not well).
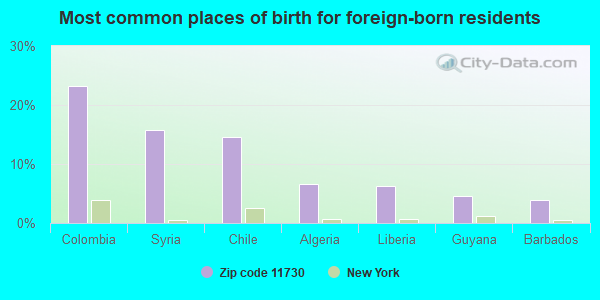
Foreign born population: 1,108 (8.0%) (79.2% of them are naturalized citizens)
This zip code:
8.0%
Whole state:
22.7%
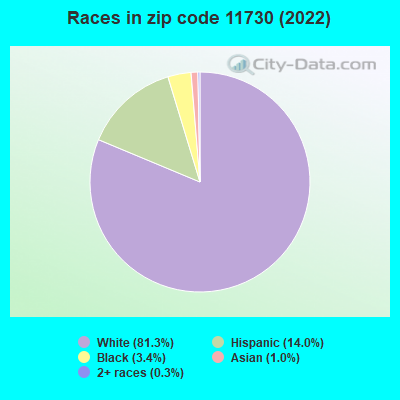
23%Colombia
16%Syria
15%Chile
7%Algeria
6%Liberia
5%Guyana
4%Barbados
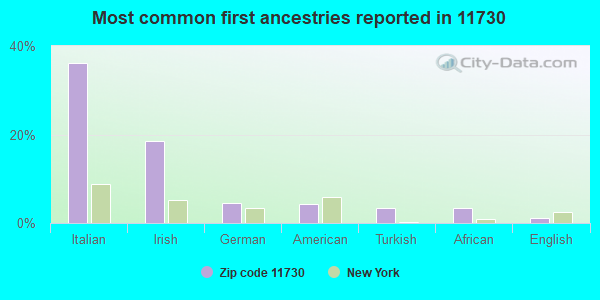
36%Italian
19%Irish
4%German
4%American
3%Turkish
3%African
1%English
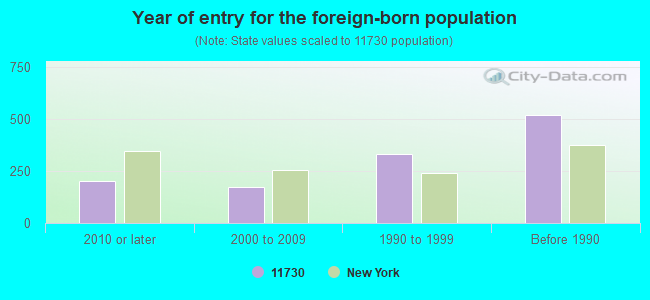
Year of entry for the foreign-born population
2012010 or later
1712000 to 2009
3301990 to 1999
519Before 1990
Facilities with environmental interests located in this zip code:
CONCORD CLEANERS (176 E MAIN ST in E ISLIP, NY)
AIR MINOR (AIRS/AFS) STATE MASTER (New York facility tracking) - AIR PROGRAM Small Quantity Generators, between 100 kg and 1000 kg of hazardous waste/month (Resource Conservation and Recovery Act (tracking hazardous waste)) Business SIC classification: DRYCLEANING PLANTS, EXCEPT RUG CLEANING Business NAICS classification: DRYCLEANING AND LAUNDRY SERVICES (EXCEPT COIN-OPERATED).
GETTY PETROLEUM CORP (MONTAUK HWY & CARLETON AVE in EAST ISLIP, NY)
(Resource Conservation and Recovery Act (tracking hazardous waste))
ISLIPTOWN RIFLE & PISTOL CLUB (FREEMAN AVE in EAST ISLIP, NY)
(Resource Conservation and Recovery Act (tracking hazardous waste))
ANIMAL HOSPITAL OF EAST ISLIP THE (84 E MAIN ST in EAST ISLIP, NY)
(Resource Conservation and Recovery Act (tracking hazardous waste))
ISLIP TOWN OF VEHICLE REPAIR (100 CARLETON AVE in EAST ISLIP, NY)
(Resource Conservation and Recovery Act (tracking hazardous waste))
HEWLETT SCHOOL OF EAST ISLIP (74 SUFFOLK LANE in E ISLIP, NY)
COMPLIANCE ACTIVITY (Tracking inspections of insecticide, fungicide, and rodenticide, and toxic substances)
Housing units lacking complete plumbing facilities: 1.3% Housing units lacking complete kitchen facilities: 1.3%
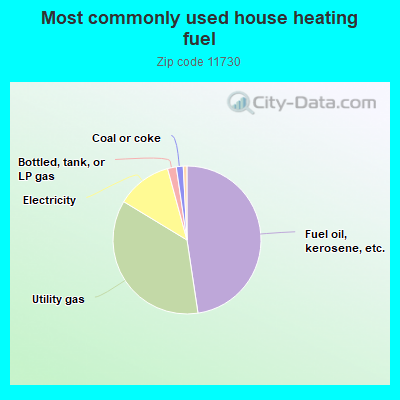
47.3%Fuel oil, kerosene, etc.
35.8%Utility gas
12.0%Electricity
1.9%Bottled, tank, or LP gas
1.5%Coal or coke
0.8%Other fuel
Population in 1990: 15,777. Population change in the 1990s: +273 (+1.7%).
Place of birth for U.S.-born residents:
This state: 12,081
Northeast: 163
Midwest: 93
South: 170
West: 138
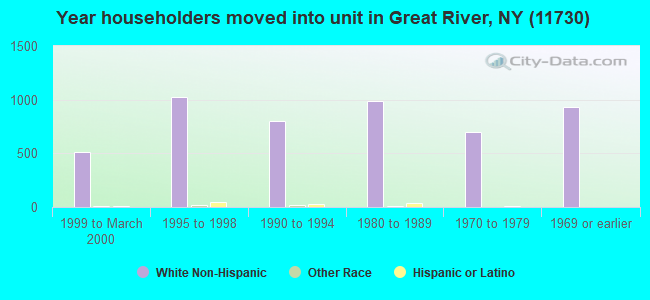
70% of the 11730 zip code residents lived in the same house 5 years ago. Out of people who lived in different houses, 80% lived in this county. Out of people who lived in different counties, 50% lived in New York.
92% of the 11730 zip code residents lived in the same house 1 year ago. Out of people who lived in different houses, 54% moved from this county. Out of people who lived in different houses, 43% moved from different county within same state. Out of people who lived in different houses, 1% moved from different state.
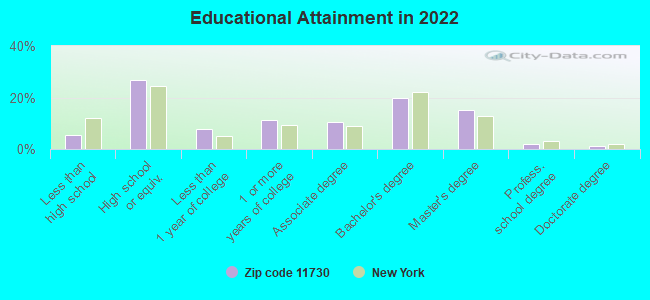
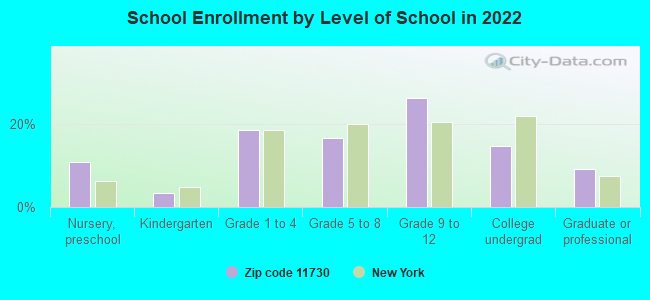
Private vs. public school enrollment:
Students in private schools in grades 1 to 8 (elementary and middle school): 155
Here:
14.1%
New York:
15.6%
Students in private schools in grades 9 to 12 (high school): 50
Here:
6.0%
New York:
15.0%
Students in private undergraduate colleges: 211
Here:
45.0%
New York:
39.2%
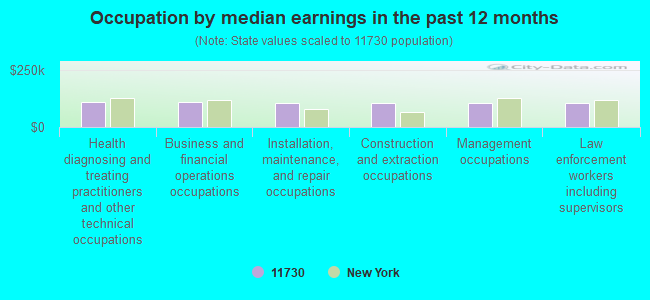
Occupation by median earnings in the past 12 months ($)
111,139Health diagnosing and treating practitioners and other technical occupations
110,380Business and financial operations occupations
105,923Installation, maintenance, and repair occupations
105,643Construction and extraction occupations
105,457Management occupations
104,283Law enforcement workers including supervisors
Companies with federal contracts located in this zip code:
DIMENSIONS UNLIMITED GROUP, IN (100 W MAIN UNIT 2 in EAST ISLIP, NY; small business) : $815,693 in 50 contractsfrom 2004 to 2006
Contracts for Aircraft Hydraulic, Vacuum, and De-icing System Components, Bearings, Antifriction, Unmounted, Engine Instruments, Engine Fuel System Components, Aircraft and Missile Prime Movers, and moreby Air Force, Navy Signed by year:2000: $0; 2001: $0; 2002: $0; 2003: $0; 2004: $200,260; 2005: $265,700; 2006: $349,733.
Biggest contracts:
$99,944 with Air Force for Aircraft Hydraulic, Vacuum, and De-icing System Components. Signed on 2006-05-08. Completion date: 2006-06-09.
$69,961, same as above.Signed on 2006-05-10. Completion date: 2006-05-24.
$65,561 with Air Force for Bearings, Antifriction, Unmounted. Signed on 2005-01-20. Completion date: 2005-01-31.
$44,036 with Air Force for Aircraft Hydraulic, Vacuum, and De-icing System Components. Signed on 2006-02-24. Completion date: 2006-03-24.
Top industries in this zip code by the number of employees in 2005:
Professional, Scientific, and Technical Services: Marketing Research and Public Opinion Polling (250-499 employees: 1 establishment)
2002 - 2018 National Fire Incident Reporting System (NFIRS) incidents
According to the data from the years 2002 - 2018 the average number of fire incidents per year is 15. The highest number of reported fire incidents - 28 took place in 2011, and the least - 0 in 2010. The data has a declining trend.
When looking into fire subcategories, the most reports belonged to: Structure Fires (50.6%), and Outside Fires (33.7%).
Fire incident types reported to NFIRS in Zip Code 11730


 Nearest zip codes: 11739, 11752, 11769, 11751, 11716, 11722.
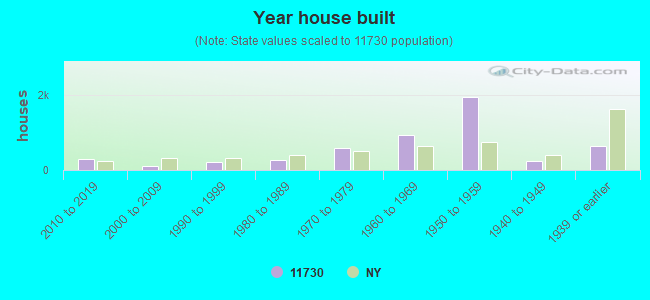


 According to the data from the years 2002 - 2018 the average number of fire incidents per year is 15. The highest number of reported fire incidents - 28 took place in 2011, and the least - 0 in 2010. The data has a declining trend.
 When looking into fire subcategories, the most reports belonged to: Structure Fires (50.6%), and Outside Fires (33.7%).