Races in Kenmore, New York (NY) Detailed Stats
Ancestries, Foreign-born residents, place of birth
Settings
X


Recent posts about races in Kenmore, New York on our local forum with over 2,400,000 registered users:
 | Erie County and the Buffalo metro area grew according to 2020 Census information (37 replies) |
| Good Pubs, Restaurants, Ethnic Food in Kenmore (2 replies) |
| Half of Buffalo’s population and businesses gone? No. (81 replies) |
| What do you think the chances are of a Metro Rail Extension? (85 replies) |
| What is this about? (18 replies) |
| Moving to Buffalo? (137 replies) |
Latest news about races in Kenmore, NY collected exclusively by city-data.com from local newspapers, TV, and radio stations
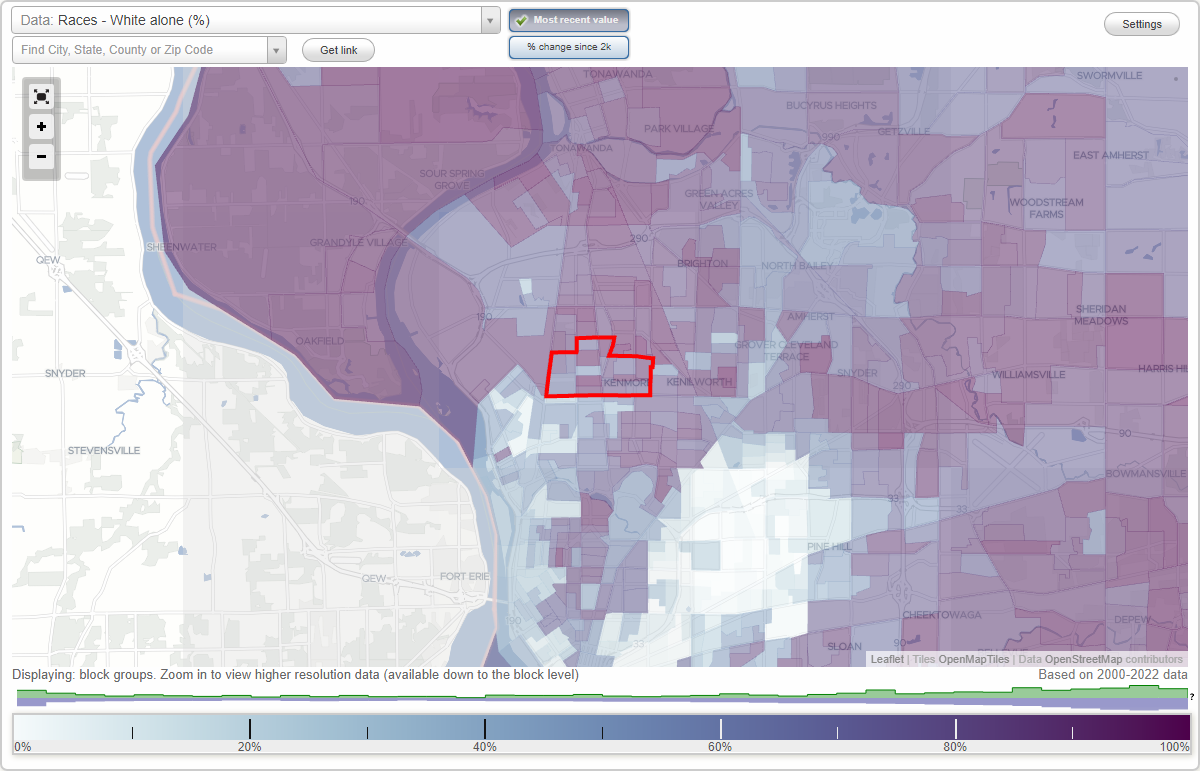
According to 2022 data, the most numerous races in Kenmore, NY are White alone (11,853 residents), Hispanic (935 residents), and Black alone (986 residents). 94.2% of Kenmore residents speak English at home. 3.1% of Kenmore, NY residents are foreign-born (1.1% born in Asia, 0.7% born in North America, 0.5% born in Europe, 0.4% born in Africa, 0.4% born in Latin America), which is 604.2% less than the foreign-born rate of 22.0% across the entire state of New York.
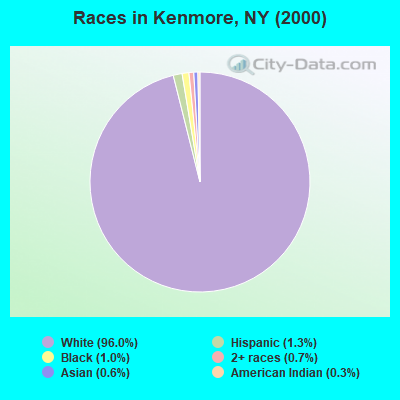
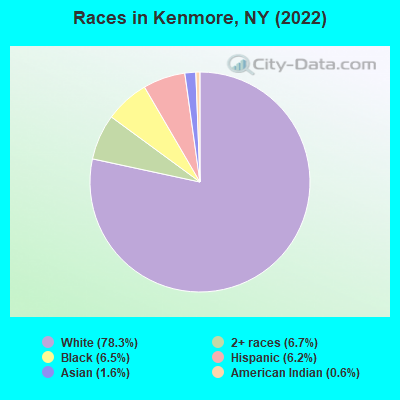
Race distribution in Kenmore
2000
2022

- 15,76996.0%White alone
- 2131.3%Hispanic
- 1591.0%Black alone
- 1220.7%Two or more races
- 950.6%Asian alone
- 540.3%American Indian alone
- 80.05%Other race alone
- 60.04%Native Hawaiian and Other
Pacific Islander alone
-
- 11,85378.3%White alone
- 1,0096.7%Two or more races
- 9866.5%Black alone
- 9356.2%Hispanic
- 2381.6%Asian alone
- 870.6%American Indian alone
- 90.06%Other race alone
2000
2022
-
- 11,760,98162.0%White alone
- 2,867,58315.1%Hispanic
- 2,812,62314.8%Black alone
- 1,035,9265.5%Asian alone
- 366,1161.9%Two or more races
- 75,4990.4%Other race alone
- 52,4990.3%American Indian alone
- 5,2300.03%Native Hawaiian and Other
Pacific Islander alone

-
- 10,408,93352.9%White alone
- 3,867,29919.7%Hispanic
- 2,633,84013.4%Black alone
- 1,776,2869.0%Asian alone
- 732,6703.7%Two or more races
- 216,1101.1%Other race alone
- 35,0820.2%American Indian alone
- 6,9310.04%Native Hawaiian and Other
Pacific Islander alone

Income and house value in Kenmore
- Median household income in 2022
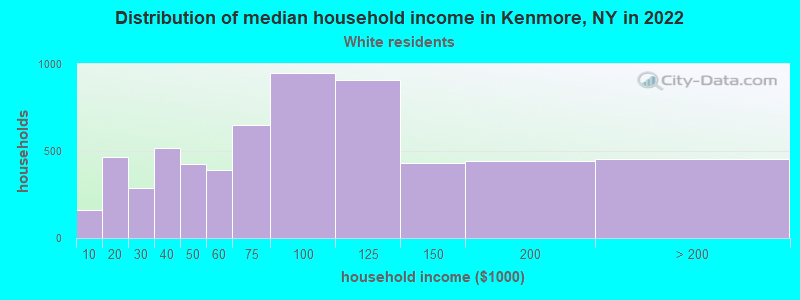
- $78,934White non-Hispanic householders
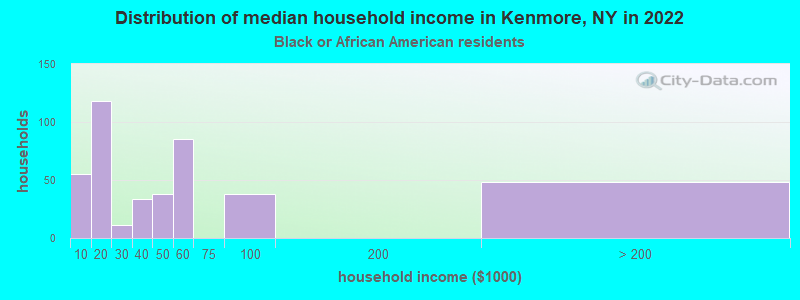
- $36,220Black householders
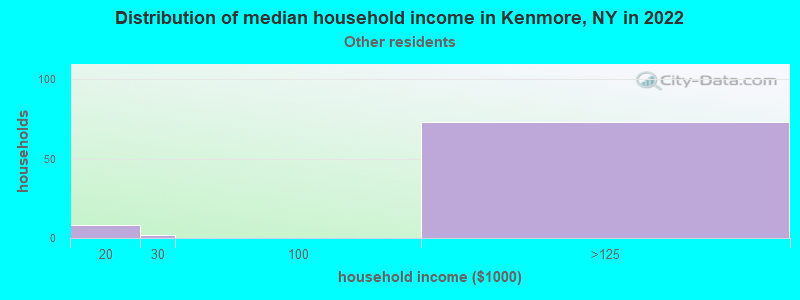
- over $200,000Some other race householders
- $101,370Two or more races householders
- $99,303Hispanic or Latino race householders
- Median 2022 house value
- $202,238White Non-Hispanic householders
- $186,566Black or African American householders
- $128,606American Indian or Alaska Native householders
- $202,736Some other race householders
- $225,372Two or more races householders
- $211,442Hispanic or Latino householders
Household income for White non-Hispanic householders
Household income for Black householders
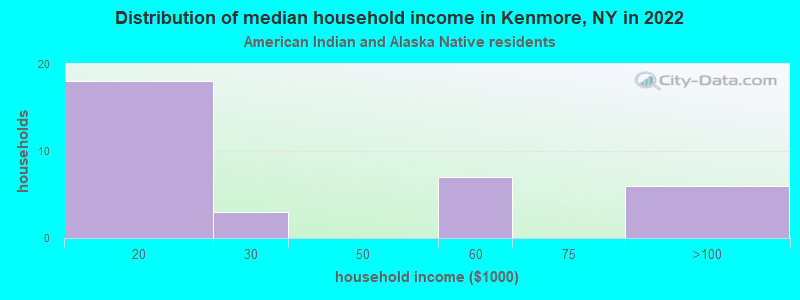
Household income for American Indian and Alaska Native householders
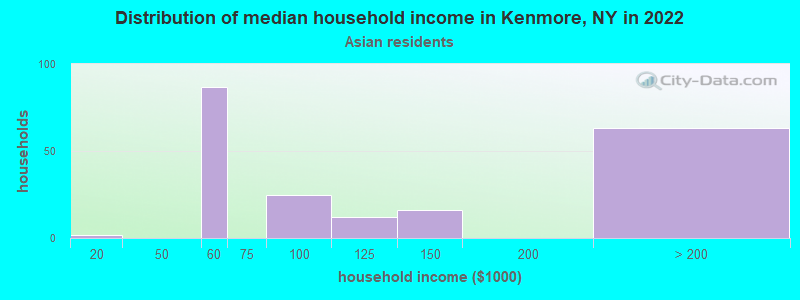
Household income for Asian householders
Household income for Some other race householders
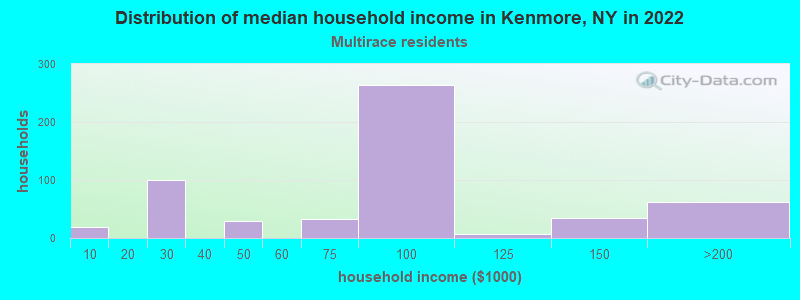
Household income for Two or more races householders
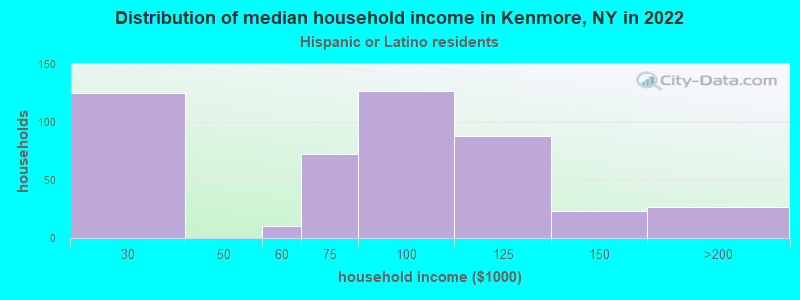
Household income for Hispanic or Latino race householders
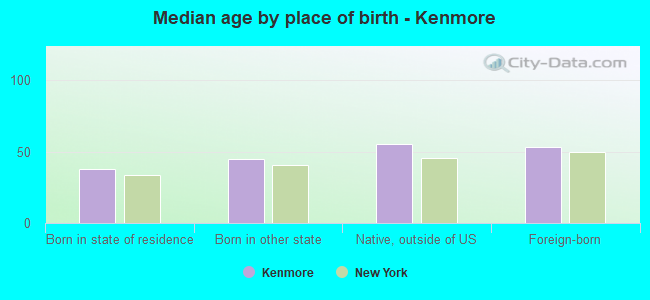
Median age by race in Kenmore
- 42.0Median age for White residents
- 40.1Males
- 42.2Females
- 43.3Median age for Black or African American residents
- 30.9Males
- 49.2Females
- 51.7Median age for American Indian / Alaska Native residents
- 25.5Males
- -668,587,895.6Females
- 33.5Median age for Asian residents
- 45.8Males
- 33.7Females
- -700,534,758.7Median age for Native Hawaiian / Pacific Islander residents
- -477,502,295.2Males
- -497,387,669.3Females
- 55.7Median age for Other race residents
- -662,538,699.0Males
- -627,720,503.4Females
- 23.4Median age for Two or more races residents
- 27.7Males
- 8.7Females
- 42.5Median age for White alone residents
- 42.6Males
- 42.4Females
- 42.8Median age for Hispanic or Latino residents
- 42.1Males
- 41.8Females
Owner/renter occupied households by race in Kenmore
- House owners and renters - White residents
- 4,53374.1%Owner occupied
- 1,58125.9%Renter occupied
- House owners and renters - Black or African American residents
- 18343.3%Owner occupied
- 23956.7%Renter occupied
- House owners and renters - American Indian / Alaska Native residents
- 1029.3%Owner occupied
- 2470.7%Renter occupied
- House owners and renters - Asian residents
- 11967.6%Owner occupied
- 5732.4%Renter occupied
- House owners and renters - Other race residents
- 7189.7%Owner occupied
- 810.3%Renter occupied
- House owners and renters - Two or more races residents
- 20644.5%Owner occupied
- 25655.5%Renter occupied
- House owners and renters - White alone residents
- 4,50775.0%Owner occupied
- 1,50425.0%Renter occupied
- House owners and renters - Hispanic or Latino residents
- 21143.6%Owner occupied
- 27356.4%Renter occupied
Language usage in Kenmore
- English speakers - Total
- 94.2% of residents of Kenmore speak English at home.
- 2.9% of residents speak Spanish at home
- 36588.2%Speak English very well
- 4911.8%Speak English less than very well
- 2.6% of residents speak other language at home
- 20053.1%Speak English very well
- 17746.9%Speak English less than very well
- English speakers - Born in the United States
- 99.9% of residents of Kenmore speak English at home.
- 0.2% of residents speak Spanish at home
- 3100.0%Speak English very well
- 0.4% of residents speak other language at home
- 7100.0%Speak English very well
- English speakers - Native, born elsewhere
- 48.1% of residents of Kenmore speak English at home.
- 30.1% of residents speak Spanish at home
- 47100.0%Speak English very well
- 21.2% of residents speak other language at home
- 1751.5%Speak English very well
- 1648.5%Speak English less than very well
- English speakers - Foreign-born
- 39.3% of residents of Kenmore speak English at home.
- 4.8% of residents speak Spanish at home
- 22100.0%Speak English very well
- 43.6% of residents speak other language at home
- 9547.3%Speak English very well
- 10652.7%Speak English less than very well
White (Caucasian) - Speak only English
| Native: | 98.4% (11,250) |
| Foreign-born: | 43.7% (98) |
White (Caucasian) - Speak another language
| Native: | 1.8% (203) |
| Foreign-born: | 49.0% (110) |
Black or African American - Speak only English
| Native: | 95.3% (859) |
| Foreign-born: | 59.1% (36) |
Black or African American - Speak another language
| Native: | 4.8% (43) |
| Foreign-born: | 1.8% (1) |
American Indian / Alaska Native - Speak only English
| Native: | 90.8% (82) |
| Foreign-born: | 64.1% (4) |
Asian - Speak only English
| Native: | 97.8% (130) |
| Foreign-born: | 14.2% (20) |
Two or more races - Speak only English
| Native: | 84.2% (1,185) |
| Foreign-born: | 81.8% (19) |
Two or more races - Speak another language
| Native: | 15.8% (222) |
| Foreign-born: | 27.8% (6) |
White alone - Speak only English
| Native: | 98.5% (11,051) |
| Foreign-born: | 49.8% (102) |
White alone - Speak another language
| Native: | 1.5% (169) |
| Foreign-born: | 41.6% (85) |
Hispanic or Latino - Speak another language
| Native: | 38.1% (338) |
| Foreign-born: | 100.0% (24) |
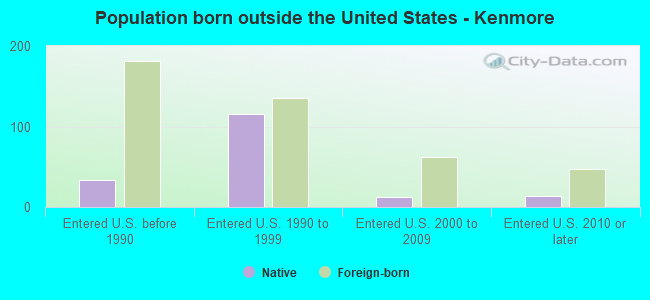
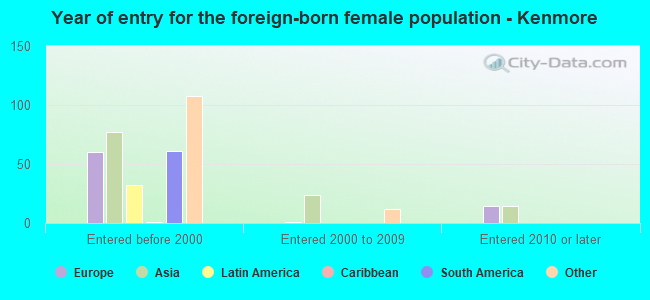
Foreign-born residents in Kenmore
473 residents are foreign born (1.1% Asia, 0.7% North America, 0.5% Europe, 0.4% Africa, 0.4% Latin America).
| This city: | 3.1% |
| New York: | 22.6% |


Marital status for residents in Kenmore
Marital status - White (Caucasian) population 15 years and over
- Males
- 39.1%Never married
- 50.5%Now married
- 0.3%Separated
- 3.2%Widowed
- 6.8%Divorced
- Females
- 33.3%Never married
- 40.0%Now married
- 0.2%Separated
- 8.1%Widowed
- 18.4%Divorced
Women who gave birth in the past 12 months
| Now married: | 46.6% (46) |
| Unmarried: | 53.4% (53) |
Women who did not give birth in the past 12 months
| Now married: | 36.0% (1,073) |
| Unmarried: | 64.0% (1,904) |
Marital status - Black or African American population 15 years and over
- Males
- 63.2%Never married
- 16.6%Now married
- 0.0%Separated
- 8.4%Widowed
- 11.8%Divorced
- Females
- 40.9%Never married
- 12.0%Now married
- 4.7%Separated
- 12.3%Widowed
- 30.1%Divorced
Women who gave birth in the past 12 months
| Now married: | 0.0% (0) |
| Unmarried: | 100.0% (21) |
Women who did not give birth in the past 12 months
| Now married: | 16.5% (39) |
| Unmarried: | 83.5% (196) |
Marital status - American Indian / Alaska Native population 15 years and over
- Males
- 69.7%Never married
- 15.2%Now married
- 0.0%Separated
- 12.1%Widowed
- 3.0%Divorced
- Females
- 100.0%Never married
- 0.0%Now married
- 0.0%Separated
- 0.0%Widowed
- 0.0%Divorced
Women who did not give birth in the past 12 months
| Now married: | 0.0% (0) |
| Unmarried: | 100.0% (9) |
Marital status - Asian population 15 years and over
- Males
- 40.0%Never married
- 60.0%Now married
- 0.0%Separated
- 0.0%Widowed
- 0.0%Divorced
- Females
- 39.4%Never married
- 25.9%Now married
- 0.0%Separated
- 34.7%Widowed
- 0.0%Divorced
Women who did not give birth in the past 12 months
| Now married: | 36.2% (42) |
| Unmarried: | 63.8% (74) |
Marital status - Other race population 15 years and over
- Males
- 11.7%Never married
- 0.0%Now married
- 0.0%Separated
- 0.0%Widowed
- 88.3%Divorced
- Females
- 96.8%Never married
- 0.0%Now married
- 0.0%Separated
- 0.0%Widowed
- 3.2%Divorced
Marital status - Two or more races population 15 years and over
- Males
- 57.5%Never married
- 17.9%Now married
- 24.5%Separated
- 0.0%Widowed
- 0.0%Divorced
- Females
- 38.8%Never married
- 39.7%Now married
- 0.0%Separated
- 0.0%Widowed
- 21.5%Divorced
Women who did not give birth in the past 12 months
| Now married: | 20.9% (30) |
| Unmarried: | 79.1% (113) |
Marital status - White alone, not Hispanic / Latino population 15 years and over
- Males
- 38.2%Never married
- 51.1%Now married
- 0.4%Separated
- 3.3%Widowed
- 7.1%Divorced
- Females
- 33.4%Never married
- 39.8%Now married
- 0.2%Separated
- 8.3%Widowed
- 18.3%Divorced
Women who gave birth in the past 12 months
| Now married: | 42.3% (32) |
| Unmarried: | 57.7% (43) |
Women who did not give birth in the past 12 months
| Now married: | 36.3% (1,067) |
| Unmarried: | 63.7% (1,873) |
Marital status - Hispanic or Latino population 15 years and over
- Males
- 28.6%Never married
- 24.5%Now married
- 34.8%Separated
- 0.0%Widowed
- 12.0%Divorced
- Females
- 54.2%Never married
- 31.2%Now married
- 0.0%Separated
- 0.0%Widowed
- 14.6%Divorced
Women who gave birth in the past 12 months
| Now married: | 60.0% (16) |
| Unmarried: | 40.0% (10) |
Women who did not give birth in the past 12 months
| Now married: | 6.7% (5) |
| Unmarried: | 93.3% (73) |
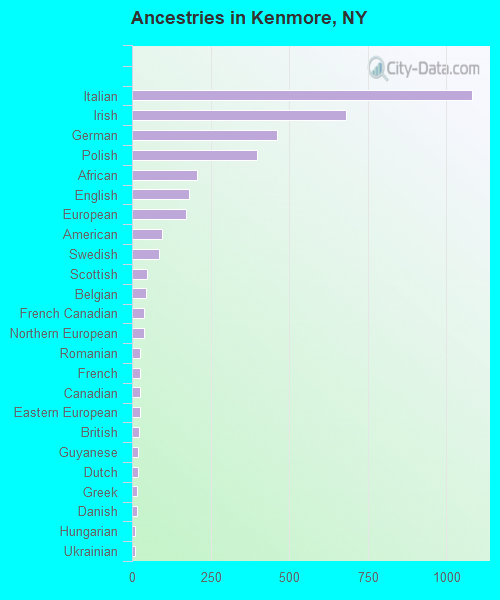
Ancestries in Kenmore

- 1,08221.7%Italian
- 68013.6%Irish
- 4629.3%German
- 3988.0%Polish
- 2074.1%African
- 1803.6%English
- 1713.4%European
- 961.9%American
- 861.7%Swedish
- 481.0%Scottish
- 430.9%Belgian
- 380.8%French Canadian
- 370.7%Northern European
- 270.5%Romanian
- 260.5%French
- 250.5%Canadian
- 240.5%Eastern European
- 220.4%British
- 200.4%Guyanese
- 190.4%Dutch
- 170.3%Greek
- 160.3%Danish
- 110.2%Hungarian
- 100.2%Ukrainian
- 90.2%Scotch-Irish
- 50.1%Czech
- 30.06%Jordanian
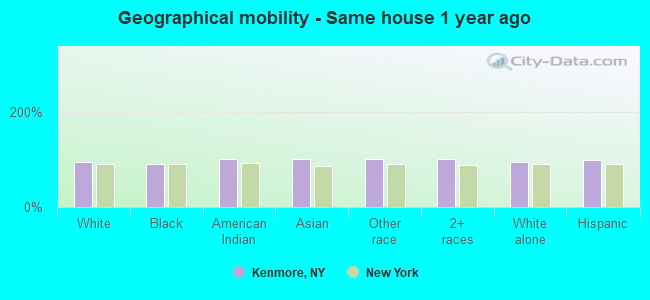
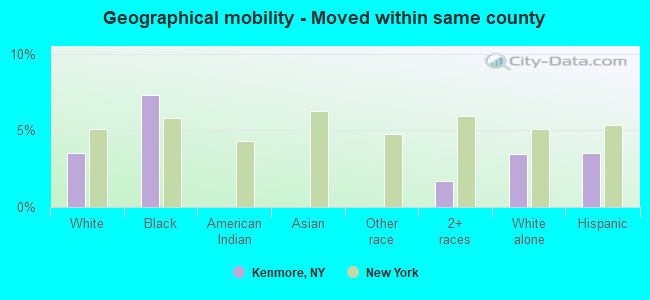
Geographical mobility in Kenmore

- Same house 1 year ago
- 11,26993.7%White (Caucasian)
- 86389.9%Black or African American
- 105100.0%American Indian / Alaska Native
- 274100.0%Asian
- 177100.0%Other race
- 1,564100.0%Two or more races
- 11,06393.7%White alone, not Hispanic / Latino
- 89799.4%Hispanic or Latino
-
- Moved within same county
- 4243.5%White / Caucasian
- 707.3%Black or African American
- 261.7%Two or more races
- 4053.4%White alone, not Hispanic / Latino
- 323.5%Hispanic or Latino
-
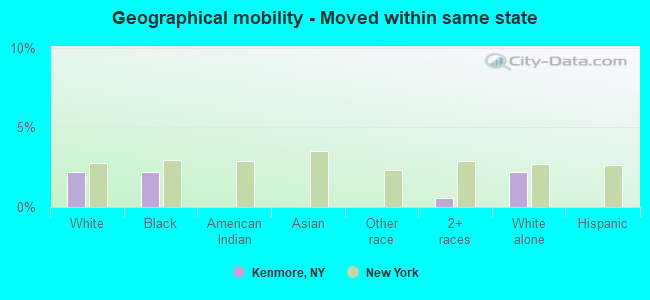
- Moved within same state
- 2612.2%White / Caucasian
- 212.2%Black or African American
- 90.6%Two or more races
- 2562.2%White alone, not Hispanic / Latino
-
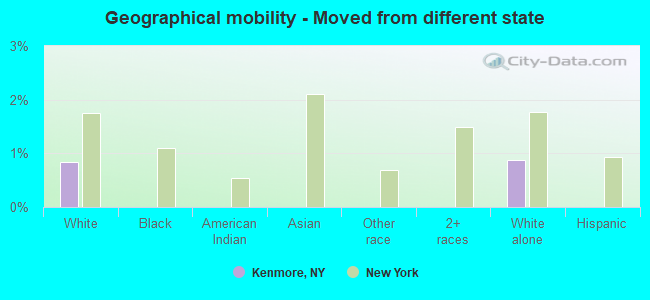
- Moved from different state
- 1010.8%White / Caucasian
- 1040.9%White alone, not Hispanic / Latino
-
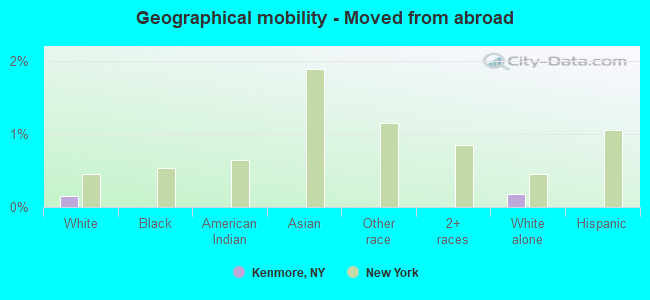
- Moved from abroad
- 180.1%White
- 210.2%White alone, not Hispanic / Latino
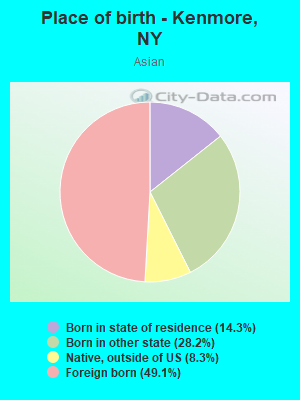
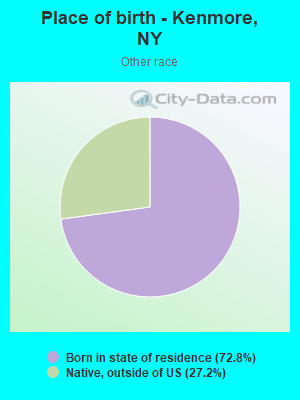
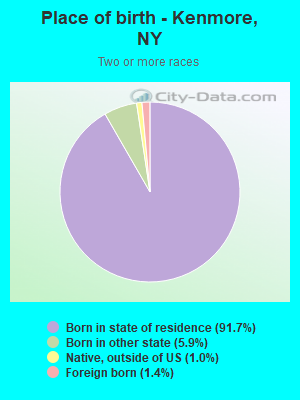
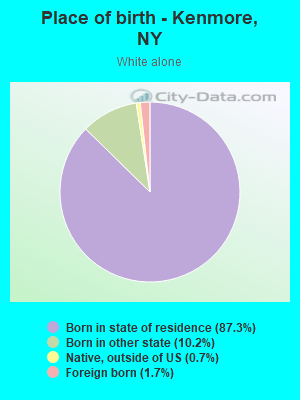
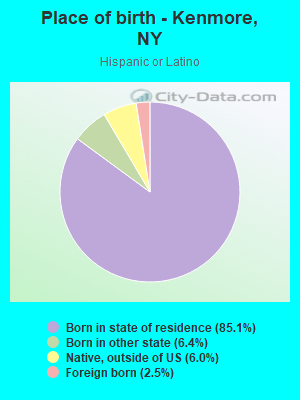
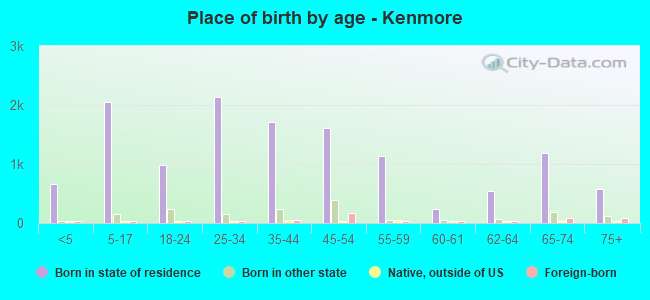
Children Nativity (place of birth) in Kenmore
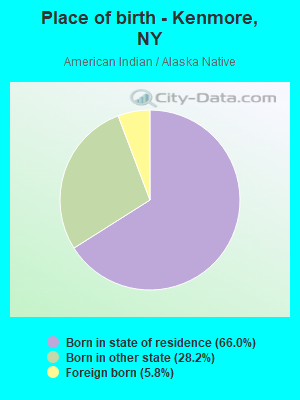
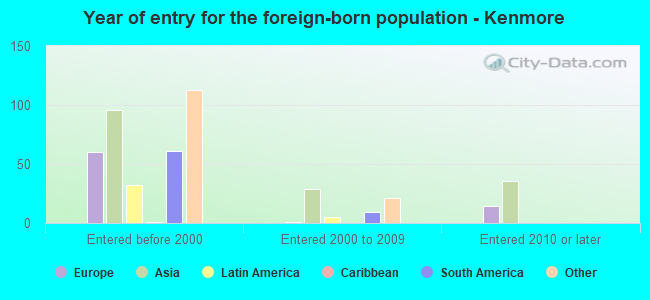
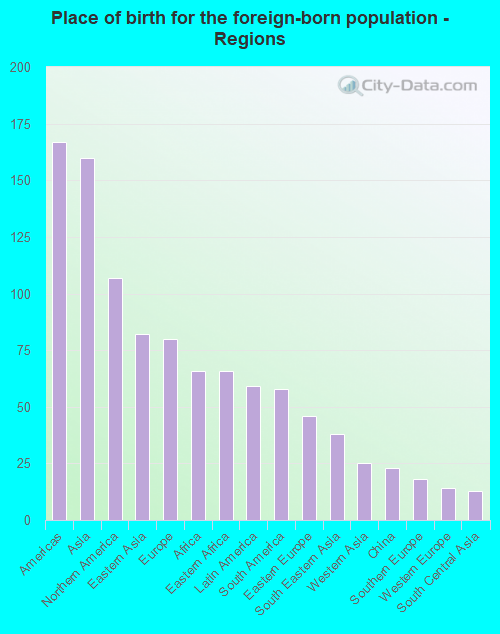
Place of birth for residents in Kenmore
![Place of birth for the foreign-born population - Regions]()
- 167Americas
- 160Asia
- 107Northern America
- 82Eastern Asia
- 80Europe
- 66Africa
- 66Eastern Africa
- 59Latin America
- 58South America
- 46Eastern Europe
- 38South Eastern Asia
- 25Western Asia
- 23China
- 18Southern Europe
- 14Western Europe
- 13South Central Asia
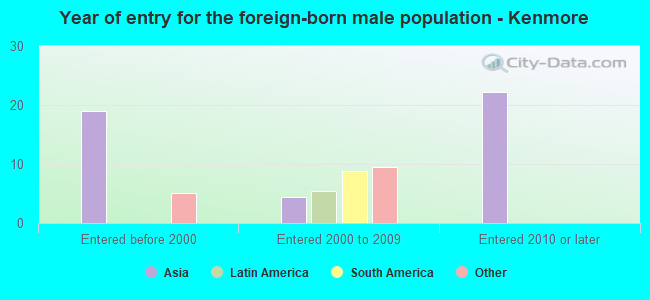
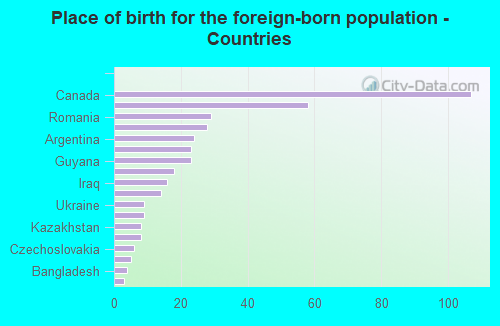
![Place of birth for the foreign-born population - Countries]()
- 107Canada
- 58Japan
- 29Romania
- 28Burma (Myanmar)
- 24Argentina
- 23China
- 23Guyana
- 18Italy
- 16Iraq
- 14France
- 9Ukraine
- 9Venezuela
- 8Kazakhstan
- 8Lebanon
- 6Czechoslovakia
- 5Laos
- 4Bangladesh
- 3Thailand
Grandparents responsible for own grandchildren in Kenmore
Zip codes: 14217.