Races in Kenwood, Ohio (OH) Detailed Stats
Data:
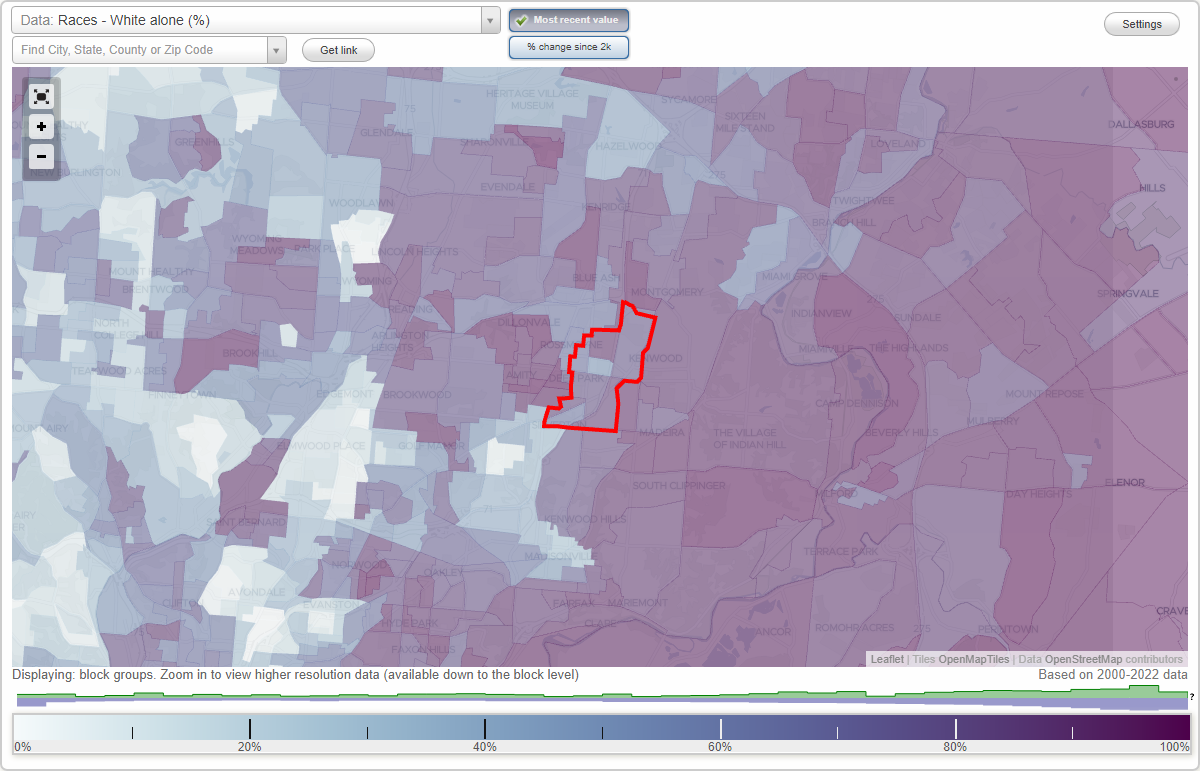
Races - White alone (%)
Races - White alone (% change since 2000)
Races - Black alone (%)
Races - Black alone (% change since 2000)
Races - American Indian alone (%)
Races - American Indian alone (% change since 2000)
Races - Asian alone (%)
Races - Asian alone (% change since 2000)
Races - Hispanic (%)
Races - Hispanic (% change since 2000)
Races - Native Hawaiian and Other Pacific Islander alone (%)
Races - Native Hawaiian and Other Pacific Islander alone (% change since 2000)
Races - Two or more races(%)
Races - Two or more races(% change since 2000)
Races - Other race alone (%)
Races - Other race alone (% change since 2000)
Racial diversity
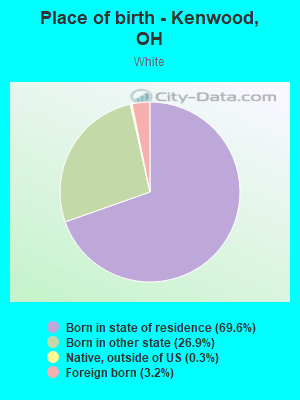
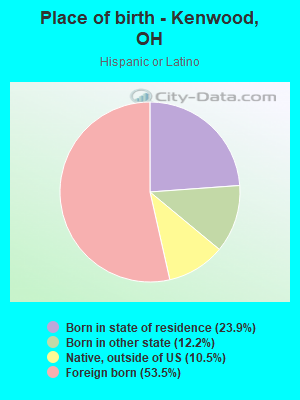
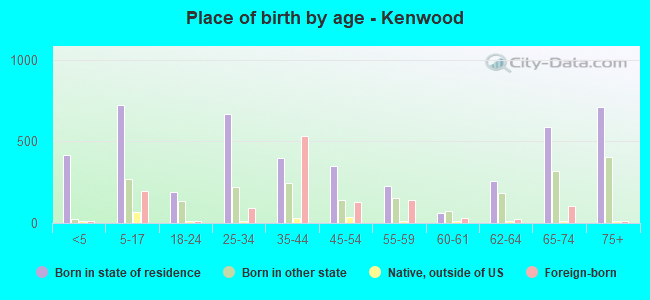
Place of birth - Born in state of residence (%)
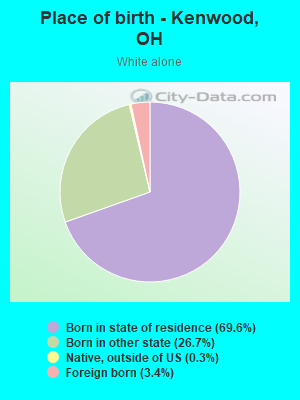
Place of birth - Born in state of residence (%) - White
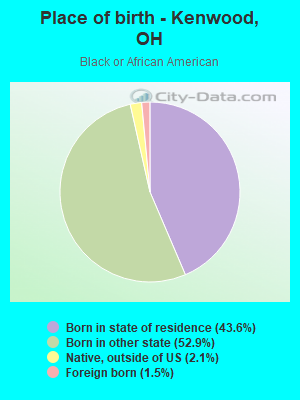
Place of birth - Born in state of residence (%) - Black or African American
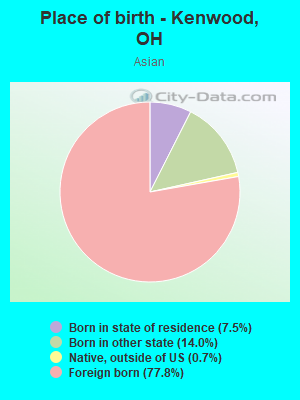
Place of birth - Born in state of residence (%) - Asian
Place of birth - Born in state of residence (%) - Hispanic or Latino
Place of birth - Born in state of residence (%) - American Indian and Alaska Native
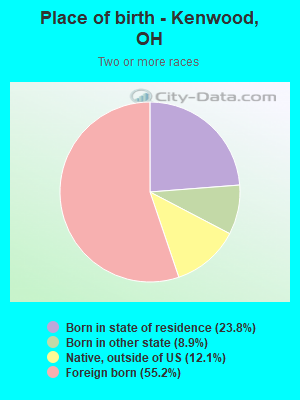
Place of birth - Born in state of residence (%) - Multirace
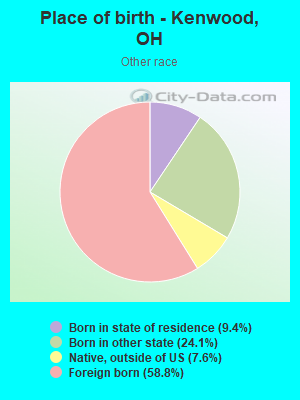
Place of birth - Born in state of residence (%) - Other Race
Place of birth - Born in other state (%)
Place of birth - Born in other state (%) - White
Place of birth - Born in other state (%) - Black or African American
Place of birth - Born in other state (%) - Asian
Place of birth - Born in other state (%) - Hispanic or Latino
Place of birth - Born in other state (%) - American Indian and Alaska Native
Place of birth - Born in other state (%) - Multirace
Place of birth - Born in other state (%) - Other Race
Place of birth - Native, outside of US (%)
Place of birth - Native, outside of US (%) - White
Place of birth - Native, outside of US (%) - Black or African American
Place of birth - Native, outside of US (%) - Asian
Place of birth - Native, outside of US (%) - Hispanic or Latino
Place of birth - Native, outside of US (%) - American Indian and Alaska Native
Place of birth - Native, outside of US (%) - Multirace
Place of birth - Native, outside of US (%) - Other Race
Place of birth - Foreign born (%)
Place of birth - Foreign born (%) - White
Place of birth - Foreign born (%) - Black or African American
Place of birth - Foreign born (%) - Asian
Place of birth - Foreign born (%) - Hispanic or Latino
Place of birth - Foreign born (%) - American Indian and Alaska Native
Place of birth - Foreign born (%) - Multirace
Place of birth - Foreign born (%) - Other Race
Residents speaking English at home (%)
Residents speaking English at home - Born in the United States (%)
Residents speaking English at home - Native, born elsewhere (%)
Residents speaking English at home - Foreign born (%)
Residents speaking Spanish at home (%)
Residents speaking Spanish at home - Born in the United States (%)
Residents speaking Spanish at home - Native, born elsewhere (%)
Residents speaking Spanish at home - Foreign born (%)
Residents speaking other language at home (%)
Residents speaking other language at home - Born in the United States (%)
Residents speaking other language at home - Native, born elsewhere (%)
Residents speaking other language at home - Foreign born (%)
Marital status - Never married (%)
Marital status - Now married (%)
Marital status - Separated (%)
Marital status - Widowed (%)
Marital status - Divorced (%)
Ancestries Reported - Arab (%)
Ancestries Reported - Czech (%)
Ancestries Reported - Danish (%)
Ancestries Reported - Dutch (%)
Ancestries Reported - English (%)
Ancestries Reported - French (%)
Ancestries Reported - French Canadian (%)
Ancestries Reported - German (%)
Ancestries Reported - Greek (%)
Ancestries Reported - Hungarian (%)
Ancestries Reported - Irish (%)
Ancestries Reported - Italian (%)
Ancestries Reported - Lithuanian (%)
Ancestries Reported - Norwegian (%)
Ancestries Reported - Polish (%)
Ancestries Reported - Portuguese (%)
Ancestries Reported - Russian (%)
Ancestries Reported - Scotch-Irish (%)
Ancestries Reported - Scottish (%)
Ancestries Reported - Slovak (%)
Ancestries Reported - Subsaharan African (%)
Ancestries Reported - Swedish (%)
Ancestries Reported - Swiss (%)
Ancestries Reported - Ukrainian (%)
Ancestries Reported - United States (%)
Ancestries Reported - Welsh (%)
Ancestries Reported - West Indian (%)
Ancestries Reported - Other (%)
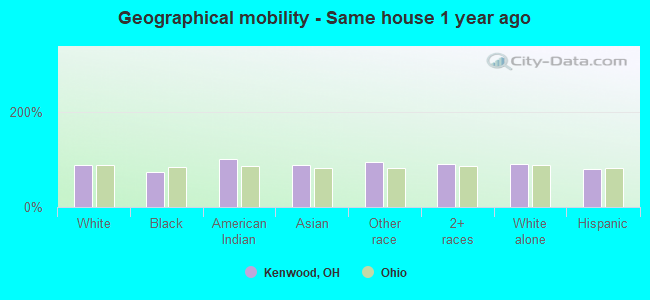
Geographical mobility - Same house 1 year ago (%)
Geographical mobility - Same house 1 year ago (%) - White
Geographical mobility - Same house 1 year ago (%) - Black or African American
Geographical mobility - Same house 1 year ago (%) - Asian
Geographical mobility - Same house 1 year ago (%) - Hispanic or Latino
Geographical mobility - Same house 1 year ago (%) - American Indian and Alaska Native
Geographical mobility - Same house 1 year ago (%) - Multirace
Geographical mobility - Same house 1 year ago (%) - Other Race
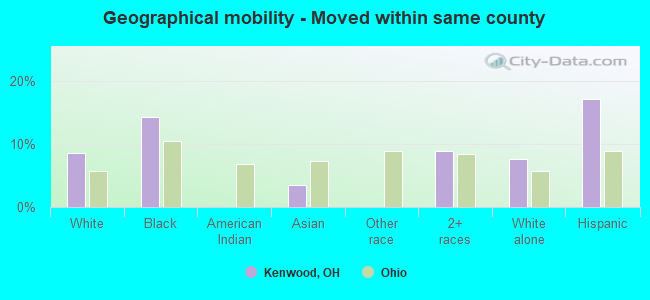
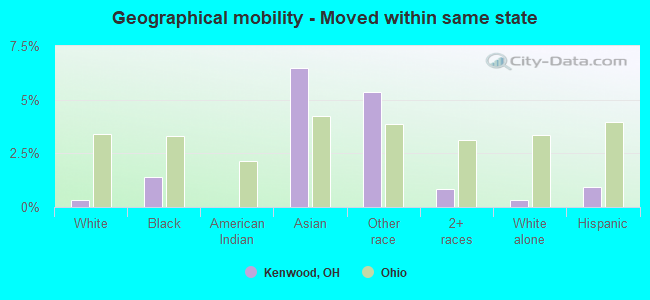
Geographical mobility - Moved within same county (%)
Geographical mobility - Moved within same county (%) - White
Geographical mobility - Moved within same county (%) - Black or African American
Geographical mobility - Moved within same county (%) - Asian
Geographical mobility - Moved within same county (%) - Hispanic or Latino
Geographical mobility - Moved within same county (%) - American Indian and Alaska Native
Geographical mobility - Moved within same county (%) - Multirace
Geographical mobility - Moved within same county (%) - Other Race
Geographical mobility - Moved from different county within same state (%)
Geographical mobility - Moved from different county within same state (%) - White
Geographical mobility - Moved from different county within same state (%) - Black or African American
Geographical mobility - Moved from different county within same state (%) - Asian
Geographical mobility - Moved from different county within same state (%) - Hispanic or Latino
Geographical mobility - Moved from different county within same state (%) - American Indian and Alaska Native
Geographical mobility - Moved from different county within same state (%) - Multirace
Geographical mobility - Moved from different county within same state (%) - Other Race
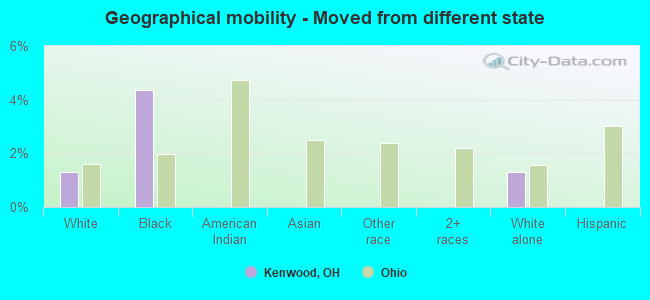
Geographical mobility - Moved from different state (%)
Geographical mobility - Moved from different state (%) - White
Geographical mobility - Moved from different state (%) - Black or African American
Geographical mobility - Moved from different state (%) - Asian
Geographical mobility - Moved from different state (%) - Hispanic or Latino
Geographical mobility - Moved from different state (%) - American Indian and Alaska Native
Geographical mobility - Moved from different state (%) - Multirace
Geographical mobility - Moved from different state (%) - Other Race
Geographical mobility - Moved from abroad (%)
Geographical mobility - Moved from abroad (%) - White
Geographical mobility - Moved from abroad (%) - Black or African American
Geographical mobility - Moved from abroad (%) - Asian
Geographical mobility - Moved from abroad (%) - Hispanic or Latino
Geographical mobility - Moved from abroad (%) - American Indian and Alaska Native
Geographical mobility - Moved from abroad (%) - Multirace
Geographical mobility - Moved from abroad (%) - Other Race
Place of birth for the foreign-born population - Ireland (%)
Place of birth for the foreign-born population - Denmark (%)
Place of birth for the foreign-born population - Norway (%)
Place of birth for the foreign-born population - Sweden (%)
Place of birth for the foreign-born population - United Kingdom (%)
Place of birth for the foreign-born population - England (%)
Place of birth for the foreign-born population - Scotland (%)
Place of birth for the foreign-born population - Other Northern Europe (%)
Place of birth for the foreign-born population - Austria (%)
Place of birth for the foreign-born population - Belgium (%)
Place of birth for the foreign-born population - France (%)
Place of birth for the foreign-born population - Germany (%)
Place of birth for the foreign-born population - Netherlands (%)
Place of birth for the foreign-born population - Switzerland (%)
Place of birth for the foreign-born population - Other Western Europe (%)
Place of birth for the foreign-born population - Greece (%)
Place of birth for the foreign-born population - Italy (%)
Place of birth for the foreign-born population - Portugal (%)
Place of birth for the foreign-born population - Spain (%)
Place of birth for the foreign-born population - Other Southern Europe (%)
Place of birth for the foreign-born population - Albania (%)
Place of birth for the foreign-born population - Belarus (%)
Place of birth for the foreign-born population - Bosnia and Herzegovina (%)
Place of birth for the foreign-born population - Bulgaria (%)
Place of birth for the foreign-born population - Croatia (%)
Place of birth for the foreign-born population - Czechoslovakia (%)
Place of birth for the foreign-born population - Hungary (%)
Place of birth for the foreign-born population - Latvia (%)
Place of birth for the foreign-born population - Lithuania (%)
Place of birth for the foreign-born population - North Macedonia (Macedonia) (%)
Place of birth for the foreign-born population - Moldova (%)
Place of birth for the foreign-born population - Poland (%)
Place of birth for the foreign-born population - Romania (%)
Place of birth for the foreign-born population - Russia (%)
Place of birth for the foreign-born population - Serbia (%)
Place of birth for the foreign-born population - Ukraine (%)
Place of birth for the foreign-born population - Other Eastern Europe (%)
Place of birth for the foreign-born population - China (%)
Place of birth for the foreign-born population - Hong Kong (%)
Place of birth for the foreign-born population - Taiwan (%)
Place of birth for the foreign-born population - Japan (%)
Place of birth for the foreign-born population - Korea (%)
Place of birth for the foreign-born population - Other Eastern Asia (%)
Place of birth for the foreign-born population - Afghanistan (%)
Place of birth for the foreign-born population - Bangladesh (%)
Place of birth for the foreign-born population - India (%)
Place of birth for the foreign-born population - Iran (%)
Place of birth for the foreign-born population - Kazakhstan (%)
Place of birth for the foreign-born population - Nepal (%)
Place of birth for the foreign-born population - Pakistan (%)
Place of birth for the foreign-born population - Sri Lanka (%)
Place of birth for the foreign-born population - Uzbekistan (%)
Place of birth for the foreign-born population - Other South Central Asia (%)
Place of birth for the foreign-born population - Burma (%)
Place of birth for the foreign-born population - Cambodia (%)
Place of birth for the foreign-born population - Indonesia (%)
Place of birth for the foreign-born population - Laos (%)
Place of birth for the foreign-born population - Malaysia (%)
Place of birth for the foreign-born population - Philippines (%)
Place of birth for the foreign-born population - Singapore (%)
Place of birth for the foreign-born population - Thailand (%)
Place of birth for the foreign-born population - Vietnam (%)
Place of birth for the foreign-born population - Other South Eastern Asia (%)
Place of birth for the foreign-born population - Armenia (%)
Place of birth for the foreign-born population - Iraq (%)
Place of birth for the foreign-born population - Israel (%)
Place of birth for the foreign-born population - Jordan (%)
Place of birth for the foreign-born population - Kuwait (%)
Place of birth for the foreign-born population - Lebanon (%)
Place of birth for the foreign-born population - Saudi Arabia (%)
Place of birth for the foreign-born population - Syria (%)
Place of birth for the foreign-born population - Turkey (%)
Place of birth for the foreign-born population - Yemen (%)
Place of birth for the foreign-born population - Other Western Asia (%)
Place of birth for the foreign-born population - Eritrea (%)
Place of birth for the foreign-born population - Ethiopia (%)
Place of birth for the foreign-born population - Kenya (%)
Place of birth for the foreign-born population - Somalia (%)
Place of birth for the foreign-born population - Uganda (%)
Place of birth for the foreign-born population - Zimbabwe (%)
Place of birth for the foreign-born population - Other Eastern Africa (%)
Place of birth for the foreign-born population - Cameroon (%)
Place of birth for the foreign-born population - Congo (%)
Place of birth for the foreign-born population - Democratic Republic of Congo (Zaire) (%)
Place of birth for the foreign-born population - Other Middle Africa (%)
Place of birth for the foreign-born population - Egypt (%)
Place of birth for the foreign-born population - Morocco (%)
Place of birth for the foreign-born population - Sudan (%)
Place of birth for the foreign-born population - Other Northern Africa (%)
Place of birth for the foreign-born population - South Africa (%)
Place of birth for the foreign-born population - Other Southern Africa (%)
Place of birth for the foreign-born population - Cabo Verde (%)
Place of birth for the foreign-born population - Ghana (%)
Place of birth for the foreign-born population - Liberia (%)
Place of birth for the foreign-born population - Nigeria (%)
Place of birth for the foreign-born population - Senegal (%)
Place of birth for the foreign-born population - Sierra Leone (%)
Place of birth for the foreign-born population - Other Western Africa (%)
Place of birth for the foreign-born population - Australia (%)
Place of birth for the foreign-born population - New Zealand (%)
Place of birth for the foreign-born population - Fiji (%)
Place of birth for the foreign-born population - Micronesia (%)
Place of birth for the foreign-born population - Bahamas (%)
Place of birth for the foreign-born population - Barbados (%)
Place of birth for the foreign-born population - Cuba (%)
Place of birth for the foreign-born population - Dominica (%)
Place of birth for the foreign-born population - Dominican Republic (%)
Place of birth for the foreign-born population - Grenada (%)
Place of birth for the foreign-born population - Haiti (%)
Place of birth for the foreign-born population - Jamaica (%)
Place of birth for the foreign-born population - St. Vincent and the Grenadines (%)
Place of birth for the foreign-born population - Trinidad and Tobago (%)
Place of birth for the foreign-born population - West Indies (%)
Place of birth for the foreign-born population - Other Caribbean (%)
Place of birth for the foreign-born population - Belize (%)
Place of birth for the foreign-born population - Costa Rica (%)
Place of birth for the foreign-born population - El Salvador (%)
Place of birth for the foreign-born population - Guatemala (%)
Place of birth for the foreign-born population - Honduras (%)
Place of birth for the foreign-born population - Mexico (%)
Place of birth for the foreign-born population - Nicaragua (%)
Place of birth for the foreign-born population - Panama (%)
Place of birth for the foreign-born population - Other Central America (%)
Place of birth for the foreign-born population - Argentina (%)
Place of birth for the foreign-born population - Bolivia (%)
Place of birth for the foreign-born population - Brazil (%)
Place of birth for the foreign-born population - Chile (%)
Place of birth for the foreign-born population - Colombia (%)
Place of birth for the foreign-born population - Ecuador (%)
Place of birth for the foreign-born population - Guyana (%)
Place of birth for the foreign-born population - Peru (%)
Place of birth for the foreign-born population - Uruguay (%)
Place of birth for the foreign-born population - Venezuela (%)
Place of birth for the foreign-born population - Other South America (%)
Place of birth for the foreign-born population - Canada (%)
Place of birth for the foreign-born population - Other Northern America (%)
Place of birth for the foreign-born population - Other (%)
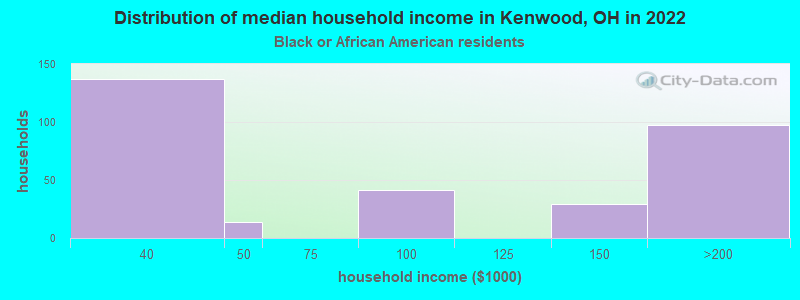
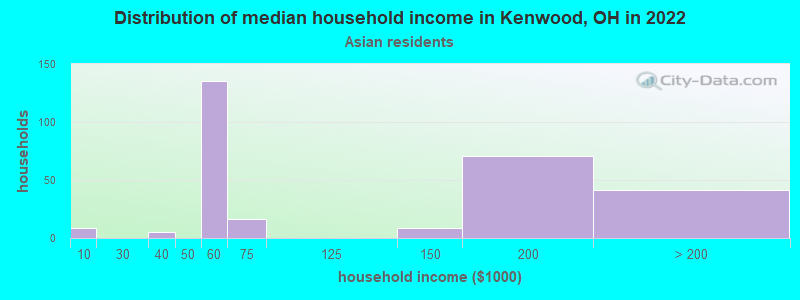
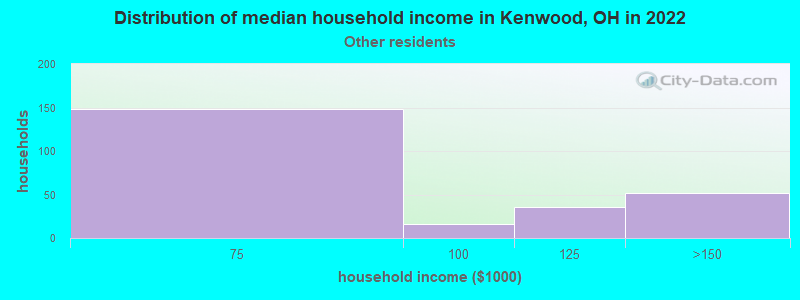
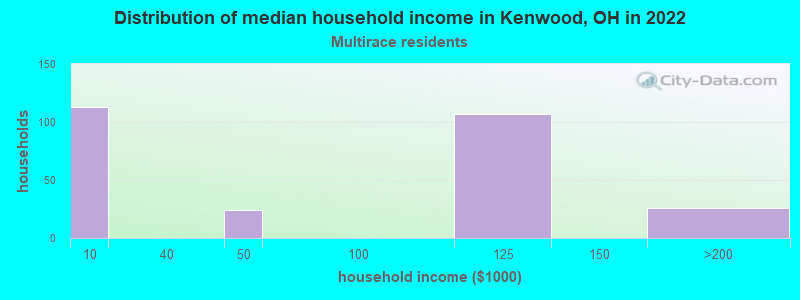
According to 2022 data, the most numerous races in Kenwood, OH are White alone (5,572 residents), Black alone (657 residents), and Two or more races (268 residents). 80.7% of Kenwood residents speak English at home. 17.0% of Kenwood, OH residents are foreign-born (7.7% born in Latin America, 7.2% born in Asia), which is 76.5% greater than the foreign-born rate of 4.0% across the entire state of Ohio.
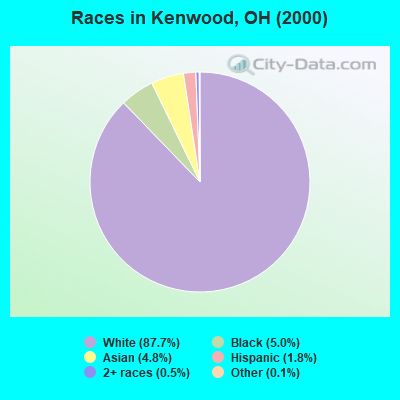
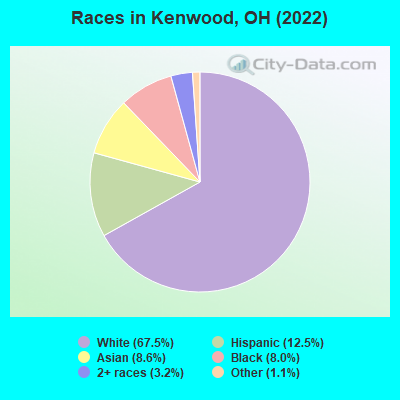
Race distribution in Kenwood
2000 2022
9,538,111 84.0% White alone 1,290,662 11.4% Black alone 217,123 1.9% Hispanic 137,770 1.2% Two or more races 131,670 1.2% Asian alone 21,985 0.2% American Indian alone 13,483 0.1% Other race alone 2,336 0.02% Native Hawaiian and Other
8,948,793 76.1% White alone 1,401,403 11.9% Black alone 529,291 4.5% Two or more races 517,232 4.4% Hispanic 293,387 2.5% Asian alone 52,805 0.4% Other race alone 9,785 0.08% American Indian alone 3,362 0.03% Native Hawaiian and Other
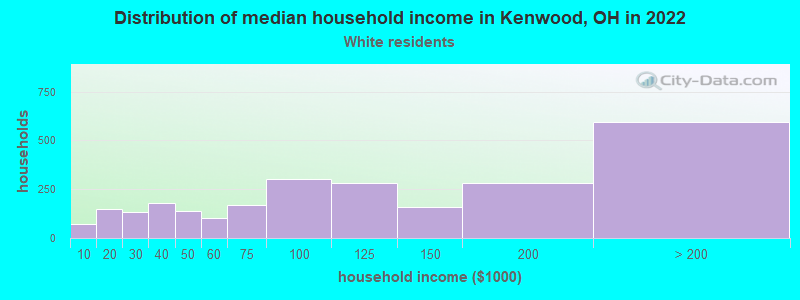
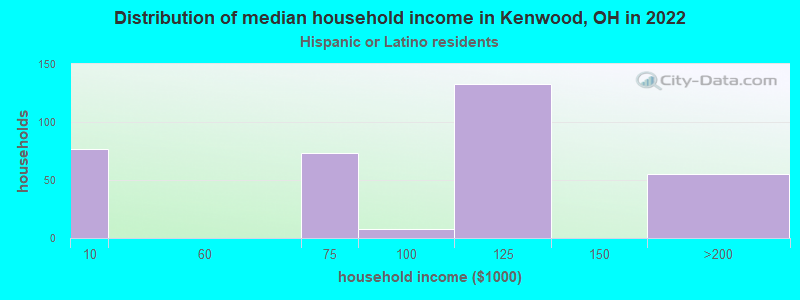
Income and house value in Kenwood Median household income in 2022 $101,319 White non-Hispanic householders$52,067 Some other race householders$116,443 Two or more races householders$100,376 Hispanic or Latino race householdersMedian 2022 house value $367,651 White Non-Hispanic householders$233,601 Black or African American householders $330,196 Asian householders$369,622 Native Hawaiian and other Pacific Islander householders$221,773 Two or more races householders$499,926 Hispanic or Latino householders
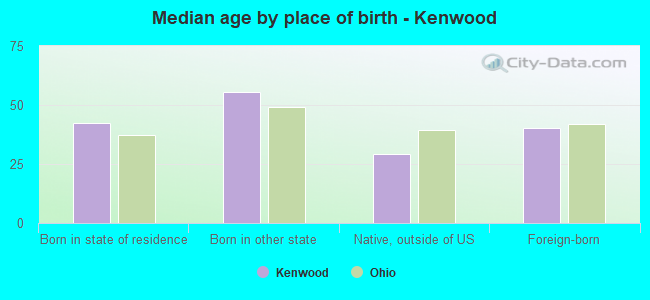
Median age by race in Kenwood
51.0 Median age for White residents47.0 54.5 44.0 Median age for Black or African American residents38.9 44.9 -666,666,666.0 Median age for American Indian / Alaska Native residents-622,116,148.9 -871,212,120.3 40.2 Median age for Asian residents37.8 45.8 -800,387,596.1 Median age for Native Hawaiian / Pacific Islander residents-750,242,953.6 -805,394,989.6 47.9 Median age for Other race residents36.1 57.6 24.7 Median age for Two or more races residents18.2 36.1 51.8 Median age for White alone residents47.6 56.1 41.7 Median age for Hispanic or Latino residents18.3 42.2
Owner/renter occupied households by race in Kenwood
House owners and renters - White residents 1,937 75.3% Owner occupied634 24.7% Renter occupiedHouse owners and renters - Black or African American residents 109 38.5% Owner occupied173 61.5% Renter occupiedHouse owners and renters - American Indian / Alaska Native residents 4 100.0% Renter occupiedHouse owners and renters - Asian residents 115 43.7% Owner occupied149 56.3% Renter occupiedHouse owners and renters - Other race residents 127 59.4% Owner occupied87 40.6% Renter occupiedHouse owners and renters - Two or more races residents 60 20.8% Owner occupied228 79.2% Renter occupiedHouse owners and renters - White alone residents 1,943 76.1% Owner occupied610 23.9% Renter occupiedHouse owners and renters - Hispanic or Latino residents 192 45.4% Owner occupied231 54.6% Renter occupied
Language usage in Kenwood
English speakers - Total 80.7% of residents of Kenwood speak English at home.
8.3% of residents speak Spanish at home 534 82.7% Speak English very well112 17.3% Speak English less than very well11.2% of residents speak other language at home 671 76.4% Speak English very well207 23.6% Speak English less than very well
English speakers - Born in the United States 92.0% of residents of Kenwood speak English at home.
3.9% of residents speak Spanish at home 83 100.0% Speak English very well3.8% of residents speak other language at home 66 82.5% Speak English very well14 17.5% Speak English less than very well
English speakers - Native, born elsewhere 18.0% of residents of Kenwood speak English at home.
71.3% of residents speak Spanish at home 99 78.0% Speak English very well28 22.0% Speak English less than very well5.1% of residents speak other language at home 9 100.0% Speak English very well
English speakers - Foreign-born 24.8% of residents of Kenwood speak English at home.
24.8% of residents speak Spanish at home 344 99.7% Speak English very well1 0.3% Speak English less than very well48.2% of residents speak other language at home 499 74.4% Speak English very well172 25.6% Speak English less than very well
White (Caucasian) - Speak only English Native:
96.8% (4,942)Foreign-born:
37.0% (68)
White (Caucasian) - Speak another language Native:
3.2% (162)Foreign-born:
63.0% (115)
Black or African American - Speak only English Native:
100.0% (677)Foreign-born:
100.0% (10)
Asian - Speak only English Native:
30.6% (35)Foreign-born:
17.8% (102)
Asian - Speak another language Native:
60.0% (69)Foreign-born:
82.3% (471)
Other race - Speak only English Native:
42.4% (39)Foreign-born:
46.5% (108)
Other race - Speak another language Native:
70.4% (65)Foreign-born:
38.6% (90)
Two or more races - Speak only English Native:
62.3% (269)Foreign-born:
5.3% (29)
Two or more races - Speak another language Native:
47.7% (206)Foreign-born:
92.1% (509)
White alone - Speak only English Native:
96.5% (4,853)Foreign-born:
37.9% (72)
White alone - Speak another language Native:
3.7% (185)Foreign-born:
58.8% (112)
Hispanic or Latino - Speak only English Native:
56.1% (251)Foreign-born:
19.0% (103)
Hispanic or Latino - Speak another language Native:
44.9% (201)Foreign-born:
75.3% (406)
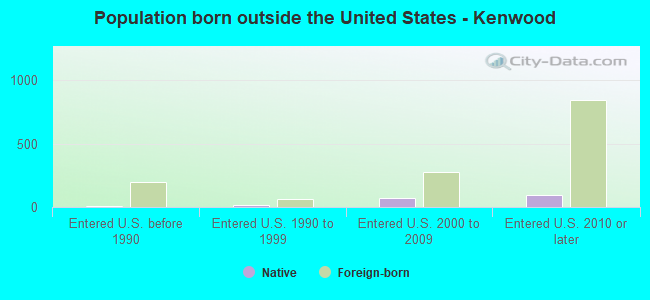
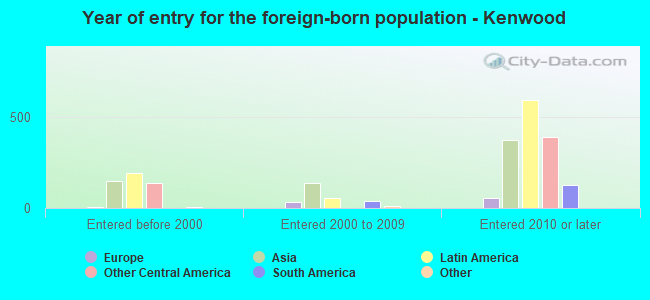
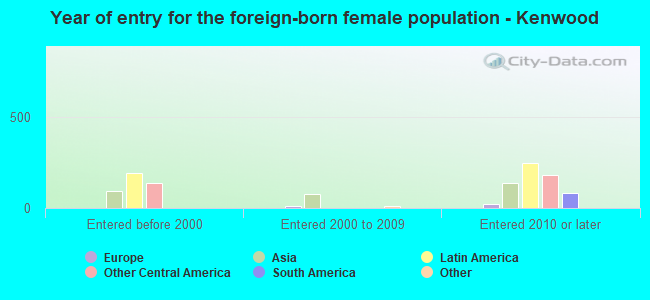
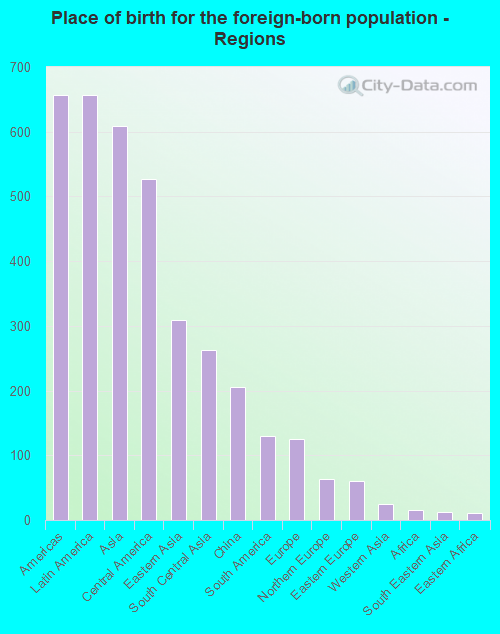
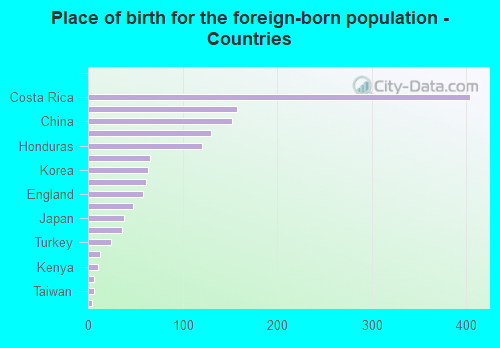
Foreign-born residents in Kenwood 1,407 residents are foreign born (7.7% Latin America , 7.2% Asia ).
Marital status for residents in Kenwood Marital status - White (Caucasian) population 15 years and over
Males 23.8% Never married58.2% Now married0.4% Separated9.0% Widowed8.6% DivorcedFemales 22.0% Never married51.5% Now married0.5% Separated14.0% Widowed12.0% DivorcedWomen who gave birth in the past 12 months Now married:
93.1% (92)Unmarried:
6.9% (7)
Women who did not give birth in the past 12 months Now married:
52.4% (508)Unmarried:
47.6% (463)
Marital status - Black or African American population 15 years and over
Males 45.8% Never married39.3% Now married0.0% Separated7.2% Widowed7.8% DivorcedFemales 7.9% Never married60.9% Now married0.0% Separated27.7% Widowed3.5% DivorcedWomen who did not give birth in the past 12 months Now married:
100.0% (75)Unmarried:
0.0% (0)
Marital status - Asian population 15 years and over
Males 21.8% Never married76.5% Now married0.0% Separated0.0% Widowed1.6% DivorcedFemales 9.2% Never married87.5% Now married0.0% Separated0.0% Widowed3.3% DivorcedWomen who gave birth in the past 12 months Now married:
100.0% (6)Unmarried:
0.0% (0)
Women who did not give birth in the past 12 months Now married:
82.5% (103)Unmarried:
17.5% (22)
Marital status - Other race population 15 years and over
Males 27.3% Never married72.7% Now married0.0% Separated0.0% Widowed0.0% DivorcedFemales 15.7% Never married15.1% Now married0.0% Separated69.2% Widowed0.0% DivorcedWomen who gave birth in the past 12 months Now married:
100.0% (34)Unmarried:
0.0% (0)
Women who did not give birth in the past 12 months Now married:
0.0% (0)Unmarried:
100.0% (22)
Marital status - Two or more races population 15 years and over
Males 20.5% Never married69.4% Now married0.0% Separated0.0% Widowed10.1% DivorcedFemales 35.6% Never married56.9% Now married0.0% Separated0.0% Widowed7.5% DivorcedWomen who gave birth in the past 12 months Now married:
100.0% (15)Unmarried:
0.0% (0)
Women who did not give birth in the past 12 months Now married:
56.9% (169)Unmarried:
43.1% (128)
Marital status - White alone, not Hispanic / Latino population 15 years and over
Males 23.0% Never married58.4% Now married0.4% Separated9.3% Widowed8.8% DivorcedFemales 21.0% Never married52.1% Now married0.5% Separated14.2% Widowed12.2% DivorcedWomen who gave birth in the past 12 months Now married:
93.1% (93)Unmarried:
6.9% (7)
Women who did not give birth in the past 12 months Now married:
54.1% (513)Unmarried:
45.9% (434)
Marital status - Hispanic or Latino population 15 years and over
Males 41.0% Never married59.0% Now married0.0% Separated0.0% Widowed0.0% DivorcedFemales 32.3% Never married37.5% Now married0.0% Separated25.6% Widowed4.5% DivorcedWomen who gave birth in the past 12 months Now married:
100.0% (29)Unmarried:
0.0% (0)
Women who did not give birth in the past 12 months Now married:
48.5% (146)Unmarried:
51.5% (155)
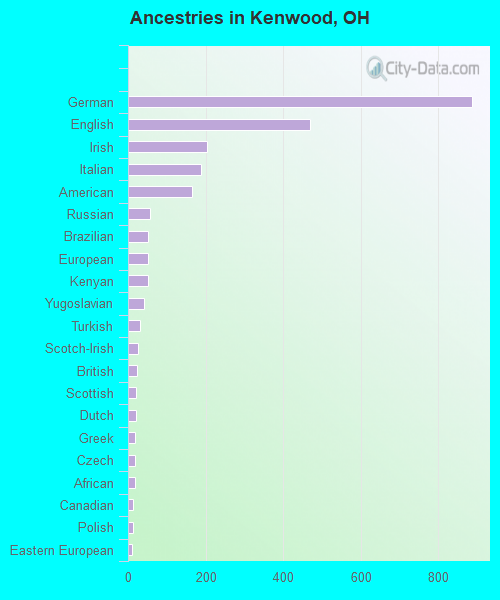
Ancestries in Kenwood
887 22.1% German469 11.7% English205 5.1% Irish188 4.7% Italian164 4.1% American58 1.4% Russian51 1.3% Brazilian51 1.3% European51 1.3% Kenyan40 1.0% Yugoslavian31 0.8% Turkish27 0.7% Scotch-Irish24 0.6% British21 0.5% Scottish20 0.5% Dutch18 0.4% Greek17 0.4% Czech17 0.4% African14 0.3% Canadian13 0.3% Polish11 0.3% Eastern European7 0.2% Norwegian6 0.1% Swedish3 0.07% Alsatian1 0.02% French1 0.02% Slovak
Children Nativity (place of birth) in Kenwood
Children under 6 years - Living with two parents Both parents native 429 100.0% NativeBoth parents foreign-born 117 100.0% NativeOne native, one foreign-born parent 49 100.0% NativeChildren under 6 years - Living with one parent Native parent 43 100.0% NativeChildren 6 to 17 years - Living with two parents Both parents native 551 100.0% NativeBoth parents foreign-born 125 32.6% Native258 67.4% Foreign-bornOne native, one foreign-born parent 33 100.0% NativeChildren 6 to 17 years - Living with one parent Native parent 157 100.0% NativeForeign-born parent 19 43.3% Native25 56.7% Foreign-born