Estimated zip code population in 2022: 24,465 Zip code population in 2010: 24,552 Zip code population in 2000: 25,568
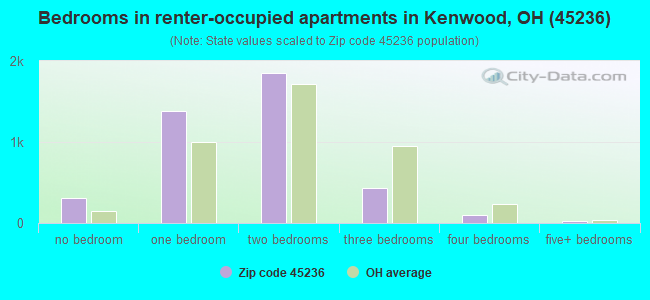
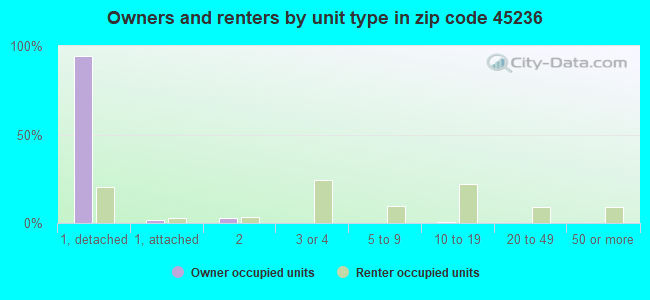
Houses and condos: 12,351 Renter-occupied apartments: 4,065
% of renters here:
35%
State:
33%
March 2022 cost of living index in zip code 45236: 88.3 (less than average, U.S. average is 100)
Land area: 6.9 sq. mi. Water area: 0.0 sq. mi.
Population density: 3,536 people per square mile
(average).
OSM Map
General Map
Google Map
MSN Map
OSM Map
General Map
Google Map
MSN Map
OSM Map
General Map
Google Map
MSN Map
OSM Map
General Map
Google Map
MSN Map
Please wait while loading the map...
Real estate property taxes paid for housing units in 2022:
This zip code:
1.6% ($3,566)
Ohio:
1.3% ($2,639)
Median real estate property taxes paid for housing units with mortgages in 2022: $3,548 (1.5%) Median real estate property taxes paid for housing units with no mortgage in 2022: $3,614 (1.8%)
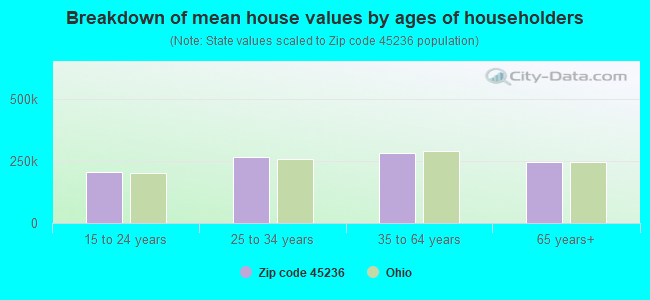
Estimated median house/condo value in 2022: $223,252
45236:
$223,252
Ohio:
$204,100
According to our research of Ohio and other state lists, there were 21 registered sex offenders living in 45236 zip code as of April 26, 2024. The ratio of all residents to sex offenders in zip code 45236 is 1,176 to 1. The ratio of registered sex offenders to all residents in this zip code is lower than the state average.
Median resident age:
This zip code:
41.9 years
Ohio median age:
39.9 years
Average household size:
This zip code:
2.1 people
Ohio:
2.4 people
Averages for the 2020 tax year for zip code 45236, filed in 2021:
Average Adjusted Gross Income (AGI) in 2020: $77,994 (Individual Income Tax Returns)
Here:
$77,994
State:
$67,288
Salary/wage: $63,002 (reported on 81.8% of returns)
Here:
$63,002
State:
$55,628
(% of AGI for various income ranges: 1171.5% for AGIs below $25k, 3838.9% for AGIs $25k-50k, 6834.6% for AGIs $50k-75k, 10132.1% for AGIs $75k-100k, 17976.1% for AGIs $100k-200k, 90600.0% for AGIs over 200k)
Taxable interest for individuals: $1,912 (reported on 30.6% of returns)
This zip code:
$1,912
Ohio:
$1,518
(% of AGI for various income ranges: 18.5% for AGIs below $25k, 19.4% for AGIs $25k-50k, 32.5% for AGIs $50k-75k, 84.7% for AGIs $75k-100k, 113.5% for AGIs $100k-200k, 2470.0% for AGIs over 200k)
Ordinary dividends: $11,059 (reported on 28.5% of returns)
Here:
$11,059
State:
$7,167
(% of AGI for various income ranges: 49.0% for AGIs below $25k, 67.8% for AGIs $25k-50k, 169.2% for AGIs $50k-75k, 298.9% for AGIs $75k-100k, 808.0% for AGIs $100k-200k, 14192.9% for AGIs over 200k)
Net capital gain/loss in AGI: +$23,540 (reported on 22.9% of returns)
Here:
+$23,540
State:
+$18,919
(% of AGI for various income ranges: 14.3% for AGIs below $25k, 44.3% for AGIs $25k-50k, 132.1% for AGIs $50k-75k, 242.6% for AGIs $75k-100k, 836.0% for AGIs $100k-200k, 32387.1% for AGIs over 200k)
Profit/loss from business: +$15,507 (reported on 13.7% of returns)
Here:
+$15,507
State:
+$13,744
(% of AGI for various income ranges: 112.5% for AGIs below $25k, 106.3% for AGIs $25k-50k, 165.8% for AGIs $50k-75k, 327.8% for AGIs $75k-100k, 621.3% for AGIs $100k-200k, 5929.4% for AGIs over 200k)
Taxable individual retirement arrangement distribution: $21,675 (reported on 10.8% of returns)
45236:
$21,675
Ohio:
$18,876
(% of AGI for various income ranges: 87.1% for AGIs below $25k, 125.5% for AGIs $25k-50k, 235.2% for AGIs $50k-75k, 478.0% for AGIs $75k-100k, 973.4% for AGIs $100k-200k, 4047.1% for AGIs over 200k)
Self-employed (Keogh) retirement plans: $22,850 (reported on 0.8% of returns)
45236:
$22,850
Ohio:
$24,898
(% of AGI for various income ranges: 53.4% for AGIs $100k-200k, 1020.6% for AGIs over 200k)
Total itemized deductions: $33,457 (reported on 7.6% of returns)
Here:
$33,457
State:
$33,869
(% of AGI for various income ranges: 42.1% for AGIs below $25k, 76.6% for AGIs $25k-50k, 213.1% for AGIs $50k-75k, 391.2% for AGIs $75k-100k, 886.0% for AGIs $100k-200k, 8116.5% for AGIs over 200k)
Charity contributions: $13,556 (reported on 6.0% of returns)
Here:
$13,556
State:
$14,577
(% of AGI for various income ranges: 3.3% for AGIs below $25k, 11.8% for AGIs $25k-50k, 30.5% for AGIs $50k-75k, 74.0% for AGIs $75k-100k, 206.4% for AGIs $100k-200k, 3987.6% for AGIs over 200k)
Taxes paid: $7,744 (reported on 7.5% of returns)
45236:
$7,744
State:
$7,681
(% of AGI for various income ranges: 6.2% for AGIs below $25k, 14.7% for AGIs $25k-50k, 61.2% for AGIs $50k-75k, 124.0% for AGIs $75k-100k, 244.0% for AGIs $100k-200k, 1397.6% for AGIs over 200k)
Earned income credit: $1,889 (reported on 9.5% of returns)
Here:
$1,889
State:
$2,304
(% of AGI for various income ranges: 63.0% for AGIs below $25k, 37.2% for AGIs $25k-50k)
Percentage of individuals using paid preparers for their 2020 taxes: 92.2%
Here:
92%
State:
94%
(% for various income ranges: 89.8% for AGIs below $25k, 93.6% for AGIs $25k-50k, 92.9% for AGIs $50k-75k, 93.4% for AGIs $75k-100k, 92.1% for AGIs $100k-200k, 92.4% for AGIs over 200k)
Averages for the 2012 tax year for zip code 45236, filed in 2013:
Average Adjusted Gross Income (AGI) in 2012: $59,872 (Individual Income Tax Returns)
Here:
$59,872
State:
$54,926
Salary/wage: $50,152 (reported on 82.2% of returns)
Here:
$50,152
State:
$45,869
(% of AGI for various income ranges: 69.5% for AGIs below $25k, 79.9% for AGIs $25k-50k, 76.8% for AGIs $50k-75k, 75.8% for AGIs $75k-100k, 72.0% for AGIs $100k-200k, 49.2% for AGIs over 200k)
Taxable interest for individuals: $1,941 (reported on 34.6% of returns)
This zip code:
$1,941
Ohio:
$1,297
(% of AGI for various income ranges: 1.3% for AGIs below $25k, 0.6% for AGIs $25k-50k, 0.6% for AGIs $50k-75k, 0.7% for AGIs $75k-100k, 0.6% for AGIs $100k-200k, 2.4% for AGIs over 200k)
Ordinary dividends: $7,637 (reported on 28.7% of returns)
Here:
$7,637
State:
$5,821
(% of AGI for various income ranges: 3.5% for AGIs below $25k, 2.0% for AGIs $25k-50k, 2.7% for AGIs $50k-75k, 2.8% for AGIs $75k-100k, 3.9% for AGIs $100k-200k, 5.8% for AGIs over 200k)
Net capital gain/loss in AGI: +$7,003 (reported on 20.1% of returns)
Here:
+$7,003
State:
+$11,232
(% of AGI for various income ranges: 0.2% for AGIs below $25k, 0.3% for AGIs $25k-50k, 0.7% for AGIs $50k-75k, 0.7% for AGIs $75k-100k, 2.5% for AGIs $100k-200k, 6.3% for AGIs over 200k)
Profit/loss from business: +$14,852 (reported on 12.8% of returns)
Here:
+$14,852
State:
+$12,773
(% of AGI for various income ranges: 7.3% for AGIs below $25k, 2.2% for AGIs $25k-50k, 2.2% for AGIs $50k-75k, 2.3% for AGIs $75k-100k, 3.4% for AGIs $100k-200k, 3.6% for AGIs over 200k)
Taxable individual retirement arrangement distribution: $20,570 (reported on 12.8% of returns)
45236:
$20,570
Ohio:
$14,511
(% of AGI for various income ranges: 4.3% for AGIs below $25k, 2.8% for AGIs $25k-50k, 3.6% for AGIs $50k-75k, 4.2% for AGIs $75k-100k, 4.9% for AGIs $100k-200k, 5.8% for AGIs over 200k)
Self-employment retirement plans: $21,670 (reported on 0.8% of returns)
45236:
$21,670
Ohio:
$20,257
(% of AGI for various income ranges: 0.2% for AGIs $50k-75k, 0.3% for AGIs $100k-200k, 0.8% for AGIs over 200k)
Total itemized deductions: $20,737 (19% of AGI, reported on 35.4% of returns)
Here:
$20,737
State:
$21,278
Here:
19.1% of AGI
State:
18.8% of AGI
(% of AGI for various income ranges: 9.8% for AGIs below $25k, 10.0% for AGIs $25k-50k, 11.8% for AGIs $50k-75k, 12.9% for AGIs $75k-100k, 13.9% for AGIs $100k-200k, 13.0% for AGIs over 200k)
Charity contributions: $3,914 (reported on 27.8% of returns)
Here:
$3,914
State:
$3,943
(% of AGI for various income ranges: 0.7% for AGIs below $25k, 1.0% for AGIs $25k-50k, 1.3% for AGIs $50k-75k, 1.6% for AGIs $75k-100k, 2.0% for AGIs $100k-200k, 2.9% for AGIs over 200k)
Taxes paid: $8,839 (reported on 35.3% of returns)
45236:
$8,839
State:
$9,568
(% of AGI for various income ranges: 2.1% for AGIs below $25k, 2.9% for AGIs $25k-50k, 4.5% for AGIs $50k-75k, 5.0% for AGIs $75k-100k, 6.5% for AGIs $100k-200k, 7.2% for AGIs over 200k)
Earned income credit: $1,924 (reported on 12.8% of returns)
Here:
$1,924
State:
$2,285
(% of AGI for various income ranges: 4.4% for AGIs below $25k, 0.6% for AGIs $25k-50k)
Percentage of individuals using paid preparers for their 2012 taxes: 46.4%
Here:
46%
State:
51%
(% for various income ranges: 42.4% for AGIs below $25k, 44.2% for AGIs $25k-50k, 47.9% for AGIs $50k-75k, 48.0% for AGIs $75k-100k, 54.1% for AGIs $100k-200k, 72.5% for AGIs over 200k)
Averages for the 2004 tax year for zip code 45236, filed in 2005:
Average Adjusted Gross Income (AGI) in 2004: $54,374 (Individual Income Tax Returns)
Here:
$54,374
State:
$44,480
Salary/wage: $42,643 (reported on 80.9% of returns)
Here:
$42,643
State:
$39,198
(% of AGI for various income ranges: 131.1% for AGIs below $10k, 69.2% for AGIs $10k-25k, 79.9% for AGIs $25k-50k, 78.5% for AGIs $50k-75k, 74.4% for AGIs $75k-100k, 44.6% for AGIs over 100k)
Taxable interest for individuals: $2,461 (reported on 48.9% of returns)
This zip code:
$2,461
Ohio:
$1,532
(% of AGI for various income ranges: 9.1% for AGIs below $10k, 3.5% for AGIs $10k-25k, 1.8% for AGIs $25k-50k, 1.5% for AGIs $50k-75k, 1.5% for AGIs $75k-100k, 2.5% for AGIs over 100k)
Taxable dividends: $6,882 (reported on 34.2% of returns)
Here:
$6,882
State:
$3,496
(% of AGI for various income ranges: 10.4% for AGIs below $10k, 3.7% for AGIs $10k-25k, 2.3% for AGIs $25k-50k, 3.1% for AGIs $50k-75k, 3.5% for AGIs $75k-100k, 5.9% for AGIs over 100k)
Net capital gain/loss: +$12,899 (reported on 25.0% of returns)
Here:
+$12,899
State:
+$8,582
(% of AGI for various income ranges: -1.6% for AGIs below $10k, 0.6% for AGIs $10k-25k, 0.7% for AGIs $25k-50k, 1.2% for AGIs $50k-75k, 2.1% for AGIs $75k-100k, 12.3% for AGIs over 100k)
Profit/loss from business: +$13,658 (reported on 11.8% of returns)
Here:
+$13,658
State:
+$10,813
(% of AGI for various income ranges: 6.0% for AGIs below $10k, 4.3% for AGIs $10k-25k, 2.1% for AGIs $25k-50k, 2.4% for AGIs $50k-75k, 4.0% for AGIs $75k-100k, 3.0% for AGIs over 100k)
IRA payment deduction: $2,726 (reported on 2.3% of returns)
45236:
$2,726
Ohio:
$2,794
(% of AGI for various income ranges: 0.4% for AGIs below $10k, 0.2% for AGIs $10k-25k, 0.2% for AGIs $25k-50k, 0.1% for AGIs $50k-75k, 0.1% for AGIs $75k-100k, 0.0% for AGIs over 100k)
Self-employed pension: $15,560 (reported on 1.0% of returns)
Here:
$15,560
Ohio:
$13,981
(% of AGI for various income ranges: 0.1% for AGIs $25k-50k, 0.1% for AGIs $50k-75k, 0.3% for AGIs $75k-100k, 0.5% for AGIs over 100k)
Total itemized deductions: $18,682 (19% of AGI, reported on 40.2% of returns)
Here:
$18,682
State:
$17,503
Here:
19.1% of AGI
State:
20.8% of AGI
(% of AGI for various income ranges: 19.6% for AGIs below $10k, 11.2% for AGIs $10k-25k, 12.4% for AGIs $25k-50k, 15.4% for AGIs $50k-75k, 16.1% for AGIs $75k-100k, 13.5% for AGIs over 100k)
Charity contributions deductions: $3,850 (4% of AGI, reported on 34.5% of returns)
Here:
$3,850
State:
$3,087
Here:
3.6% of AGI
State:
3.4% of AGI
(% of AGI for various income ranges: 1.5% for AGIs below $10k, 1.1% for AGIs $10k-25k, 1.5% for AGIs $25k-50k, 1.9% for AGIs $50k-75k, 2.5% for AGIs $75k-100k, 3.3% for AGIs over 100k)
Total tax: $9,577 (reported on 80.6% of returns)
45236:
$9,577
State:
$6,781
(% of AGI for various income ranges: 3.6% for AGIs below $10k, 4.6% for AGIs $10k-25k, 8.0% for AGIs $25k-50k, 9.9% for AGIs $50k-75k, 11.2% for AGIs $75k-100k, 21.3% for AGIs over 100k)
Earned income credit: $1,488 (reported on 8.7% of returns)
Here:
$1,488
State:
$1,696
Percentage of individuals using paid preparers for their 2004 taxes: 47.8%
Here:
48%
State:
55%
(% for various income ranges: 40.4% for AGIs below $10k, 46.6% for AGIs $10k-25k, 48.4% for AGIs $25k-50k, 49.6% for AGIs $50k-75k, 47.1% for AGIs $75k-100k, 61.4% for AGIs over 100k)
Likely homosexual households (counted as self-reported same-sex unmarried-partner households)
Lesbian couples: 0.2% of all households
Gay men: 0.4% of all households
Household received Food Stamps/SNAP in the past 12 months: 416 Household did not receive Food Stamps/SNAP in the past 12 months: 11,133
Women who had a birth in the past 12 months: 444 (337 now married, 109 unmarried) Women who did not have a birth in the past 12 months: 4,694 (2,186 now married, 2,507 unmarried)
Housing units in zip code 45236 with a mortgage: 5,272 (574 second mortgage, 14 home equity loan, 490 both second mortgage and home equity loan) Houses without a mortgage: 118
Median monthly owner costs for units with a mortgage: $1,417 Median monthly owner costs for units without a mortgage: $663
Residents with income below the poverty level in 2022:
This zip code:
8.3%
Whole state:
13.4%
Residents with income below 50% of the poverty level in 2022:
This zip code:
5.2%
Whole state:
7.0%
Median number of rooms in houses and condos:
Here:
6.7
State:
6.7
Median number of rooms in apartments:
Here:
4.0
State:
4.4
Notable locations in this zip code not listed on our city pages
Notable locations in zip code 45236: Saint Theresa Home for the Aged (A), Silverton Memorial Municipal Building (B), Deer Park - Silverton Joint Fire District (C), Deer Park Municipal Building (D), Sycamore Township Government Center (E), Silverton Police Department (F), Sycamore Township Fire Department Station 92 (G). Display/hide their locations on the map
Shopping Centers: Blue Ash Commons Shopping Center (1), Dillonvale Shopping Center (2), Kenwood Towne Centre Shopping Center (3), Kenwood Mall Shopping Center (4), Blue Ash Shopping Center (5). Display/hide their locations on the map
Churches in zip code 45236 include: All Saints Roman Catholic Church (A), Mount Carmel Baptist Church (B), Calvary Baptist Church (C), Silverwood Presbyterian Church (D), Saint John the Evangelist Roman Catholic Church (E), Olivet Baptist Church (F), Mount Sinai Baptist Church (G), Lutheran Church of Our Redeemer (H), Mount Carmel Korean Baptist Church (I). Display/hide their locations on the map
In group quarters: 605 (-1 institutionalized population)
Size of family households: 3,240 2-persons, 1,285 3-persons, 1,086 4-persons, 317 5-persons, 123 6-persons, 32 7-or-more-persons
Size of nonfamily households: 4,343 1-person, 1,077 2-persons, 113 3-persons
3,098 married couples with children.
1,011 single-parent households (307 men, 704 women).
92.4% of residents of 45236 zip code speak English at home.
2.3% of residents speak Spanish at home (65% very well, 30% well, 6% not well).
2.8% of residents speak other Indo-European language at home (73% very well, 25% well, 2% not well).
2.3% of residents speak Asian or Pacific Island language at home (64% very well, 25% well, 9% not well, 2% not at all).
0.2% of residents speak other language at home (41% very well, 59% well).
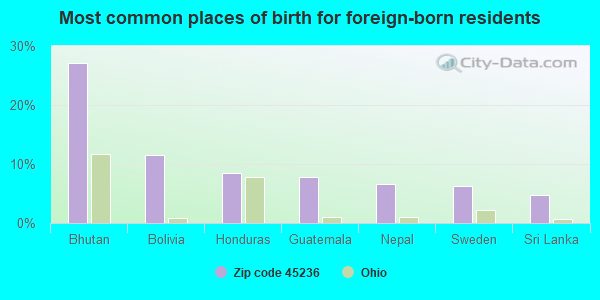
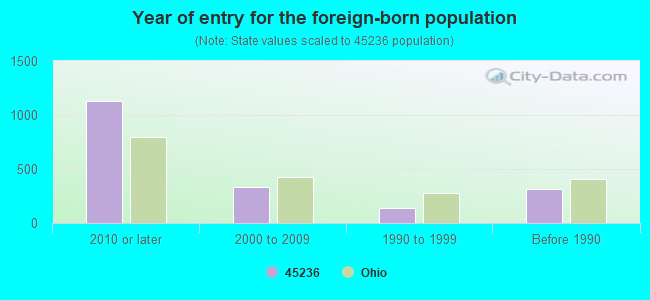
Foreign born population: 1,621 (6.6%) (40.9% of them are naturalized citizens)
Facilities with environmental interests located in this zip code:
BLUE ASH AUTO BODY INC (11110 LUSCHEK DR in BLUE ASH, OH)
STATE MASTER (Ohio general info) - AIR MAJOR Small Quantity Generators, between 100 kg and 1000 kg of hazardous waste/month (Resource Conservation and Recovery Act (tracking hazardous waste)) - notification Organizations: WURTZ STEPHEN SOLE STOCKHOLDER (CONTACT/OWNER)
BLUE ASH BP * (9190 PLAINFIELD ROAD in CINCINNATI, OH)
STATE MASTER (Ohio general info) - AIR MAJOR, RCRA-OHD987027943, HAZARDOUS WASTE PROGRAM Small Quantity Generators, between 100 kg and 1000 kg of hazardous waste/month (Resource Conservation and Recovery Act (tracking hazardous waste)) - notification Organizations: BP OIL CO (CONTACT/OWNER)
, BP OIL COMPANY (CONTACT/OWNER)
Alternative names: BP OIL CO SITE 08758
BP OIL CO SITE 09079 (7896 MONTGOMERY RD in CINCINNATI, OH)
STATE MASTER (Ohio general info) - RCRA-OHD987027406, HAZARDOUS WASTE PROGRAM Conditionally Exempt Small Quantity Generators, less than 100 kg/month of hazardous waste (Resource Conservation and Recovery Act (tracking hazardous waste)) - notification Organizations: BP OIL COMPANY (CONTACT/OWNER)
BP OIL NO 09026 (7799 MONTGOMERY RD in CINCINNATI, OH)
STATE MASTER (Ohio general info) - AIR MAJOR, -31-5541-1038-Q, EPCRA, RCRA-OHD987028883, HAZARDOUS WASTE PROGRAM Conditionally Exempt Small Quantity Generators, less than 100 kg/month of hazardous waste (Resource Conservation and Recovery Act (tracking hazardous waste)) - notification Organizations: BP OIL CO (CONTACT/OWNER)
, BP OIL COMPANY (CONTACT/OWNER)
Alternative names: BP OIL CO SITE 09026
BP OIL NO 09078 (8020 MONTGOMERY RD in CINCINNATI, OH)
STATE MASTER (Ohio general info) - AIR MAJOR, -315541-1038-EE, EPCRA, RCRA-OHD987028891, HAZARDOUS WASTE PROGRAM Conditionally Exempt Small Quantity Generators, less than 100 kg/month of hazardous waste (Resource Conservation and Recovery Act (tracking hazardous waste)) - notification Organizations: BP OIL CO (CONTACT/OWNER)
, BP OIL COMPANY (CONTACT/OWNER)
Alternative names: BP OIL CO SITE 09078
BLUE ASH ELEMENTARY SCHOOL (9541 PLAINFIELD RD in CINCINNATI, OH)
(Geographic Names Information System) (National Center for Education Statistics) - STATE ID-002998 Organizations: SYCAMORE COMMUNITY CITY SD (SCHOOL DISTRICT)
BP OIL CO SITE 09171 (8121 PLAINFIELD in CINCINNATI, OH)
(Resource Conservation and Recovery Act (tracking hazardous waste)) Organizations: BP OIL COMPANY (CONTACT/OWNER)
AAMCO TRANSMISSIONS (6715 MONTGOMERY RD in CINCINNATI, OH)
Small Quantity Generators, between 100 kg and 1000 kg of hazardous waste/month (Resource Conservation and Recovery Act (tracking hazardous waste)) - notification Organizations: LONG DAN (CONTACT/OWNER)
Housing units lacking complete plumbing facilities: 0.6% Housing units lacking complete kitchen facilities: 1.7%
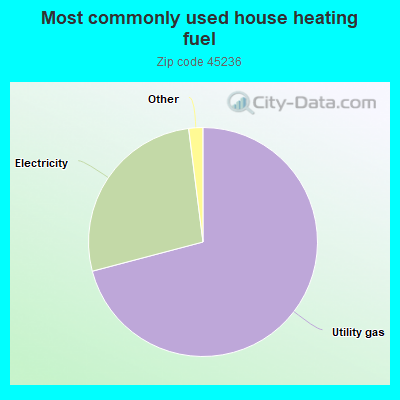
70.9%Utility gas
27.1%Electricity
0.9%Bottled, tank, or LP gas
0.7%Other fuel
Population in 1990: 26,113.
Place of birth for U.S.-born residents:
This state: 17,302
Northeast: 786
Midwest: 1,440
South: 2,561
West: 513
61% of the 45236 zip code residents lived in the same house 5 years ago. Out of people who lived in different houses, 70% lived in this county. Out of people who lived in different counties, 50% lived in Ohio.
88% of the 45236 zip code residents lived in the same house 1 year ago. Out of people who lived in different houses, 68% moved from this county. Out of people who lived in different houses, 15% moved from different county within same state. Out of people who lived in different houses, 9% moved from different state. Out of people who lived in different houses, 5% moved from abroad.
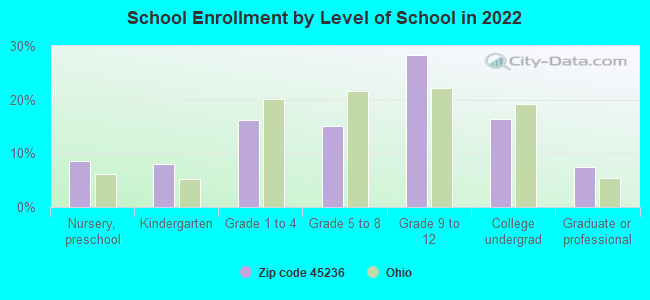
Private vs. public school enrollment:
Students in private schools in grades 1 to 8 (elementary and middle school): 325
Here:
23.1%
Ohio:
16.0%
Students in private schools in grades 9 to 12 (high school): 312
Here:
24.7%
Ohio:
13.1%
Students in private undergraduate colleges: 193
Here:
26.5%
Ohio:
22.3%
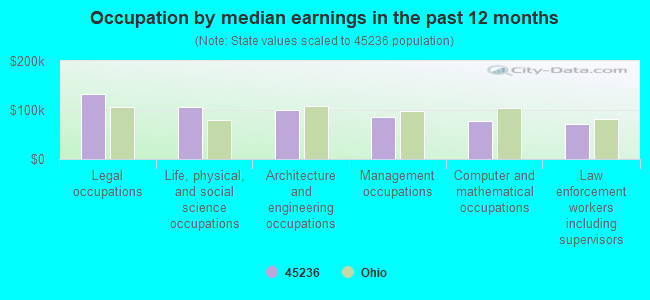
Occupation by median earnings in the past 12 months ($)
131,784Legal occupations
106,893Life, physical, and social science occupations
100,184Architecture and engineering occupations
86,298Management occupations
77,965Computer and mathematical occupations
72,100Law enforcement workers including supervisors
Companies with federal contracts located in this zip code (CINCINNATI, OH):
OFFICEWARE, INC (8050 HOSBROOK ROAD SUITE 2; small business) : $1,680,440 in 22 contractsfrom 2002 to 2006
Contracts for Printing, Duplicating, and Bookbinding Equipment, Lease or Rental of Equipment -- Office Machines, Text Processing Systems and Visible Record Equipment, Miscellaneous Office Machines, Lease or Rental of Equipment -- Office Supplies and Devices, and moreby Army, Federal Emergency Management Agency, Forest Service Signed by year:2000: $0; 2001: $0; 2002: $79,678; 2003: $671,713; 2004: $719,994; 2005: $204,470; 2006: $4,585.
Biggest contracts:
$556,805 with Army for Printing, Duplicating, and Bookbinding Equipment. Taking place in TN. Signed on 2004-11-10. Completion date: 2005-09-30.
$555,805 with Army for Printing, Duplicating, and Bookbinding Equipment. Signed on 2003-11-18. Completion date: 2004-09-30.
$73,731 with Army for Lease or Rental of Equipment -- Office Machines, Text Processing Systems and Visible Record Equipment. Taking place in TN. Signed on 2005-10-06. Completion date: 2006-09-30.
$70,852, same as above.Signed on 2004-10-01. Completion date: 2005-09-30.
MILLS, STEVEN (2613 MAPLE TREE CT; small business) : $47,237 in 17 contractsfrom 2003 to 2004
Contracts for Custodial Janitorial Services, Landscaping/Groundskeeping Services by Army Signed by year:2000: $0; 2001: $0; 2002: $0; 2003: $30,582; 2004: $16,655; 2005: $0; 2006: $0.
Biggest contracts:
$14,232 with Army for Custodial Janitorial Services. Signed on 2003-02-15. Completion date: 2004-02-28.
$5,020 with Army for Landscaping/Groundskeeping Services. Signed on 2004-03-20. Completion date: 2004-03-31.
$5,020, same as above.Signed on 2003-03-16. Completion date: 2004-03-31.
$4,490, same as above.Signed on 2004-03-20. Completion date: 2004-03-31.
LARRYS LOCK SAFE AND SECURITY CENTERS INCORPORATED (8005 PLAINFIELD RD; small business) 24 employees, $2275000 revenue. : $9,695 in 3 contractsin 2003
$9,695 with U.S. Army Corps of Engineers - civil program financing only for Miscellaneous Materials Handling Equipment. Signed on 2003-08-14. Completion date: 2003-08-29.
$0 with Public Buildings Service for Guard Services. Signed on 2003-11-13. Completion date: 2004-12-01.
$0, same as above.Signed on 2003-11-13. Completion date: 2004-12-01.
CARDINAL SOLUTIONS GROUP INC (8044 MONTGOMERY RD, STE-56; small business) : $0 in 2 contractsin 2005
$8,000 with Air Force for Other Education and Training Services. Taking place in TX. Signed on 2005-08-04. Completion date: 2005-08-16.
-$8,000 with Air Force for Other ADP and Telecommunications Services (includes data storage on tapes, compact disks, etc.). Taking place in TX. Signed on 2005-08-09. Completion date: 2005-08-18.
Top industries in this zip code by the number of employees in 2005:
Health Care and Social Assistance: General Medical and Surgical Hospitals (over 1000: 1)
Administrative and Support and Waste Management and Remediation Services: Temporary Help Services (250-499: 2, 50-99: 2, 20-49: 4, 1-4: 2)
Health Care and Social Assistance: Home Health Care Services (250-499: 1, 100-249: 2, 50-99: 2, 20-49: 1, 10-19: 1, 5-9: 1)
Health Care and Social Assistance: Offices of Physicians (except Mental Health Specialists) (100-249: 1, 50-99: 3, 20-49: 5, 10-19: 6, 5-9: 11, 1-4: 14)
Administrative and Support and Waste Management and Remediation Services: Packaging and Labeling Services (500-999: 1, 1-4: 1)
2002 - 2018 National Fire Incident Reporting System (NFIRS) incidents
According to the data from the years 2002 - 2018 the average number of fire incidents per year is 128. The highest number of fires - 223 took place in 2008, and the least - 74 in 2015. The data has a dropping trend.
When looking into fire subcategories, the most incidents belonged to: Structure Fires (64.8%), and Outside Fires (19.9%).
Fire incident types reported to NFIRS in Zip Code 45236


 Nearest zip codes: 45213, 45242, 45227, 45237, 45209, 45243.


 According to the data from the years 2002 - 2018 the average number of fire incidents per year is 128. The highest number of fires - 223 took place in 2008, and the least - 74 in 2015. The data has a dropping trend.
 When looking into fire subcategories, the most incidents belonged to: Structure Fires (64.8%), and Outside Fires (19.9%).