Estimated zip code population in 2022: 11,654
Zip code population in 2010: 12,013
Zip code population in 2000: 13,638
Houses and condos: 6,054
Renter-occupied apartments: 2,420
% of renters here:
42%State:
33%
March 2022 cost of living index in zip code 45213: 89.1
(less than average, U.S. average is 100)
Land area: 3.2
sq. mi.
Water area: 0.0
sq. mi.
Population density: 3,685 people per square mile (average).
OSM Map
General Map
Google Map
MSN Map
OSM Map
General Map
Google Map
MSN Map
OSM Map
General Map
Google Map
MSN Map
OSM Map
General Map
Google Map
MSN Map
Please wait while loading the map...
Real estate property taxes paid for housing units in 2022:
This zip code:
1.6% ($4,238)Ohio:
1.3% ($2,639)
Median real estate property taxes paid for housing units with mortgages in 2022: $4,404 (1.6%)
Median real estate property taxes paid for housing units with no mortgage in 2022: $3,789 (1.6%)
Profiles of local businesses
Business Search - 14 Million verified businesses
Males: 5,556 Females: 6,097
For population 25 years and over in 45213:
High school or higher: 95.1%Bachelor's degree or higher: 53.4%Graduate or professional degree: 24.1%Unemployed: 3.6%Mean travel time to work (commute): 23.0 minutes
For population 15 years and over in 45213:
Never married: 39.0%Now married: 44.2%Separated: 1.1%Widowed: 7.5%Divorced: 8.2%
Zip code 45213 compared to state average:
Black race population percentage significantly above state average. Length of stay since moving in above state average. House age above state average. Percentage of population with a bachelor's degree or higher above state average. 5,883 50.5% White 4,260 36.6% Black 555 4.8% Two or more races 536 4.6% Hispanic or Latino 220 1.9% Some other race 187 1.6% Asian 10 0.09% American Indian
Data:
Median household income ($)
Median household income (% change since 2000)
Household income diversity
Ratio of average income to average house value (%)
Ratio of average income to average rent
Median household income ($) - White
Median household income ($) - Black or African American
Median household income ($) - Asian
Median household income ($) - Hispanic or Latino
Median household income ($) - American Indian and Alaska Native
Median household income ($) - Multirace
Median household income ($) - Other Race
Median household income for houses/condos with a mortgage ($)
Median household income for apartments without a mortgage ($)
Races - White alone (%)
Races - White alone (% change since 2000)
Races - Black alone (%)
Races - Black alone (% change since 2000)
Races - American Indian alone (%)
Races - American Indian alone (% change since 2000)
Races - Asian alone (%)
Races - Asian alone (% change since 2000)
Races - Hispanic (%)
Races - Hispanic (% change since 2000)
Races - Native Hawaiian and Other Pacific Islander alone (%)
Races - Native Hawaiian and Other Pacific Islander alone (% change since 2000)
Races - Two or more races (%)
Races - Two or more races (% change since 2000)
Races - Other race alone (%)
Races - Other race alone (% change since 2000)
Racial diversity
Unemployment (%)
Unemployment (% change since 2000)
Unemployment (%) - White
Unemployment (%) - Black or African American
Unemployment (%) - Asian
Unemployment (%) - Hispanic or Latino
Unemployment (%) - American Indian and Alaska Native
Unemployment (%) - Multirace
Unemployment (%) - Other Race
Population density (people per square mile)
Population - Males (%)
Population - Females (%)
Population - Males (%) - White
Population - Males (%) - Black or African American
Population - Males (%) - Asian
Population - Males (%) - Hispanic or Latino
Population - Males (%) - American Indian and Alaska Native
Population - Males (%) - Multirace
Population - Males (%) - Other Race
Population - Females (%) - White
Population - Females (%) - Black or African American
Population - Females (%) - Asian
Population - Females (%) - Hispanic or Latino
Population - Females (%) - American Indian and Alaska Native
Population - Females (%) - Multirace
Population - Females (%) - Other Race
Coronavirus confirmed cases (Apr 27, 2024)
Deaths caused by coronavirus (Apr 27, 2024)
Coronavirus confirmed cases (per 100k population) (Apr 27, 2024)
Deaths caused by coronavirus (per 100k population) (Apr 27, 2024)
Daily increase in number of cases (Apr 27, 2024)
Weekly increase in number of cases (Apr 27, 2024)
Cases doubled (in days) (Apr 27, 2024)
Hospitalized patients (Apr 18, 2022)
Negative test results (Apr 18, 2022)
Total test results (Apr 18, 2022)
COVID Vaccine doses distributed (per 100k population) (Sep 19, 2023)
COVID Vaccine doses administered (per 100k population) (Sep 19, 2023)
COVID Vaccine doses distributed (Sep 19, 2023)
COVID Vaccine doses administered (Sep 19, 2023)
Likely homosexual households (%)
Likely homosexual households (% change since 2000)
Likely homosexual households - Lesbian couples (%)
Likely homosexual households - Lesbian couples (% change since 2000)
Likely homosexual households - Gay men (%)
Likely homosexual households - Gay men (% change since 2000)
Cost of living index
Median gross rent ($)
Median contract rent ($)
Median monthly housing costs ($)
Median house or condo value ($)
Median house or condo value ($ change since 2000)
Mean house or condo value by units in structure - 1, detached ($)
Mean house or condo value by units in structure - 1, attached ($)
Mean house or condo value by units in structure - 2 ($)
Mean house or condo value by units in structure by units in structure - 3 or 4 ($)
Mean house or condo value by units in structure - 5 or more ($)
Mean house or condo value by units in structure - Boat, RV, van, etc. ($)
Mean house or condo value by units in structure - Mobile home ($)
Median house or condo value ($) - White
Median house or condo value ($) - Black or African American
Median house or condo value ($) - Asian
Median house or condo value ($) - Hispanic or Latino
Median house or condo value ($) - American Indian and Alaska Native
Median house or condo value ($) - Multirace
Median house or condo value ($) - Other Race
Median resident age
Resident age diversity
Median resident age - Males
Median resident age - Females
Median resident age - White
Median resident age - Black or African American
Median resident age - Asian
Median resident age - Hispanic or Latino
Median resident age - American Indian and Alaska Native
Median resident age - Multirace
Median resident age - Other Race
Median resident age - Males - White
Median resident age - Males - Black or African American
Median resident age - Males - Asian
Median resident age - Males - Hispanic or Latino
Median resident age - Males - American Indian and Alaska Native
Median resident age - Males - Multirace
Median resident age - Males - Other Race
Median resident age - Females - White
Median resident age - Females - Black or African American
Median resident age - Females - Asian
Median resident age - Females - Hispanic or Latino
Median resident age - Females - American Indian and Alaska Native
Median resident age - Females - Multirace
Median resident age - Females - Other Race
Commute - mean travel time to work (minutes)
Travel time to work - Less than 5 minutes (%)
Travel time to work - Less than 5 minutes (% change since 2000)
Travel time to work - 5 to 9 minutes (%)
Travel time to work - 5 to 9 minutes (% change since 2000)
Travel time to work - 10 to 19 minutes (%)
Travel time to work - 10 to 19 minutes (% change since 2000)
Travel time to work - 20 to 29 minutes (%)
Travel time to work - 20 to 29 minutes (% change since 2000)
Travel time to work - 30 to 39 minutes (%)
Travel time to work - 30 to 39 minutes (% change since 2000)
Travel time to work - 40 to 59 minutes (%)
Travel time to work - 40 to 59 minutes (% change since 2000)
Travel time to work - 60 to 89 minutes (%)
Travel time to work - 60 to 89 minutes (% change since 2000)
Travel time to work - 90 or more minutes (%)
Travel time to work - 90 or more minutes (% change since 2000)
Marital status - Never married (%)
Marital status - Now married (%)
Marital status - Separated (%)
Marital status - Widowed (%)
Marital status - Divorced (%)
Median family income ($)
Median family income (% change since 2000)
Median non-family income ($)
Median non-family income (% change since 2000)
Median per capita income ($)
Median per capita income (% change since 2000)
Median family income ($) - White
Median family income ($) - Black or African American
Median family income ($) - Asian
Median family income ($) - Hispanic or Latino
Median family income ($) - American Indian and Alaska Native
Median family income ($) - Multirace
Median family income ($) - Other Race
Median year house/condo built
Median year apartment built
Year house built - Built 2005 or later (%)
Year house built - Built 2000 to 2004 (%)
Year house built - Built 1990 to 1999 (%)
Year house built - Built 1980 to 1989 (%)
Year house built - Built 1970 to 1979 (%)
Year house built - Built 1960 to 1969 (%)
Year house built - Built 1950 to 1959 (%)
Year house built - Built 1940 to 1949 (%)
Year house built - Built 1939 or earlier (%)
Average household size
Household density (households per square mile)
Average household size - White
Average household size - Black or African American
Average household size - Asian
Average household size - Hispanic or Latino
Average household size - American Indian and Alaska Native
Average household size - Multirace
Average household size - Other Race
Occupied housing units (%)
Vacant housing units (%)
Owner occupied housing units (%)
Renter occupied housing units (%)
Vacancy status - For rent (%)
Vacancy status - For sale only (%)
Vacancy status - Rented or sold, not occupied (%)
Vacancy status - For seasonal, recreational, or occasional use (%)
Vacancy status - For migrant workers (%)
Vacancy status - Other vacant (%)
Residents with income below the poverty level (%)
Residents with income below 50% of the poverty level (%)
Children below poverty level (%)
Poor families by family type - Married-couple family (%)
Poor families by family type - Male, no wife present (%)
Poor families by family type - Female, no husband present (%)
Poverty status for native-born residents (%)
Poverty status for foreign-born residents (%)
Poverty among high school graduates not in families (%)
Poverty among people who did not graduate high school not in families (%)
Residents with income below the poverty level (%) - White
Residents with income below the poverty level (%) - Black or African American
Residents with income below the poverty level (%) - Asian
Residents with income below the poverty level (%) - Hispanic or Latino
Residents with income below the poverty level (%) - American Indian and Alaska Native
Residents with income below the poverty level (%) - Multirace
Residents with income below the poverty level (%) - Other Race
Air pollution - Air Quality Index (AQI)
Air pollution - CO
Air pollution - NO2
Air pollution - SO2
Air pollution - Ozone
Air pollution - PM10
Air pollution - PM25
Air pollution - Pb
Crime - Murders per 100,000 population
Crime - Rapes per 100,000 population
Crime - Robberies per 100,000 population
Crime - Assaults per 100,000 population
Crime - Burglaries per 100,000 population
Crime - Thefts per 100,000 population
Crime - Auto thefts per 100,000 population
Crime - Arson per 100,000 population
Crime - City-data.com crime index
Crime - Violent crime index
Crime - Property crime index
Crime - Murders per 100,000 population (5 year average)
Crime - Rapes per 100,000 population (5 year average)
Crime - Robberies per 100,000 population (5 year average)
Crime - Assaults per 100,000 population (5 year average)
Crime - Burglaries per 100,000 population (5 year average)
Crime - Thefts per 100,000 population (5 year average)
Crime - Auto thefts per 100,000 population (5 year average)
Crime - Arson per 100,000 population (5 year average)
Crime - City-data.com crime index (5 year average)
Crime - Violent crime index (5 year average)
Crime - Property crime index (5 year average)
1996 Presidential Elections Results (%) - Democratic Party (Clinton)
1996 Presidential Elections Results (%) - Republican Party (Dole)
1996 Presidential Elections Results (%) - Other
2000 Presidential Elections Results (%) - Democratic Party (Gore)
2000 Presidential Elections Results (%) - Republican Party (Bush)
2000 Presidential Elections Results (%) - Other
2004 Presidential Elections Results (%) - Democratic Party (Kerry)
2004 Presidential Elections Results (%) - Republican Party (Bush)
2004 Presidential Elections Results (%) - Other
2008 Presidential Elections Results (%) - Democratic Party (Obama)
2008 Presidential Elections Results (%) - Republican Party (McCain)
2008 Presidential Elections Results (%) - Other
2012 Presidential Elections Results (%) - Democratic Party (Obama)
2012 Presidential Elections Results (%) - Republican Party (Romney)
2012 Presidential Elections Results (%) - Other
2016 Presidential Elections Results (%) - Democratic Party (Clinton)
2016 Presidential Elections Results (%) - Republican Party (Trump)
2016 Presidential Elections Results (%) - Other
2020 Presidential Elections Results (%) - Democratic Party (Biden)
2020 Presidential Elections Results (%) - Republican Party (Trump)
2020 Presidential Elections Results (%) - Other
Ancestries Reported - Arab (%)
Ancestries Reported - Czech (%)
Ancestries Reported - Danish (%)
Ancestries Reported - Dutch (%)
Ancestries Reported - English (%)
Ancestries Reported - French (%)
Ancestries Reported - French Canadian (%)
Ancestries Reported - German (%)
Ancestries Reported - Greek (%)
Ancestries Reported - Hungarian (%)
Ancestries Reported - Irish (%)
Ancestries Reported - Italian (%)
Ancestries Reported - Lithuanian (%)
Ancestries Reported - Norwegian (%)
Ancestries Reported - Polish (%)
Ancestries Reported - Portuguese (%)
Ancestries Reported - Russian (%)
Ancestries Reported - Scotch-Irish (%)
Ancestries Reported - Scottish (%)
Ancestries Reported - Slovak (%)
Ancestries Reported - Subsaharan African (%)
Ancestries Reported - Swedish (%)
Ancestries Reported - Swiss (%)
Ancestries Reported - Ukrainian (%)
Ancestries Reported - United States (%)
Ancestries Reported - Welsh (%)
Ancestries Reported - West Indian (%)
Ancestries Reported - Other (%)
Educational Attainment - No schooling completed (%)
Educational Attainment - Less than high school (%)
Educational Attainment - High school or equivalent (%)
Educational Attainment - Less than 1 year of college (%)
Educational Attainment - 1 or more years of college (%)
Educational Attainment - Associate degree (%)
Educational Attainment - Bachelor's degree (%)
Educational Attainment - Master's degree (%)
Educational Attainment - Professional school degree (%)
Educational Attainment - Doctorate degree (%)
School Enrollment - Nursery, preschool (%)
School Enrollment - Kindergarten (%)
School Enrollment - Grade 1 to 4 (%)
School Enrollment - Grade 5 to 8 (%)
School Enrollment - Grade 9 to 12 (%)
School Enrollment - College undergrad (%)
School Enrollment - Graduate or professional (%)
School Enrollment - Not enrolled in school (%)
School enrollment - Public schools (%)
School enrollment - Private schools (%)
School enrollment - Not enrolled (%)
Median number of rooms in houses and condos
Median number of rooms in apartments
Housing units lacking complete plumbing facilities (%)
Housing units lacking complete kitchen facilities (%)
Density of houses
Urban houses (%)
Rural houses (%)
Households with people 60 years and over (%)
Households with people 65 years and over (%)
Households with people 75 years and over (%)
Households with one or more nonrelatives (%)
Households with no nonrelatives (%)
Population in households (%)
Family households (%)
Nonfamily households (%)
Population in families (%)
Family households with own children (%)
Median number of bedrooms in owner occupied houses
Mean number of bedrooms in owner occupied houses
Median number of bedrooms in renter occupied houses
Mean number of bedrooms in renter occupied houses
Median number of vehichles in owner occupied houses
Mean number of vehichles in owner occupied houses
Median number of vehichles in renter occupied houses
Mean number of vehichles in renter occupied houses
Mortgage status - with mortgage (%)
Mortgage status - with second mortgage (%)
Mortgage status - with home equity loan (%)
Mortgage status - with both second mortgage and home equity loan (%)
Mortgage status - without a mortgage (%)
Average family size
Average family size - White
Average family size - Black or African American
Average family size - Asian
Average family size - Hispanic or Latino
Average family size - American Indian and Alaska Native
Average family size - Multirace
Average family size - Other Race
Geographical mobility - Same house 1 year ago (%)
Geographical mobility - Moved within same county (%)
Geographical mobility - Moved from different county within same state (%)
Geographical mobility - Moved from different state (%)
Geographical mobility - Moved from abroad (%)
Place of birth - Born in state of residence (%)
Place of birth - Born in other state (%)
Place of birth - Native, outside of US (%)
Place of birth - Foreign born (%)
Housing units in structures - 1, detached (%)
Housing units in structures - 1, attached (%)
Housing units in structures - 2 (%)
Housing units in structures - 3 or 4 (%)
Housing units in structures - 5 to 9 (%)
Housing units in structures - 10 to 19 (%)
Housing units in structures - 20 to 49 (%)
Housing units in structures - 50 or more (%)
Housing units in structures - Mobile home (%)
Housing units in structures - Boat, RV, van, etc. (%)
House/condo owner moved in on average (years ago)
Renter moved in on average (years ago)
Year householder moved into unit - Moved in 1999 to March 2000 (%)
Year householder moved into unit - Moved in 1995 to 1998 (%)
Year householder moved into unit - Moved in 1990 to 1994 (%)
Year householder moved into unit - Moved in 1980 to 1989 (%)
Year householder moved into unit - Moved in 1970 to 1979 (%)
Year householder moved into unit - Moved in 1969 or earlier (%)
Means of transportation to work - Drove car alone (%)
Means of transportation to work - Carpooled (%)
Means of transportation to work - Public transportation (%)
Means of transportation to work - Bus or trolley bus (%)
Means of transportation to work - Streetcar or trolley car (%)
Means of transportation to work - Subway or elevated (%)
Means of transportation to work - Railroad (%)
Means of transportation to work - Ferryboat (%)
Means of transportation to work - Taxicab (%)
Means of transportation to work - Motorcycle (%)
Means of transportation to work - Bicycle (%)
Means of transportation to work - Walked (%)
Means of transportation to work - Other means (%)
Working at home (%)
Industry diversity
Most Common Industries - Agriculture, forestry, fishing and hunting, and mining (%)
Most Common Industries - Agriculture, forestry, fishing and hunting (%)
Most Common Industries - Mining, quarrying, and oil and gas extraction (%)
Most Common Industries - Construction (%)
Most Common Industries - Manufacturing (%)
Most Common Industries - Wholesale trade (%)
Most Common Industries - Retail trade (%)
Most Common Industries - Transportation and warehousing, and utilities (%)
Most Common Industries - Transportation and warehousing (%)
Most Common Industries - Utilities (%)
Most Common Industries - Information (%)
Most Common Industries - Finance and insurance, and real estate and rental and leasing (%)
Most Common Industries - Finance and insurance (%)
Most Common Industries - Real estate and rental and leasing (%)
Most Common Industries - Professional, scientific, and management, and administrative and waste management services (%)
Most Common Industries - Professional, scientific, and technical services (%)
Most Common Industries - Management of companies and enterprises (%)
Most Common Industries - Administrative and support and waste management services (%)
Most Common Industries - Educational services, and health care and social assistance (%)
Most Common Industries - Educational services (%)
Most Common Industries - Health care and social assistance (%)
Most Common Industries - Arts, entertainment, and recreation, and accommodation and food services (%)
Most Common Industries - Arts, entertainment, and recreation (%)
Most Common Industries - Accommodation and food services (%)
Most Common Industries - Other services, except public administration (%)
Most Common Industries - Public administration (%)
Occupation diversity
Most Common Occupations - Management, business, science, and arts occupations (%)
Most Common Occupations - Management, business, and financial occupations (%)
Most Common Occupations - Management occupations (%)
Most Common Occupations - Business and financial operations occupations (%)
Most Common Occupations - Computer, engineering, and science occupations (%)
Most Common Occupations - Computer and mathematical occupations (%)
Most Common Occupations - Architecture and engineering occupations (%)
Most Common Occupations - Life, physical, and social science occupations (%)
Most Common Occupations - Education, legal, community service, arts, and media occupations (%)
Most Common Occupations - Community and social service occupations (%)
Most Common Occupations - Legal occupations (%)
Most Common Occupations - Education, training, and library occupations (%)
Most Common Occupations - Arts, design, entertainment, sports, and media occupations (%)
Most Common Occupations - Healthcare practitioners and technical occupations (%)
Most Common Occupations - Health diagnosing and treating practitioners and other technical occupations (%)
Most Common Occupations - Health technologists and technicians (%)
Most Common Occupations - Service occupations (%)
Most Common Occupations - Healthcare support occupations (%)
Most Common Occupations - Protective service occupations (%)
Most Common Occupations - Fire fighting and prevention, and other protective service workers including supervisors (%)
Most Common Occupations - Law enforcement workers including supervisors (%)
Most Common Occupations - Food preparation and serving related occupations (%)
Most Common Occupations - Building and grounds cleaning and maintenance occupations (%)
Most Common Occupations - Personal care and service occupations (%)
Most Common Occupations - Sales and office occupations (%)
Most Common Occupations - Sales and related occupations (%)
Most Common Occupations - Office and administrative support occupations (%)
Most Common Occupations - Natural resources, construction, and maintenance occupations (%)
Most Common Occupations - Farming, fishing, and forestry occupations (%)
Most Common Occupations - Construction and extraction occupations (%)
Most Common Occupations - Installation, maintenance, and repair occupations (%)
Most Common Occupations - Production, transportation, and material moving occupations (%)
Most Common Occupations - Production occupations (%)
Most Common Occupations - Transportation occupations (%)
Most Common Occupations - Material moving occupations (%)
People in Group quarters - Institutionalized population (%)
People in Group quarters - Correctional institutions (%)
People in Group quarters - Federal prisons and detention centers (%)
People in Group quarters - Halfway houses (%)
People in Group quarters - Local jails and other confinement facilities (including police lockups) (%)
People in Group quarters - Military disciplinary barracks (%)
People in Group quarters - State prisons (%)
People in Group quarters - Other types of correctional institutions (%)
People in Group quarters - Nursing homes (%)
People in Group quarters - Hospitals/wards, hospices, and schools for the handicapped (%)
People in Group quarters - Hospitals/wards and hospices for chronically ill (%)
People in Group quarters - Hospices or homes for chronically ill (%)
People in Group quarters - Military hospitals or wards for chronically ill (%)
People in Group quarters - Other hospitals or wards for chronically ill (%)
People in Group quarters - Hospitals or wards for drug/alcohol abuse (%)
People in Group quarters - Mental (Psychiatric) hospitals or wards (%)
People in Group quarters - Schools, hospitals, or wards for the mentally retarded (%)
People in Group quarters - Schools, hospitals, or wards for the physically handicapped (%)
People in Group quarters - Institutions for the deaf (%)
People in Group quarters - Institutions for the blind (%)
People in Group quarters - Orthopedic wards and institutions for the physically handicapped (%)
People in Group quarters - Wards in general hospitals for patients who have no usual home elsewhere (%)
People in Group quarters - Wards in military hospitals for patients who have no usual home elsewhere (%)
People in Group quarters - Juvenile institutions (%)
People in Group quarters - Long-term care (%)
People in Group quarters - Homes for abused, dependent, and neglected children (%)
People in Group quarters - Residential treatment centers for emotionally disturbed children (%)
People in Group quarters - Training schools for juvenile delinquents (%)
People in Group quarters - Short-term care, detention or diagnostic centers for delinquent children (%)
People in Group quarters - Type of juvenile institution unknown (%)
People in Group quarters - Noninstitutionalized population (%)
People in Group quarters - College dormitories (includes college quarters off campus) (%)
People in Group quarters - Military quarters (%)
People in Group quarters - On base (%)
People in Group quarters - Barracks, unaccompanied personnel housing (UPH), (Enlisted/Officer), ;and similar group living quarters for military personnel (%)
People in Group quarters - Transient quarters for temporary residents (%)
People in Group quarters - Military ships (%)
People in Group quarters - Group homes (%)
People in Group quarters - Homes or halfway houses for drug/alcohol abuse (%)
People in Group quarters - Homes for the mentally ill (%)
People in Group quarters - Homes for the mentally retarded (%)
People in Group quarters - Homes for the physically handicapped (%)
People in Group quarters - Other group homes (%)
People in Group quarters - Religious group quarters (%)
People in Group quarters - Dormitories (%)
People in Group quarters - Agriculture workers' dormitories on farms (%)
People in Group quarters - Job Corps and vocational training facilities (%)
People in Group quarters - Other workers' dormitories (%)
People in Group quarters - Crews of maritime vessels (%)
People in Group quarters - Other nonhousehold living situations (%)
People in Group quarters - Other noninstitutional group quarters (%)
Residents speaking English at home (%)
Residents speaking English at home - Born in the United States (%)
Residents speaking English at home - Native, born elsewhere (%)
Residents speaking English at home - Foreign born (%)
Residents speaking Spanish at home (%)
Residents speaking Spanish at home - Born in the United States (%)
Residents speaking Spanish at home - Native, born elsewhere (%)
Residents speaking Spanish at home - Foreign born (%)
Residents speaking other language at home (%)
Residents speaking other language at home - Born in the United States (%)
Residents speaking other language at home - Native, born elsewhere (%)
Residents speaking other language at home - Foreign born (%)
Class of Workers - Employee of private company (%)
Class of Workers - Self-employed in own incorporated business (%)
Class of Workers - Private not-for-profit wage and salary workers (%)
Class of Workers - Local government workers (%)
Class of Workers - State government workers (%)
Class of Workers - Federal government workers (%)
Class of Workers - Self-employed workers in own not incorporated business and Unpaid family workers (%)
House heating fuel used in houses and condos - Utility gas (%)
House heating fuel used in houses and condos - Bottled, tank, or LP gas (%)
House heating fuel used in houses and condos - Electricity (%)
House heating fuel used in houses and condos - Fuel oil, kerosene, etc. (%)
House heating fuel used in houses and condos - Coal or coke (%)
House heating fuel used in houses and condos - Wood (%)
House heating fuel used in houses and condos - Solar energy (%)
House heating fuel used in houses and condos - Other fuel (%)
House heating fuel used in houses and condos - No fuel used (%)
House heating fuel used in apartments - Utility gas (%)
House heating fuel used in apartments - Bottled, tank, or LP gas (%)
House heating fuel used in apartments - Electricity (%)
House heating fuel used in apartments - Fuel oil, kerosene, etc. (%)
House heating fuel used in apartments - Coal or coke (%)
House heating fuel used in apartments - Wood (%)
House heating fuel used in apartments - Solar energy (%)
House heating fuel used in apartments - Other fuel (%)
House heating fuel used in apartments - No fuel used (%)
Armed forces status - In Armed Forces (%)
Armed forces status - Civilian (%)
Armed forces status - Civilian - Veteran (%)
Armed forces status - Civilian - Nonveteran (%)
Fatal accidents locations in years 2005-2021
Fatal accidents locations in 2005
Fatal accidents locations in 2006
Fatal accidents locations in 2007
Fatal accidents locations in 2008
Fatal accidents locations in 2009
Fatal accidents locations in 2010
Fatal accidents locations in 2011
Fatal accidents locations in 2012
Fatal accidents locations in 2013
Fatal accidents locations in 2014
Fatal accidents locations in 2015
Fatal accidents locations in 2016
Fatal accidents locations in 2017
Fatal accidents locations in 2018
Fatal accidents locations in 2019
Fatal accidents locations in 2020
Fatal accidents locations in 2021
Alcohol use - People drinking some alcohol every month (%)
Alcohol use - People not drinking at all (%)
Alcohol use - Average days/month drinking alcohol
Alcohol use - Average drinks/week
Alcohol use - Average days/year people drink much
Audiometry - Average condition of hearing (%)
Audiometry - People that can hear a whisper from across a quiet room (%)
Audiometry - People that can hear normal voice from across a quiet room (%)
Audiometry - Ears ringing, roaring, buzzing (%)
Audiometry - Had a job exposure to loud noise (%)
Audiometry - Had off-work exposure to loud noise (%)
Blood Pressure & Cholesterol - Has high blood pressure (%)
Blood Pressure & Cholesterol - Checking blood pressure at home (%)
Blood Pressure & Cholesterol - Frequently checking blood cholesterol (%)
Blood Pressure & Cholesterol - Has high cholesterol level (%)
Consumer Behavior - Money monthly spent on food at supermarket/grocery store
Consumer Behavior - Money monthly spent on food at other stores
Consumer Behavior - Money monthly spent on eating out
Consumer Behavior - Money monthly spent on carryout/delivered foods
Consumer Behavior - Income spent on food at supermarket/grocery store (%)
Consumer Behavior - Income spent on food at other stores (%)
Consumer Behavior - Income spent on eating out (%)
Consumer Behavior - Income spent on carryout/delivered foods (%)
Current Health Status - General health condition (%)
Current Health Status - Blood donors (%)
Current Health Status - Has blood ever tested for HIV virus (%)
Current Health Status - Left-handed people (%)
Dermatology - People using sunscreen (%)
Diabetes - Diabetics (%)
Diabetes - Had a blood test for high blood sugar (%)
Diabetes - People taking insulin (%)
Diet Behavior & Nutrition - Diet health (%)
Diet Behavior & Nutrition - Milk product consumption (# of products/month)
Diet Behavior & Nutrition - Meals not home prepared (#/week)
Diet Behavior & Nutrition - Meals from fast food or pizza place (#/week)
Diet Behavior & Nutrition - Ready-to-eat foods (#/month)
Diet Behavior & Nutrition - Frozen meals/pizza (#/month)
Drug Use - People that ever used marijuana or hashish (%)
Drug Use - Ever used hard drugs (%)
Drug Use - Ever used any form of cocaine (%)
Drug Use - Ever used heroin (%)
Drug Use - Ever used methamphetamine (%)
Health Insurance - People covered by health insurance (%)
Kidney Conditions-Urology - Avg. # of times urinating at night
Medical Conditions - People with asthma (%)
Medical Conditions - People with anemia (%)
Medical Conditions - People with psoriasis (%)
Medical Conditions - People with overweight (%)
Medical Conditions - Elderly people having difficulties in thinking or remembering (%)
Medical Conditions - People who ever received blood transfusion (%)
Medical Conditions - People having trouble seeing even with glass/contacts (%)
Medical Conditions - People with arthritis (%)
Medical Conditions - People with gout (%)
Medical Conditions - People with congestive heart failure (%)
Medical Conditions - People with coronary heart disease (%)
Medical Conditions - People with angina pectoris (%)
Medical Conditions - People who ever had heart attack (%)
Medical Conditions - People who ever had stroke (%)
Medical Conditions - People with emphysema (%)
Medical Conditions - People with thyroid problem (%)
Medical Conditions - People with chronic bronchitis (%)
Medical Conditions - People with any liver condition (%)
Medical Conditions - People who ever had cancer or malignancy (%)
Mental Health - People who have little interest in doing things (%)
Mental Health - People feeling down, depressed, or hopeless (%)
Mental Health - People who have trouble sleeping or sleeping too much (%)
Mental Health - People feeling tired or having little energy (%)
Mental Health - People with poor appetite or overeating (%)
Mental Health - People feeling bad about themself (%)
Mental Health - People who have trouble concentrating on things (%)
Mental Health - People moving or speaking slowly or too fast (%)
Mental Health - People having thoughts they would be better off dead (%)
Oral Health - Average years since last visit a dentist
Oral Health - People embarrassed because of mouth (%)
Oral Health - People with gum disease (%)
Oral Health - General health of teeth and gums (%)
Oral Health - Average days a week using dental floss/device
Oral Health - Average days a week using mouthwash for dental problem
Oral Health - Average number of teeth
Pesticide Use - Households using pesticides to control insects (%)
Pesticide Use - Households using pesticides to kill weeds (%)
Physical Activity - People doing vigorous-intensity work activities (%)
Physical Activity - People doing moderate-intensity work activities (%)
Physical Activity - People walking or bicycling (%)
Physical Activity - People doing vigorous-intensity recreational activities (%)
Physical Activity - People doing moderate-intensity recreational activities (%)
Physical Activity - Average hours a day doing sedentary activities
Physical Activity - Average hours a day watching TV or videos
Physical Activity - Average hours a day using computer
Physical Functioning - People having limitations keeping them from working (%)
Physical Functioning - People limited in amount of work they can do (%)
Physical Functioning - People that need special equipment to walk (%)
Physical Functioning - People experiencing confusion/memory problems (%)
Physical Functioning - People requiring special healthcare equipment (%)
Prescription Medications - Average number of prescription medicines taking
Preventive Aspirin Use - Adults 40+ taking low-dose aspirin (%)
Reproductive Health - Vaginal deliveries (%)
Reproductive Health - Cesarean deliveries (%)
Reproductive Health - Deliveries resulted in a live birth (%)
Reproductive Health - Pregnancies resulted in a delivery (%)
Reproductive Health - Women breastfeeding newborns (%)
Reproductive Health - Women that had a hysterectomy (%)
Reproductive Health - Women that had both ovaries removed (%)
Reproductive Health - Women that have ever taken birth control pills (%)
Reproductive Health - Women taking birth control pills (%)
Reproductive Health - Women that have ever used Depo-Provera or injectables (%)
Reproductive Health - Women that have ever used female hormones (%)
Sexual Behavior - People 18+ that ever had sex (vaginal, anal, or oral) (%)
Sexual Behavior - Males 18+ that ever had vaginal sex with a woman (%)
Sexual Behavior - Males 18+ that ever performed oral sex on a woman (%)
Sexual Behavior - Males 18+ that ever had anal sex with a woman (%)
Sexual Behavior - Males 18+ that ever had any sex with a man (%)
Sexual Behavior - Females 18+ that ever had vaginal sex with a man (%)
Sexual Behavior - Females 18+ that ever performed oral sex on a man (%)
Sexual Behavior - Females 18+ that ever had anal sex with a man (%)
Sexual Behavior - Females 18+ that ever had any kind of sex with a woman (%)
Sexual Behavior - Average age people first had sex
Sexual Behavior - Average number of female sex partners in lifetime (males 18+)
Sexual Behavior - Average number of female vaginal sex partners in lifetime (males 18+)
Sexual Behavior - Average age people first performed oral sex on a woman (18+)
Sexual Behavior - Average number of woman performed oral sex on in lifetime (18+)
Sexual Behavior - Average number of male sex partners in lifetime (males 18+)
Sexual Behavior - Average number of male anal sex partners in lifetime (males 18+)
Sexual Behavior - Average age people first performed oral sex on a man (18+)
Sexual Behavior - Average number of male oral sex partners in lifetime (18+)
Sexual Behavior - People using protection when performing oral sex (%)
Sexual Behavior - Average number of times people have vaginal or anal sex a year
Sexual Behavior - People having sex without condom (%)
Sexual Behavior - Average number of male sex partners in lifetime (females 18+)
Sexual Behavior - Average number of male vaginal sex partners in lifetime (females 18+)
Sexual Behavior - Average number of female sex partners in lifetime (females 18+)
Sexual Behavior - Circumcised males 18+ (%)
Sleep Disorders - Average hours sleeping at night
Sleep Disorders - People that has trouble sleeping (%)
Smoking-Cigarette Use - People smoking cigarettes (%)
Taste & Smell - People 40+ having problems with smell (%)
Taste & Smell - People 40+ having problems with taste (%)
Taste & Smell - People 40+ that ever had wisdom teeth removed (%)
Taste & Smell - People 40+ that ever had tonsils teeth removed (%)
Taste & Smell - People 40+ that ever had a loss of consciousness because of a head injury (%)
Taste & Smell - People 40+ that ever had a broken nose or other serious injury to face or skull (%)
Taste & Smell - People 40+ that ever had two or more sinus infections (%)
Weight - Average height (inches)
Weight - Average weight (pounds)
Weight - Average BMI
Weight - People that are obese (%)
Weight - People that ever were obese (%)
Weight - People trying to lose weight (%)
100%
urban population.
Estimated median house/condo value in 2022: $270,909
45213:
$270,909Ohio:
$204,100
According to our research of Ohio and other state lists, there were 16 registered sex offenders living in 45213 zip code as of April 27, 2024 . The ratio of all residents to sex offenders in zip code 45213 is 768 to 1.The ratio of registered sex offenders to all residents in this zip code is lower than the state average.
Median resident age: This zip code:
36.9 yearsOhio median age:
39.9 years
Average household size: This zip code:
2.0 peopleOhio:
2.4 people
Averages for the 2020 tax year for zip code 45213, filed in 2021:
Average Adjusted Gross Income (AGI) in 2020: $66,078 (Individual Income Tax Returns) Here:
$66,078State:
$67,288
Salary/wage: $57,033 (reported on 84.8% of returns )Here:
$57,033State:
$55,628
(% of AGI for various income ranges: 1232.8% for AGIs below $25k , 3804.9% for AGIs $25k-50k , 7054.0% for AGIs $50k-75k , 10039.7% for AGIs $75k-100k , 18754.3% for AGIs $100k-200k , 71757.5% for AGIs over 200k ) Taxable interest for individuals: $968 (reported on 24.1% of returns )This zip code:
$968Ohio:
$1,518
(% of AGI for various income ranges: 5.0% for AGIs below $25k , 11.1% for AGIs $25k-50k , 16.0% for AGIs $50k-75k , 58.1% for AGIs $75k-100k , 73.9% for AGIs $100k-200k , 701.2% for AGIs over 200k ) Ordinary dividends: $4,605 (reported on 22.3% of returns )(% of AGI for various income ranges: 23.1% for AGIs below $25k , 28.7% for AGIs $25k-50k , 98.1% for AGIs $50k-75k , 144.3% for AGIs $75k-100k , 388.4% for AGIs $100k-200k , 3301.3% for AGIs over 200k ) Net capital gain/loss in AGI: +$13,802 (reported on 17.6% of returns )Here:
+$13,802State:
+$18,919
(% of AGI for various income ranges: 2.4% for AGIs below $25k , 21.9% for AGIs $25k-50k , 72.2% for AGIs $50k-75k , 181.1% for AGIs $75k-100k , 531.2% for AGIs $100k-200k , 13993.8% for AGIs over 200k ) Profit/loss from business: +$12,902 (reported on 15.3% of returns )Here:
+$12,902State:
+$13,744
(% of AGI for various income ranges: 106.5% for AGIs below $25k , 133.7% for AGIs $25k-50k , 243.4% for AGIs $50k-75k , 373.8% for AGIs $75k-100k , 675.9% for AGIs $100k-200k , 3502.5% for AGIs over 200k ) Taxable individual retirement arrangement distribution: $18,236 (reported on 7.1% of returns )45213:
$18,236Ohio:
$18,876
(% of AGI for various income ranges: 39.5% for AGIs below $25k , 71.1% for AGIs $25k-50k , 109.0% for AGIs $50k-75k , 285.1% for AGIs $75k-100k , 770.0% for AGIs $100k-200k , 1365.0% for AGIs over 200k ) Self-employed (Keogh) retirement plans: $17,660 (reported on 0.8% of returns )45213:
$17,660Ohio:
$24,898
(% of AGI for various income ranges: 180.2% for AGIs $100k-200k ) Total itemized deductions: $30,830 (reported on 6.8% of returns )Here:
$30,830State:
$33,869
(% of AGI for various income ranges: 103.1% for AGIs $25k-50k , 204.7% for AGIs $50k-75k , 414.6% for AGIs $75k-100k , 885.9% for AGIs $100k-200k , 5633.8% for AGIs over 200k ) Charity contributions: $11,718 (reported on 5.4% of returns )Here:
$11,718State:
$14,577
(% of AGI for various income ranges: 14.9% for AGIs $25k-50k , 36.0% for AGIs $50k-75k , 85.7% for AGIs $75k-100k , 284.7% for AGIs $100k-200k , 2261.2% for AGIs over 200k ) Taxes paid: $7,962 (reported on 6.6% of returns )(% of AGI for various income ranges: 16.9% for AGIs $25k-50k , 67.3% for AGIs $50k-75k , 151.6% for AGIs $75k-100k , 272.0% for AGIs $100k-200k , 915.0% for AGIs over 200k ) Earned income credit: $2,099 (reported on 14.6% of returns )(% of AGI for various income ranges: 93.7% for AGIs below $25k , 49.0% for AGIs $25k-50k ) Percentage of individuals using paid preparers for their 2020 taxes: 92.6%(% for various income ranges: 91.4% for AGIs below $25k , 93.1% for AGIs $25k-50k , 92.4% for AGIs $50k-75k , 91.1% for AGIs $75k-100k , 94.1% for AGIs $100k-200k , 96.2% for AGIs over 200k )
Averages for the 2012 tax year for zip code 45213, filed in 2013:
Average Adjusted Gross Income (AGI) in 2012: $52,212 (Individual Income Tax Returns) Here:
$52,212State:
$54,926
Salary/wage: $43,486 (reported on 86.3% of returns )Here:
$43,486State:
$45,869
(% of AGI for various income ranges: 81.2% for AGIs below $25k , 81.2% for AGIs $25k-50k , 79.0% for AGIs $50k-75k , 75.7% for AGIs $75k-100k , 75.5% for AGIs $100k-200k , 46.8% for AGIs over 200k ) Taxable interest for individuals: $1,052 (reported on 26.3% of returns )This zip code:
$1,052Ohio:
$1,297
(% of AGI for various income ranges: 0.3% for AGIs below $25k , 0.2% for AGIs $25k-50k , 0.5% for AGIs $50k-75k , 0.4% for AGIs $75k-100k , 0.8% for AGIs $100k-200k , 0.7% for AGIs over 200k ) Ordinary dividends: $5,496 (reported on 21.6% of returns )(% of AGI for various income ranges: 0.9% for AGIs below $25k , 0.9% for AGIs $25k-50k , 1.2% for AGIs $50k-75k , 1.6% for AGIs $75k-100k , 2.4% for AGIs $100k-200k , 5.3% for AGIs over 200k ) Net capital gain/loss in AGI: +$5,870 (reported on 14.1% of returns )Here:
+$5,870State:
+$11,232
(% of AGI for various income ranges: 0.2% for AGIs below $25k , 0.2% for AGIs $25k-50k , 0.9% for AGIs $50k-75k , 0.8% for AGIs $75k-100k , 2.1% for AGIs $100k-200k , 3.9% for AGIs over 200k ) Profit/loss from business: +$14,362 (reported on 13.4% of returns )Here:
+$14,362State:
+$12,773
(% of AGI for various income ranges: 6.1% for AGIs below $25k , 1.9% for AGIs $25k-50k , 2.7% for AGIs $50k-75k , 3.1% for AGIs $75k-100k , 4.0% for AGIs $100k-200k , 4.9% for AGIs over 200k ) Taxable individual retirement arrangement distribution: $17,430 (reported on 8.2% of returns )45213:
$17,430Ohio:
$14,511
(% of AGI for various income ranges: 1.5% for AGIs below $25k , 1.9% for AGIs $25k-50k , 2.1% for AGIs $50k-75k , 2.4% for AGIs $75k-100k , 3.7% for AGIs $100k-200k , 3.7% for AGIs over 200k ) Self-employment retirement plans: $19,640 (reported on 0.8% of returns )45213:
$19,640Ohio:
$20,257
(% of AGI for various income ranges: 0.3% for AGIs $25k-50k , 1.2% for AGIs $100k-200k ) Total itemized deductions: $20,064 (19% of AGI, reported on 33.0% of returns )Here:
$20,064State:
$21,278
Here:
19.5% of AGIState:
18.8% of AGI
(% of AGI for various income ranges: 6.7% for AGIs below $25k , 8.7% for AGIs $25k-50k , 13.1% for AGIs $50k-75k , 14.8% for AGIs $75k-100k , 15.1% for AGIs $100k-200k , 14.7% for AGIs over 200k ) Charity contributions: $4,312 (reported on 27.3% of returns )(% of AGI for various income ranges: 0.6% for AGIs below $25k , 1.0% for AGIs $25k-50k , 1.9% for AGIs $50k-75k , 2.3% for AGIs $75k-100k , 2.5% for AGIs $100k-200k , 4.1% for AGIs over 200k ) Taxes paid: $9,187 (reported on 33.0% of returns )(% of AGI for various income ranges: 1.7% for AGIs below $25k , 3.3% for AGIs $25k-50k , 6.0% for AGIs $50k-75k , 6.3% for AGIs $75k-100k , 7.7% for AGIs $100k-200k , 7.4% for AGIs over 200k ) Earned income credit: $2,274 (reported on 20.1% of returns )(% of AGI for various income ranges: 7.6% for AGIs below $25k , 0.8% for AGIs $25k-50k ) Percentage of individuals using paid preparers for their 2012 taxes: 42.8%(% for various income ranges: 39.5% for AGIs below $25k , 42.8% for AGIs $25k-50k , 43.7% for AGIs $50k-75k , 45.8% for AGIs $75k-100k , 47.3% for AGIs $100k-200k , 66.7% for AGIs over 200k )
Averages for the 2004 tax year for zip code 45213, filed in 2005:
Average Adjusted Gross Income (AGI) in 2004: $42,227 (Individual Income Tax Returns) Here:
$42,227State:
$44,480
Salary/wage: $36,948 (reported on 86.9% of returns )Here:
$36,948State:
$39,198
(% of AGI for various income ranges: 111.6% for AGIs below $10k , 79.4% for AGIs $10k-25k , 83.5% for AGIs $25k-50k , 82.2% for AGIs $50k-75k , 82.5% for AGIs $75k-100k , 61.2% for AGIs over 100k ) Taxable interest for individuals: $1,263 (reported on 36.3% of returns )This zip code:
$1,263Ohio:
$1,532
(% of AGI for various income ranges: 2.2% for AGIs below $10k , 0.9% for AGIs $10k-25k , 0.9% for AGIs $25k-50k , 0.8% for AGIs $50k-75k , 1.0% for AGIs $75k-100k , 1.4% for AGIs over 100k ) Taxable dividends: $3,717 (reported on 25.6% of returns )(% of AGI for various income ranges: 2.9% for AGIs below $10k , 1.2% for AGIs $10k-25k , 1.1% for AGIs $25k-50k , 1.5% for AGIs $50k-75k , 2.4% for AGIs $75k-100k , 3.8% for AGIs over 100k ) Net capital gain/loss: +$8,292 (reported on 17.6% of returns )Here:
+$8,292State:
+$8,582
(% of AGI for various income ranges: 1.3% for AGIs below $10k , 0.4% for AGIs $10k-25k , 0.3% for AGIs $25k-50k , 1.0% for AGIs $50k-75k , 2.4% for AGIs $75k-100k , 8.9% for AGIs over 100k ) Profit/loss from business: +$10,848 (reported on 12.9% of returns )Here:
+$10,848State:
+$10,813
(% of AGI for various income ranges: 5.7% for AGIs below $10k , 3.9% for AGIs $10k-25k , 2.0% for AGIs $25k-50k , 1.4% for AGIs $50k-75k , 2.6% for AGIs $75k-100k , 5.3% for AGIs over 100k ) IRA payment deduction: $2,265 (reported on 1.9% of returns )(% of AGI for various income ranges: 0.1% for AGIs $10k-25k , 0.2% for AGIs $25k-50k , 0.1% for AGIs $50k-75k , 0.1% for AGIs $75k-100k , 0.0% for AGIs over 100k ) Self-employed pension: $14,779 (reported on 1.2% of returns )Total itemized deductions: $16,710 (22% of AGI, reported on 36.5% of returns )Here:
$16,710State:
$17,503
Here:
21.6% of AGIState:
20.8% of AGI
(% of AGI for various income ranges: 12.1% for AGIs below $10k , 6.2% for AGIs $10k-25k , 12.7% for AGIs $25k-50k , 16.3% for AGIs $50k-75k , 18.9% for AGIs $75k-100k , 15.8% for AGIs over 100k ) Charity contributions deductions: $3,484 (4% of AGI, reported on 32.7% of returns )Here:
4.3% of AGIState:
3.4% of AGI
(% of AGI for various income ranges: 1.1% for AGIs below $10k , 1.0% for AGIs $10k-25k , 2.0% for AGIs $25k-50k , 2.7% for AGIs $50k-75k , 3.1% for AGIs $75k-100k , 3.7% for AGIs over 100k ) Total tax: $6,382 (reported on 75.1% of returns )(% of AGI for various income ranges: 2.5% for AGIs below $10k , 4.1% for AGIs $10k-25k , 7.7% for AGIs $25k-50k , 10.0% for AGIs $50k-75k , 11.1% for AGIs $75k-100k , 17.9% for AGIs over 100k ) Earned income credit: $1,785 (reported on 18.5% of returns )Percentage of individuals using paid preparers for their 2004 taxes: 48.7%(% for various income ranges: 43.5% for AGIs below $10k , 52.3% for AGIs $10k-25k , 48.2% for AGIs $25k-50k , 48.7% for AGIs $50k-75k , 47.2% for AGIs $75k-100k , 52.4% for AGIs over 100k )
Estimated median household income in 2022: This zip code:
$61,794Ohio:
$65,720
Nearest zip codes: 45209 ,
45237 ,
45212 ,
45236 ,
45227 ,
45208 .
Silverton Zip Code Map
Percentage of family households: This zip code:
36.1%Ohio:
43.3%
Percentage of households with unmarried partners: This zip code:
8.0%Ohio:
44.6%
Likely homosexual households (counted as self-reported same-sex unmarried-partner households)
Lesbian couples: 0.0% of all households Gay men: 0.5% of all households
Household received Food Stamps/SNAP in the past 12 months: 586Household did not receive Food Stamps/SNAP in the past 12 months: 5,136
Women who had a birth in the past 12 months: 196 (192 now married , 8 unmarried) Women who did not have a birth in the past 12 months: 2,554 (909 now married , 1,646 unmarried)
Housing units in zip code 45213 with a mortgage: 2,340 (237
second mortgage , 18
home equity loan , 178
both second mortgage and home equity loan )
Houses without a mortgage: 23
Median monthly owner costs for units with a mortgage: $1,581
Median monthly owner costs for units without a mortgage: $744
Residents with income below the poverty level in 2022:
This zip code:
13.9%Whole state:
13.4%
Residents with income below 50% of the poverty level in 2022:
This zip code:
3.8%Whole state:
7.0%
Median number of rooms in houses and condos: Median number of rooms in apartments: Notable locations in this zip code not listed on our city pages
Click to draw/clear zip code borders Notable locations in zip code 45213: (A) , Losantiville Country Club (B) , Cincinnati Fire Department Engine and Truck 8 (C) , Number 8 Engine Company (D) . Display/hide their locations on the map
Shopping Centers: (1) , Highland Ridge Shopping Center (2) . Display/hide their locations on the map
Churches in zip code 45213 include: (A) , Saint Peters United Church of Christ (B) , Pleasant Ridge Baptist Church (C) , Pleasant Ridge United Methodist Church (D) , Madisonville Church of Christ (E) , First Baptist Church of Kennedy Heights (F) , Beth Messiah Congregation (G) , Straitgate Church (H) , All Saints Episcopal Church (I) . Display/hide their locations on the map
Parks in zip code 45213 include: (1) , Woodford Park (2) , Kennedy Heights Park (3) , Drake Park (4) . Display/hide their locations on the map
Year house built (houses)
0 2020 or later49 2010 to 201932 2000 to 2009230 1990 to 1999141 1980 to 1989291 1970 to 1979475 1960 to 1969860 1950 to 1959838 1940 to 19493,012 1939 or earlier
Zip code 45213 household income distribution in 2022 661 Less than $10,000213 $10,000 to $14,999131 $15,000 to $19,999124 $20,000 to $24,999359 $25,000 to $29,999324 $30,000 to $34,999208 $35,000 to $39,999275 $40,000 to $44,999247 $45,000 to $49,999244 $50,000 to $59,999471 $60,000 to $74,999585 $75,000 to $99,999564 $100,000 to $124,999416 $125,000 to $149,999415 $150,000 to $199,999514 $200,000 or moreEstimate of home value of owner-occupied houses/condos in 2022 in zip code 45213 10 Less than $10,00014 $15,000 to $19,99942 $50,000 to $59,99919 $70,000 to $79,99982 $80,000 to $89,99918 $90,000 to $99,999252 $100,000 to $124,999117 $125,000 to $149,999183 $150,000 to $174,999214 $175,000 to $199,999658 $200,000 to $249,999627 $250,000 to $299,999667 $300,000 to $399,999288 $400,000 to $499,999208 $500,000 to $749,99933 $750,000 to $999,9996 $1,000,000 to $1,499,999Rent paid by renters in 2022 in zip code 45213 31 Less than $10084 $150 to $19960 $200 to $24914 $250 to $29933 $350 to $399164 $500 to $54995 $550 to $599227 $600 to $649238 $650 to $699124 $700 to $749168 $750 to $799287 $800 to $899205 $900 to $99948 $1,000 to $1,249381 $1,250 to $1,499110 $1,500 to $1,9995 $2,000 to $2,499178 No cash rent
Median gross rent in 2022: $897.
Median price asked for vacant for-sale houses and condos in 2022: $233,049.
Estimated median house (or condo) value in 2022 for: White Non-Hispanic householders: $315,323Black or African American householders: $232,207American Indian or Alaska Native householders: $292,207Asian householders: $220,778Some other race householders: $277,661Two or more races householders: $243,895Hispanic or Latino householders: $299,739Estimated median house or condo value in 2022: $270,909
45213:
$270,909Ohio:
$204,100
Lower value quartile - upper value quartile: $187,645 - $367,665
Mean price in 2022: Detached houses: $325,857Here:
$325,857State:
$254,366
Townhouses or other attached units: $430,385Here:
$430,385State:
$225,733
In 2-unit structures: $135,112Here:
$135,112State:
$144,384
In 3-to-4-unit structures: $220,187Here:
$220,187State:
$203,002
In 5-or-more-unit structures: $266,262Here:
$266,262State:
$211,593
Housing units in structures:
One, detached: 3,529One, attached: 70Two: 6893 or 4: 8575 to 9: 44310 to 19: 18020 to 49: 11550 or more: 87Boats, RVs, vans, etc.: 41Unemployment : 3.6%
Means of transportation to work in zip code 45213 80.0% 4,751 Drove a car alone2.0% 120 Carpooled2.2% 130 Bus or trolley bus0.3% 20 Walked0.3% 18 Other means15.0% 890 Worked at homeTravel time to work (commute) in zip code 45213 5 Less than 5 minutes324 5 to 9 minutes372 10 to 14 minutes1,341 15 to 19 minutes1,150 20 to 24 minutes549 25 to 29 minutes739 30 to 34 minutes54 35 to 39 minutes191 40 to 44 minutes151 45 to 59 minutes160 60 to 89 minutes38 90 or more minutes
Neighborhoods in zip code 45213: Percentage of zip code residents living and working in this county: 84.4%
Household type by relationship:
Households: 11,654
Male householders: 2,774 (1,119 living alone ), Female householders: 2,953 (1,287 living alone )2,047 spouses (2,005 opposite-sex spouses ), 346 unmarried partners , (345 opposite-sex unmarried partners ), 2,859 children (2,779 natural , 8 adopted , 71 stepchildren ), 91 grandchildren , 13 brothers or sisters , 87 parents , 0 foster children , 105 other relatives , 284 non-relatives In group quarters: 137 (-1 institutionalized population )
Size of family households: 1,394 2-persons , 831 3-persons , 441 4-persons , 188 5-persons , 10 6-persons
Size of nonfamily households: 2,405 1-person , 418 2-persons , 54 3-persons
1,485 married couples with children. single-parent households (122 men , 714 women ).
94.1% of residents of 45213 zip code speak English at home. of residents speak Spanish at home (19% very well, 81% not well ).of residents speak other Indo-European language at home (100% very well ).of residents speak Asian or Pacific Island language at home (91% very well, 9% not well ).of residents speak other language at home (95% very well, 5% well ).
Foreign born population: 531 (4.6%)
(38.2%
of them are naturalized citizens )
This zip code:
4.6%Whole state:
5.0%
15% Mexico 10% India 8% Haiti 7% Honduras 3% France 3% Zimbabwe 2% Thailand 14% German 4% American 4% Irish 3% English 3% African 2% Polish 2% European
Year of entry for the foreign-born population
404 2010 or later 88 2000 to 2009 38 1990 to 1999 101 Before 1990
There are
73 Medical Specialists in Zip Code 45213 .
Facilities with environmental interests located in this zip code:
BARR LABORATORIES INC (5040 DURAMED DRIVE in CINCINNATI, OH)
AIR MINOR (AIRS/AFS) STATE MASTER (Ohio general info) - AIR MAJOR, RCRA-OHD017038951, HAZARDOUS WASTE PROGRAM Large Quantity Generators, more that 1000 kg of hazardous waste/month (Resource Conservation and Recovery Act (tracking hazardous waste)) - notification Business SIC classification: PHARMACEUTICAL PREPARATIONSOrganizations: BARR LABORATORIES, INC. (CONTACT/OPERATOR)
, BARR PHARMACEUTICALS INC (CONTACT/OWNER)
, BARR PHARMACEUTICALS, INC. (CONTACT/OWNER)
Alternative names: DURAMED PHARMACEUTICALS
A-1 DRY CLEANERS INC (6211 MONTGOMERY RD in CINCINNATI, OH)
STATE MASTER (Ohio general info) - AIR MAJOR, RCRA-OHD017605783, HAZARDOUS WASTE PROGRAM Small Quantity Generators, between 100 kg and 1000 kg of hazardous waste/month (Resource Conservation and Recovery Act (tracking hazardous waste)) - notification Organizations: A 1 DRY CLEANERS INC (CONTACT/OWNER)
AUTO SOURCE INC (5405 RIDGE AVE in CINCINNATI, OH)
STATE MASTER (Ohio general info) - RCRA-OHD987048105, HAZARDOUS WASTE PROGRAM Small Quantity Generators, between 100 kg and 1000 kg of hazardous waste/month (Resource Conservation and Recovery Act (tracking hazardous waste)) - notification
BP OIL NO 08917 (6135 MONTGOMERY RD in CINCINNATI, OH)
STATE MASTER (Ohio general info) - AIR MAJOR, -31-5541-1038-G, EPCRA, RCRA-OHD987028842, HAZARDOUS WASTE PROGRAM Conditionally Exempt Small Quantity Generators, less than 100 kg/month of hazardous waste (Resource Conservation and Recovery Act (tracking hazardous waste)) - notification Organizations: BP OIL CO (CONTACT/OWNER)
, BP OIL COMPANY (CONTACT/OWNER)
Alternative names: BP OIL CO SITE 08917
BP OIL CO SITE 09052 (5362 RIDGE AVE in CINCINNATI, OH)
(Resource Conservation and Recovery Act (tracking hazardous waste)) Organizations: BP OIL COMPANY (CONTACT/OWNER)
A-ONE DRY CLEANERS, INC. (6223 MONTGOMERY ROAD in CINCINNATI, OH)
AIR MINOR (AIRS/AFS) Business SIC classification: DRYCLEANING PLANTS, EXCEPT RUG CLEANING
AYER ELECTRIC CO (3434 DUCK CREEK RD in CINCINNATI, OH)
COMPLIANCE ACTIVITY (Tracking inspections of insecticide, fungicide, and rodenticide, and toxic substances) TSD (Resource Conservation and Recovery Act (tracking hazardous waste)) Organizations: N/A (CONTACT/OWNER)
Housing units lacking complete plumbing facilities: 1.8%
Housing units lacking complete kitchen facilities: 1.0%
74.2% Utility gas 22.4% Electricity 2.1% No fuel used 1.1% Bottled, tank, or LP gas
Population in 1990: 14,333.
Place of birth for U.S.-born residents:
This state: 7,948Northeast: 567Midwest: 913South: 1,271West: 339
61% of the 45213 zip code residents lived in the same house 5 years ago.
Out of people who lived in different houses, 80% lived in this county.
Out of people who lived in different counties, 50% lived in Ohio.
92% of the 45213 zip code residents lived in the same house 1 year ago.
Out of people who lived in different houses, 72% moved from this county.
Out of people who lived in different houses, 6% moved from different county within same state.
Out of people who lived in different houses, 20% moved from different state.
Private vs. public school enrollment:
Students in private schools in grades 1 to 8 (elementary and middle school): 370
Students in private schools in grades 9 to 12 (high school): 90
Students in private undergraduate colleges:
Occupation by median earnings in the past 12 months ($)
99,218 Life, physical, and social science occupations 93,950 Architecture and engineering occupations 82,008 Management occupations 80,989 Business and financial operations occupations 74,103 Health diagnosing and treating practitioners and other technical occupations 72,771 Computer and mathematical occupations
Top industries in this zip code by the number of employees in 2005:
Accommodation and Food Services: Limited-Service Restaurants (20-49 employees: 6 establishments, 10-19 employees: 5 establishments, 5-9 employees: 1 establishment)Health Care and Social Assistance: Nursing Care Facilities (100-249: 1, 50-99: 1)Construction: Plumbing, Heating, and Air-Conditioning Contractors (100-249: 1, 10-19: 2, 5-9: 1)Other Services (except Public Administration): Industrial Launderers (100-249: 1)Health Care and Social Assistance: Diagnostic Imaging Centers (50-99: 1, 10-19: 3, 5-9: 1, 1-4: 2)Wholesale Trade: Farm and Garden Machinery and Equipment Merchant Wholesalers (50-99: 1)
People in group quarters in 2010:
89 people in nursing facilities/skilled-nursing facilities
29 people in group homes intended for adults
10 people in residential treatment centers for juveniles (non-correctional)
5 people in residential treatment centers for adults
People in group quarters in 2000:
170 people in nursing homes
10 people in other group homes
Fatal accident statistics in 2014:
Fatal accident count: 1Vehicles involved in fatal accidents: 2Fatal accidents caused by drunken drivers: 0Fatalities: 1Persons involved in fatal accidents: 2Pedestrians involved in fatal accidents: 0
Fatal accident statistics in 2013:
Fatal accident count: 1Vehicles involved in fatal accidents: 3Fatal accidents caused by drunken drivers: 3Fatalities: 2Persons involved in fatal accidents: 3Pedestrians involved in fatal accidents: 0
Home Mortgage Disclosure Act Aggregated Statistics For Year 2009(Based on 4 full and 6 partial tracts) A) FHA, FSA/RHS & VA B) Conventional C) Refinancings D) Home Improvement Loans E) Loans on Dwellings For 5+ Families F) Non-occupant Loans on G) Loans On Manufactured Number Average Value Number Average Value Number Average Value Number Average Value Number Average Value Number Average Value Number Average Value
LOANS ORIGINATED 179 $127,410 102 $117,104 578 $131,495 31 $46,362 4 $437,552 41 $78,095 0 $0 APPLICATIONS APPROVED, NOT ACCEPTED 8 $105,612 8 $139,334 65 $115,440 8 $44,678 0 $0 0 $0 1 $38,540 APPLICATIONS DENIED 21 $109,843 28 $100,520 219 $118,193 56 $26,095 2 $123,750 19 $69,419 2 $24,750 APPLICATIONS WITHDRAWN 16 $101,501 7 $123,060 106 $131,967 3 $10,553 1 $548,120 7 $128,967 0 $0 FILES CLOSED FOR INCOMPLETENESS 5 $99,268 1 $30,400 32 $126,288 4 $38,488 0 $0 0 $0 0 $0
Aggregated Statistics For Year 2008(Based on 4 full and 6 partial tracts) A) FHA, FSA/RHS & VA B) Conventional C) Refinancings D) Home Improvement Loans E) Loans on Dwellings For 5+ Families F) Non-occupant Loans on G) Loans On Manufactured Number Average Value Number Average Value Number Average Value Number Average Value Number Average Value Number Average Value Number Average Value
LOANS ORIGINATED 102 $118,037 182 $118,466 261 $127,017 49 $19,146 9 $608,499 53 $83,966 2 $7,920 APPLICATIONS APPROVED, NOT ACCEPTED 6 $110,678 8 $60,085 31 $96,326 21 $21,904 0 $0 9 $86,714 0 $0 APPLICATIONS DENIED 10 $115,183 37 $98,333 264 $117,660 68 $27,192 5 $332,118 48 $102,204 2 $44,415 APPLICATIONS WITHDRAWN 13 $93,549 12 $64,989 114 $121,035 10 $36,781 1 $826,880 13 $107,398 0 $0 FILES CLOSED FOR INCOMPLETENESS 0 $0 1 $83,460 30 $110,185 10 $42,000 0 $0 3 $40,643 0 $0
Aggregated Statistics For Year 2007(Based on 4 full and 6 partial tracts) A) FHA, FSA/RHS & VA B) Conventional C) Refinancings D) Home Improvement Loans E) Loans on Dwellings For 5+ Families F) Non-occupant Loans on G) Loans On Manufactured Number Average Value Number Average Value Number Average Value Number Average Value Number Average Value Number Average Value Number Average Value
LOANS ORIGINATED 34 $132,891 356 $113,664 436 $107,362 94 $34,732 16 $598,542 146 $89,907 0 $0 APPLICATIONS APPROVED, NOT ACCEPTED 0 $0 56 $93,377 104 $111,814 28 $41,380 2 $160,275 22 $84,809 2 $21,215 APPLICATIONS DENIED 12 $104,369 130 $99,243 450 $120,343 155 $24,697 3 $143,293 103 $98,972 6 $55,365 APPLICATIONS WITHDRAWN 5 $81,068 37 $122,928 175 $111,907 8 $63,065 0 $0 24 $117,102 0 $0 FILES CLOSED FOR INCOMPLETENESS 1 $53,500 15 $103,002 55 $151,715 4 $62,520 0 $0 8 $120,894 0 $0
Aggregated Statistics For Year 2006(Based on 4 full and 6 partial tracts) A) FHA, FSA/RHS & VA B) Conventional C) Refinancings D) Home Improvement Loans E) Loans on Dwellings For 5+ Families F) Non-occupant Loans on G) Loans On Manufactured Number Average Value Number Average Value Number Average Value Number Average Value Number Average Value Number Average Value Number Average Value
LOANS ORIGINATED 52 $124,508 507 $106,511 605 $101,100 83 $35,675 9 $412,671 156 $91,251 0 $0 APPLICATIONS APPROVED, NOT ACCEPTED 0 $0 60 $105,694 142 $100,285 25 $28,515 0 $0 21 $111,480 1 $158,440 APPLICATIONS DENIED 6 $130,407 139 $92,026 489 $111,837 129 $34,022 0 $0 59 $103,202 0 $0 APPLICATIONS WITHDRAWN 5 $156,104 43 $104,875 237 $121,494 22 $46,820 0 $0 24 $79,138 0 $0 FILES CLOSED FOR INCOMPLETENESS 5 $97,858 18 $119,289 73 $124,044 4 $135,690 0 $0 8 $125,914 0 $0
Aggregated Statistics For Year 2005(Based on 4 full and 6 partial tracts) A) FHA, FSA/RHS & VA B) Conventional C) Refinancings D) Home Improvement Loans E) Loans on Dwellings For 5+ Families F) Non-occupant Loans on G) Loans On Manufactured Number Average Value Number Average Value Number Average Value Number Average Value Number Average Value Number Average Value Number Average Value
LOANS ORIGINATED 40 $127,303 507 $107,968 590 $105,622 105 $34,502 23 $516,791 192 $94,627 1 $23,710 APPLICATIONS APPROVED, NOT ACCEPTED 3 $93,580 73 $102,006 123 $97,000 27 $49,744 2 $249,480 21 $104,186 0 $0 APPLICATIONS DENIED 9 $95,173 120 $89,167 537 $106,234 143 $26,514 0 $0 64 $109,622 1 $39,520 APPLICATIONS WITHDRAWN 2 $110,655 33 $101,758 253 $116,728 23 $121,651 1 $128,900 23 $125,135 0 $0 FILES CLOSED FOR INCOMPLETENESS 2 $127,710 35 $92,039 44 $117,331 3 $63,280 0 $0 8 $116,644 0 $0
Aggregated Statistics For Year 2004(Based on 4 full and 6 partial tracts) A) FHA, FSA/RHS & VA B) Conventional C) Refinancings D) Home Improvement Loans E) Loans on Dwellings For 5+ Families F) Non-occupant Loans on G) Loans On Manufactured Number Average Value Number Average Value Number Average Value Number Average Value Number Average Value Number Average Value Number Average Value
LOANS ORIGINATED 53 $113,211 550 $107,169 825 $107,268 125 $45,428 11 $393,477 185 $92,144 0 $0 APPLICATIONS APPROVED, NOT ACCEPTED 6 $114,988 66 $107,405 190 $108,084 25 $21,790 1 $1,368,000 24 $111,844 2 $106,700 APPLICATIONS DENIED 24 $91,481 116 $95,184 451 $102,043 115 $28,261 2 $213,840 53 $97,813 0 $0 APPLICATIONS WITHDRAWN 9 $102,412 58 $99,360 254 $119,120 19 $27,782 0 $0 39 $117,891 0 $0 FILES CLOSED FOR INCOMPLETENESS 1 $69,920 12 $151,363 84 $107,423 7 $32,377 0 $0 8 $115,352 0 $0
Aggregated Statistics For Year 2003(Based on 4 full and 6 partial tracts) A) FHA, FSA/RHS & VA B) Conventional C) Refinancings D) Home Improvement Loans E) Loans on Dwellings For 5+ Families F) Non-occupant Loans on Number Average Value Number Average Value Number Average Value Number Average Value Number Average Value Number Average Value
LOANS ORIGINATED 67 $116,549 452 $114,724 1,670 $105,188 119 $20,546 13 $431,580 231 $93,130 APPLICATIONS APPROVED, NOT ACCEPTED 3 $108,087 63 $85,943 240 $98,897 34 $12,506 0 $0 35 $80,200 APPLICATIONS DENIED 16 $97,459 76 $100,839 599 $99,884 151 $15,156 2 $732,600 54 $93,341 APPLICATIONS WITHDRAWN 10 $95,224 38 $86,034 321 $110,296 10 $34,513 0 $0 27 $89,622 FILES CLOSED FOR INCOMPLETENESS 2 $107,170 24 $96,244 94 $91,673 12 $12,884 0 $0 21 $74,795
Aggregated Statistics For Year 2002(Based on 4 full and 6 partial tracts) A) FHA, FSA/RHS & VA B) Conventional C) Refinancings D) Home Improvement Loans E) Loans on Dwellings For 5+ Families F) Non-occupant Loans on Number Average Value Number Average Value Number Average Value Number Average Value Number Average Value Number Average Value
LOANS ORIGINATED 92 $106,255 424 $99,314 1,134 $100,784 129 $21,907 16 $308,758 156 $82,964 APPLICATIONS APPROVED, NOT ACCEPTED 8 $92,592 47 $85,313 253 $87,324 34 $17,092 0 $0 21 $78,622 APPLICATIONS DENIED 11 $87,740 88 $97,009 496 $93,207 129 $17,350 4 $205,920 29 $86,291 APPLICATIONS WITHDRAWN 9 $97,582 45 $105,136 270 $103,372 7 $51,283 0 $0 16 $110,946 FILES CLOSED FOR INCOMPLETENESS 3 $150,280 6 $103,768 79 $87,379 8 $23,304 0 $0 6 $68,992
Aggregated Statistics For Year 2001(Based on 4 full and 6 partial tracts) A) FHA, FSA/RHS & VA B) Conventional C) Refinancings D) Home Improvement Loans E) Loans on Dwellings For 5+ Families F) Non-occupant Loans on Number Average Value Number Average Value Number Average Value Number Average Value Number Average Value Number Average Value
LOANS ORIGINATED 132 $107,435 302 $99,338 1,011 $98,117 121 $15,060 7 $688,960 123 $82,372 APPLICATIONS APPROVED, NOT ACCEPTED 5 $96,298 31 $110,454 225 $91,810 39 $12,759 2 $322,740 14 $109,777 APPLICATIONS DENIED 3 $98,843 78 $88,554 561 $88,235 147 $13,854 0 $0 33 $84,610 APPLICATIONS WITHDRAWN 11 $102,057 33 $94,557 358 $84,768 24 $15,978 0 $0 14 $69,946 FILES CLOSED FOR INCOMPLETENESS 1 $52,290 6 $77,945 65 $92,838 15 $31,271 0 $0 1 $69,310
Aggregated Statistics For Year 2000(Based on 4 full and 6 partial tracts) A) FHA, FSA/RHS & VA B) Conventional C) Refinancings D) Home Improvement Loans E) Loans on Dwellings For 5+ Families F) Non-occupant Loans on Number Average Value Number Average Value Number Average Value Number Average Value Number Average Value Number Average Value
LOANS ORIGINATED 77 $95,008 302 $98,704 475 $78,427 154 $16,932 5 $180,676 88 $75,042 APPLICATIONS APPROVED, NOT ACCEPTED 10 $83,105 41 $69,046 134 $81,983 64 $11,199 2 $579,300 10 $96,117 APPLICATIONS DENIED 10 $79,892 56 $72,537 397 $78,325 179 $10,968 3 $216,120 19 $79,176 APPLICATIONS WITHDRAWN 14 $91,487 53 $89,821 179 $72,956 22 $25,430 2 $579,300 16 $73,695 FILES CLOSED FOR INCOMPLETENESS 1 $114,190 16 $51,785 61 $88,340 3 $18,273 0 $0 3 $89,153
Aggregated Statistics For Year 1999(Based on 2 full and 3 partial tracts) A) FHA, FSA/RHS & VA B) Conventional C) Refinancings D) Home Improvement Loans E) Loans on Dwellings For 5+ Families F) Non-occupant Loans on Number Average Value Number Average Value Number Average Value Number Average Value Number Average Value Number Average Value
LOANS ORIGINATED 62 $88,171 179 $98,041 386 $78,665 86 $11,531 7 $275,304 63 $90,760 APPLICATIONS APPROVED, NOT ACCEPTED 4 $92,512 15 $85,720 136 $73,221 27 $11,938 1 $145,200 9 $57,524 APPLICATIONS DENIED 4 $82,948 24 $70,698 209 $73,691 102 $8,588 2 $470,930 24 $72,214 APPLICATIONS WITHDRAWN 4 $73,048 23 $98,607 112 $74,020 10 $17,040 0 $0 10 $75,839 FILES CLOSED FOR INCOMPLETENESS 1 $52,400 3 $87,273 19 $70,336 3 $10,697 0 $0 3 $78,890
Private Mortgage Insurance Companies Aggregated Statistics For Year 2009(Based on 4 full and 6 partial tracts) A) Conventional B) Refinancings C) Non-occupant Loans on Number Average Value Number Average Value Number Average Value
LOANS ORIGINATED 31 $131,166 25 $146,447 0 $0 APPLICATIONS APPROVED, NOT ACCEPTED 4 $110,960 8 $131,070 1 $43,780 APPLICATIONS DENIED 13 $88,410 9 $117,484 0 $0 APPLICATIONS WITHDRAWN 3 $156,047 4 $129,468 0 $0 FILES CLOSED FOR INCOMPLETENESS 1 $33,440 0 $0 0 $0
Aggregated Statistics For Year 2008(Based on 4 full and 6 partial tracts) A) Conventional B) Refinancings C) Non-occupant Loans on Number Average Value Number Average Value Number Average Value
LOANS ORIGINATED 72 $136,727 20 $122,894 7 $108,910 APPLICATIONS APPROVED, NOT ACCEPTED 27 $105,504 12 $148,285 12 $65,238 APPLICATIONS DENIED 5 $153,178 0 $0 1 $88,160 APPLICATIONS WITHDRAWN 2 $117,810 0 $0 0 $0 FILES CLOSED FOR INCOMPLETENESS 2 $146,755 0 $0 0 $0
Aggregated Statistics For Year 2007(Based on 4 full and 6 partial tracts) A) Conventional B) Refinancings C) Non-occupant Loans on Number Average Value Number Average Value Number Average Value
LOANS ORIGINATED 166 $120,522 40 $142,464 12 $88,126 APPLICATIONS APPROVED, NOT ACCEPTED 34 $104,677 16 $175,884 5 $77,790 APPLICATIONS DENIED 3 $125,407 4 $124,068 3 $138,927 APPLICATIONS WITHDRAWN 6 $112,260 3 $105,247 1 $143,490 FILES CLOSED FOR INCOMPLETENESS 0 $0 2 $136,620 0 $0
Aggregated Statistics For Year 2006(Based on 4 full and 6 partial tracts) A) Conventional B) Refinancings C) Non-occupant Loans on Number Average Value Number Average Value Number Average Value
LOANS ORIGINATED 110 $113,563 40 $131,118 22 $107,648 APPLICATIONS APPROVED, NOT ACCEPTED 16 $111,962 12 $107,259 7 $115,193 APPLICATIONS DENIED 4 $71,280 0 $0 0 $0 APPLICATIONS WITHDRAWN 2 $103,360 7 $110,551 0 $0 FILES CLOSED FOR INCOMPLETENESS 0 $0 1 $103,360 1 $103,360
Aggregated Statistics For Year 2005(Based on 4 full and 6 partial tracts) A) Conventional B) Refinancings C) Non-occupant Loans on Number Average Value Number Average Value Number Average Value
LOANS ORIGINATED 65 $126,056 30 $138,953 13 $90,926 APPLICATIONS APPROVED, NOT ACCEPTED 9 $108,788 14 $149,569 4 $61,295 APPLICATIONS DENIED 4 $117,245 2 $110,880 3 $103,833 APPLICATIONS WITHDRAWN 0 $0 6 $99,977 0 $0 FILES CLOSED FOR INCOMPLETENESS 0 $0 2 $96,550 2 $96,550
Aggregated Statistics For Year 2004(Based on 4 full and 6 partial tracts) A) Conventional B) Refinancings C) Non-occupant Loans on Number Average Value Number Average Value Number Average Value
LOANS ORIGINATED 100 $110,522 58 $122,725 29 $98,697 APPLICATIONS APPROVED, NOT ACCEPTED 22 $103,316 28 $145,441 2 $100,980 APPLICATIONS DENIED 1 $117,050 0 $0 0 $0 APPLICATIONS WITHDRAWN 1 $148,450 29 $180,899 2 $129,690 FILES CLOSED FOR INCOMPLETENESS 0 $0 1 $175,570 0 $0
Aggregated Statistics For Year 2003(Based on 4 full and 6 partial tracts) A) Conventional B) Refinancings C) Non-occupant Loans on Number Average Value Number Average Value Number Average Value
LOANS ORIGINATED 104 $124,497 132 $123,424 26 $103,039 APPLICATIONS APPROVED, NOT ACCEPTED 23 $83,684 45 $123,521 10 $72,816 APPLICATIONS DENIED 1 $157,470 3 $122,913 2 $114,610 APPLICATIONS WITHDRAWN 5 $121,408 22 $122,366 3 $126,630 FILES CLOSED FOR INCOMPLETENESS 0 $0 2 $96,550 0 $0
Aggregated Statistics For Year 2002(Based on 4 full and 6 partial tracts) A) Conventional B) Refinancings C) Non-occupant Loans on Number Average Value Number Average Value Number Average Value
LOANS ORIGINATED 134 $112,184 147 $113,820 35 $96,076 APPLICATIONS APPROVED, NOT ACCEPTED 5 $108,644 38 $115,662 3 $87,400 APPLICATIONS DENIED 3 $89,817 9 $124,361 6 $116,962 APPLICATIONS WITHDRAWN 5 $128,572 8 $100,362 2 $132,275 FILES CLOSED FOR INCOMPLETENESS 0 $0 2 $147,510 0 $0
Aggregated Statistics For Year 2001(Based on 4 full and 6 partial tracts) A) Conventional B) Refinancings C) Non-occupant Loans on Number Average Value Number Average Value Number Average Value
LOANS ORIGINATED 117 $118,608 111 $114,552 11 $106,705 APPLICATIONS APPROVED, NOT ACCEPTED 17 $146,301 32 $124,389 3 $116,143 APPLICATIONS DENIED 3 $145,703 9 $111,249 1 $56,540 APPLICATIONS WITHDRAWN 5 $94,802 9 $102,524 2 $89,100 FILES CLOSED FOR INCOMPLETENESS 1 $76,610 1 $105,630 0 $0
Aggregated Statistics For Year 2000(Based on 4 full and 6 partial tracts) A) Conventional B) Refinancings C) Non-occupant Loans on Number Average Value Number Average Value Number Average Value
LOANS ORIGINATED 115 $102,700 34 $104,324 16 $94,874 APPLICATIONS APPROVED, NOT ACCEPTED 16 $109,421 10 $121,818 4 $130,185 APPLICATIONS DENIED 1 $115,520 8 $97,165 2 $102,960 APPLICATIONS WITHDRAWN 1 $214,110 0 $0 1 $214,110 FILES CLOSED FOR INCOMPLETENESS 2 $85,140 0 $0 0 $0
Aggregated Statistics For Year 1999(Based on 2 full and 3 partial tracts) A) Conventional B) Refinancings C) Non-occupant Loans on Number Average Value Number Average Value Number Average Value
LOANS ORIGINATED 63 $108,217 26 $97,807 5 $78,672 APPLICATIONS APPROVED, NOT ACCEPTED 5 $133,248 3 $76,017 1 $93,200 APPLICATIONS DENIED 0 $0 3 $99,610 0 $0 APPLICATIONS WITHDRAWN 0 $0 1 $156,950 0 $0 FILES CLOSED FOR INCOMPLETENESS 1 $123,620 0 $0 1 $123,620
2002 - 2018 National Fire Incident Reporting System (NFIRS) incidents See full 2006 National Fire Incident Reporting System statistics for zip code 45213, Ohio
Most common first names in zip code 45213 among deceased individuals Name Count Lived (average)
Mary 149 81.0 years William 133 75.6 years John 129 75.9 years Robert 105 73.1 years James 100 72.4 years Helen 83 78.1 years Charles 70 74.4 years Margaret 70 80.5 years George 62 78.2 years Joseph 61 75.9 years
Most common last names in zip code 45213 among deceased individuals Last name Count Lived (average)
Smith 49 75.4 years Johnson 49 74.6 years Williams 29 77.1 years Brown 28 73.8 years Jones 28 75.9 years Davis 27 72.7 years Wilson 21 70.9 years Moore 21 76.6 years Miller 20 76.2 years Martin 20 76.9 years
Businesses in zip code 45213
Name Count Name Count
AutoZone 1 Motel 6 1 Burger King 1 Office Depot 1 Days Inn 1 Payless 1 Fashion Bug 1 T-Mobile 1 GameStop 1 Taco Bell 1 Home Depot 1 The Room Place 1 Long John Silver's 1 UPS 2 Lowe's 1 Wendy's 1 McDonald's 1 White Castle 1

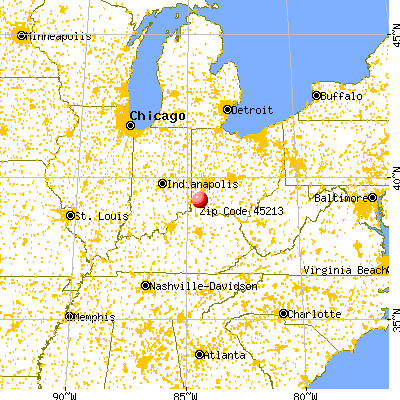


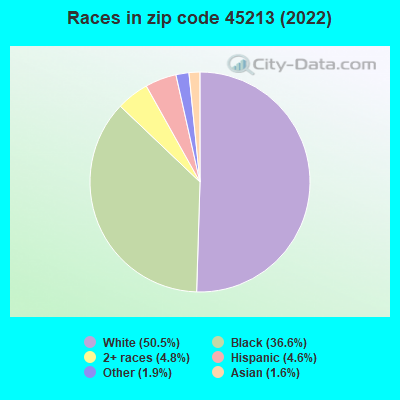


 Nearest zip codes: 45209, 45237, 45212, 45236, 45227, 45208.
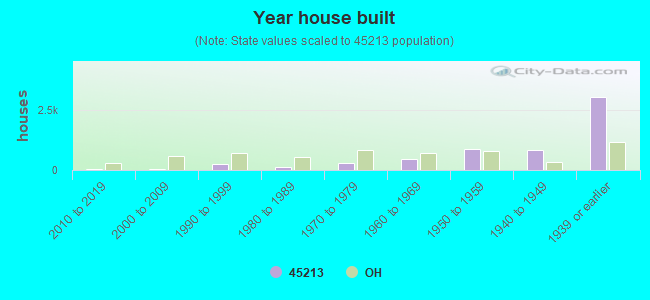

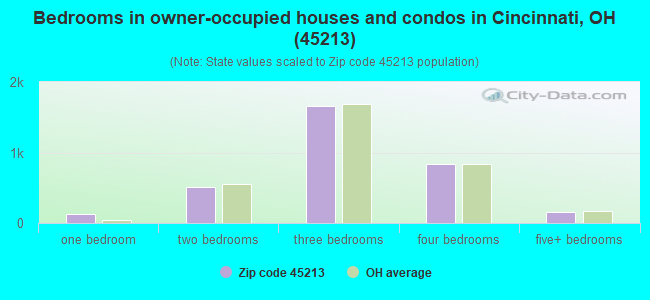
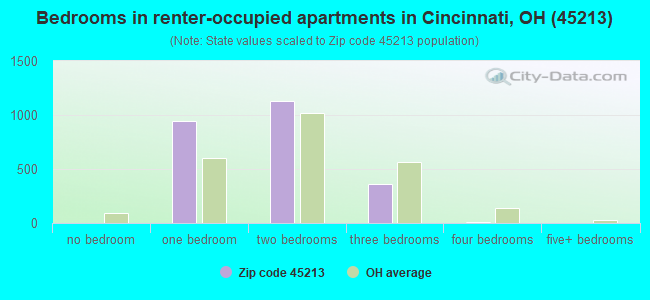
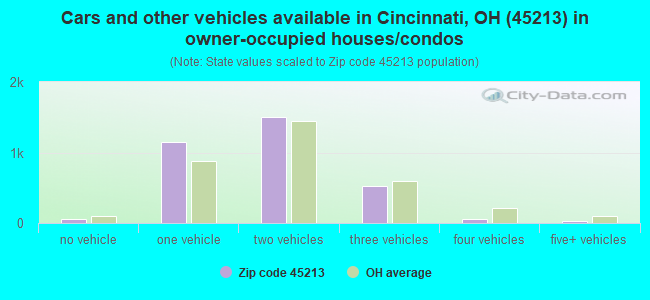
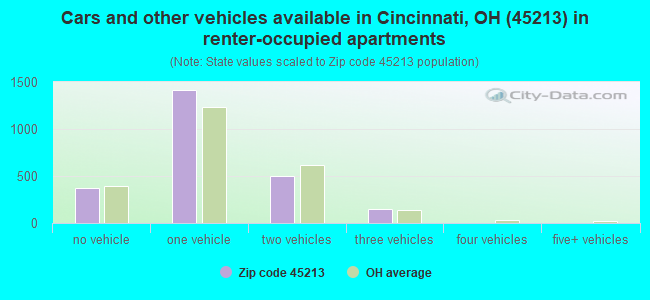


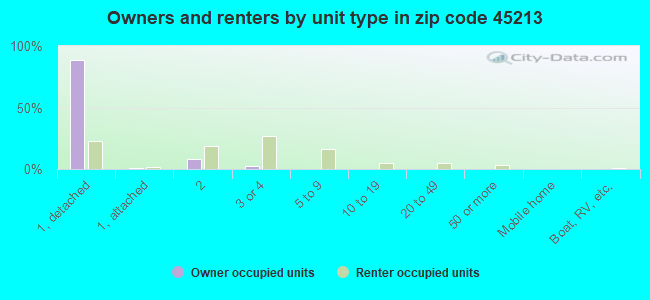
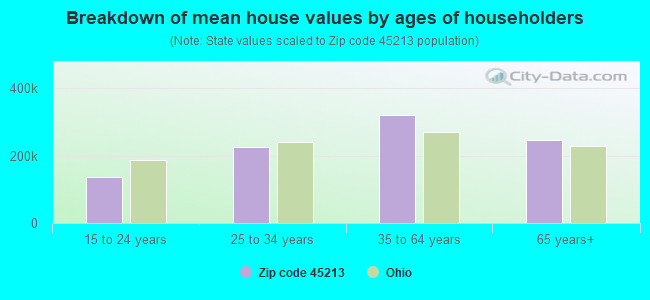


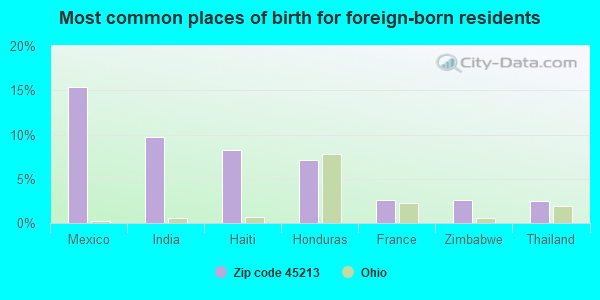
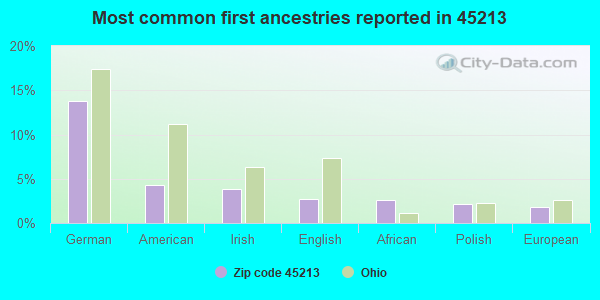
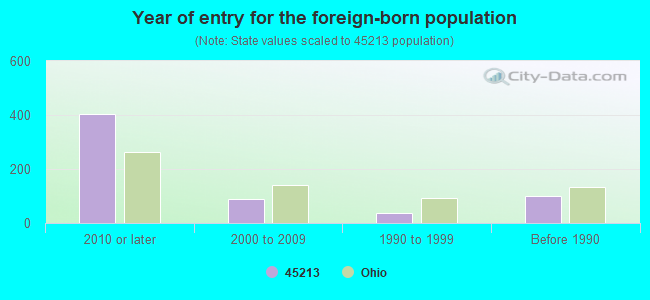


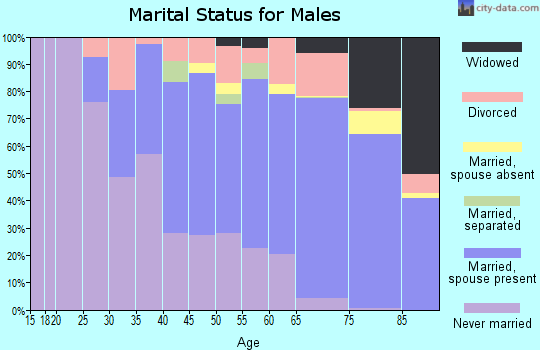

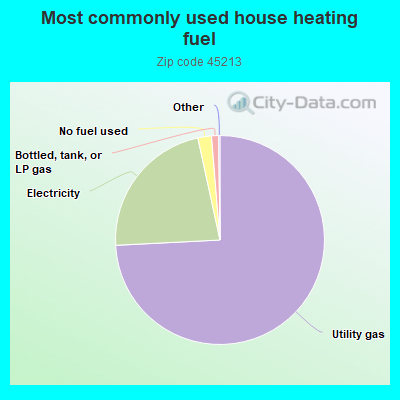
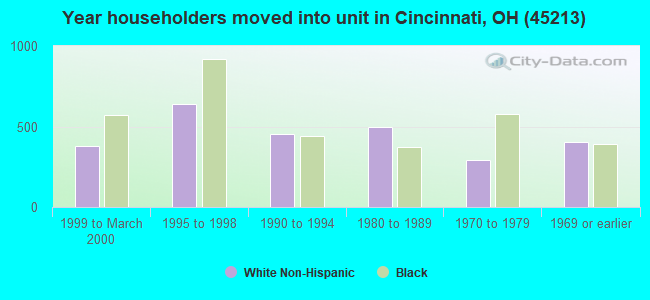
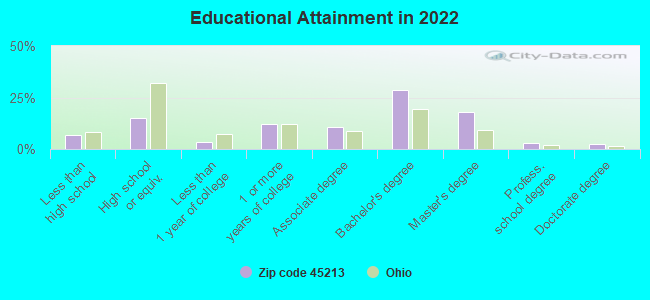
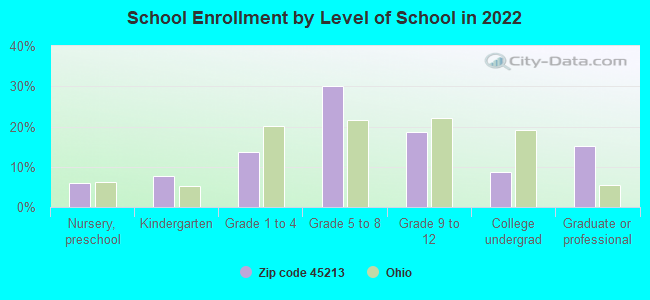
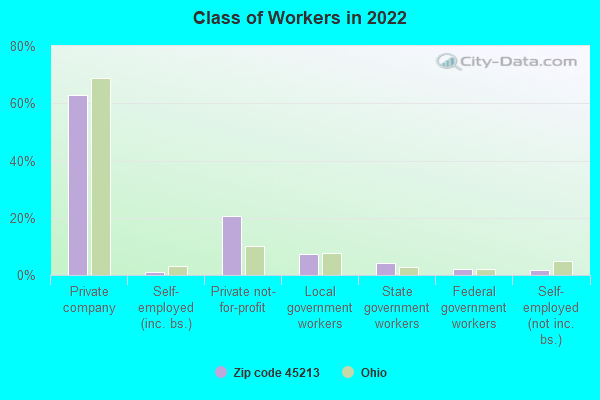
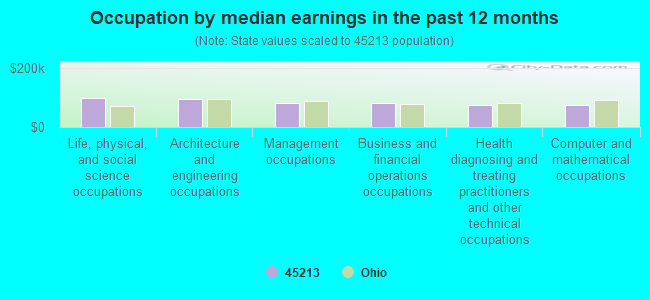
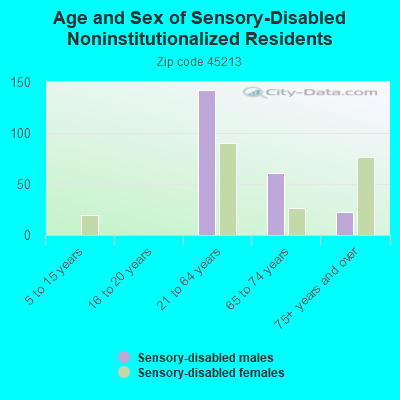
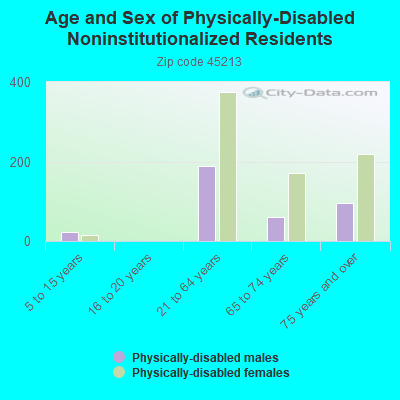
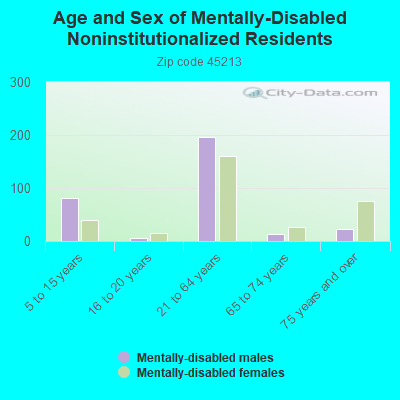
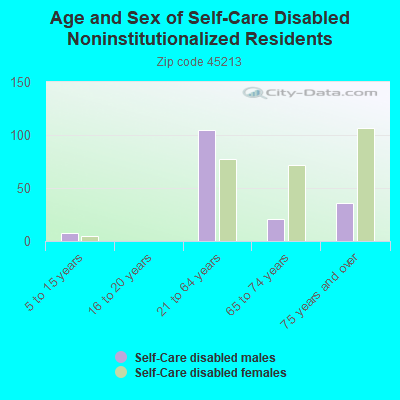
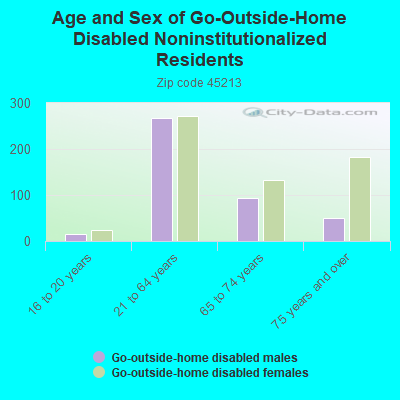
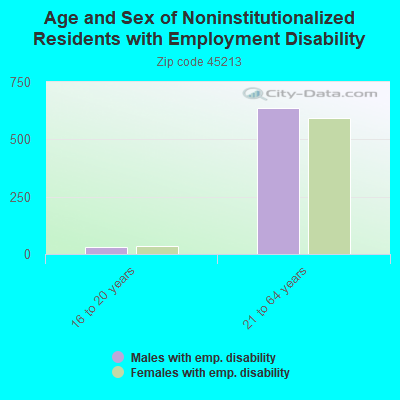
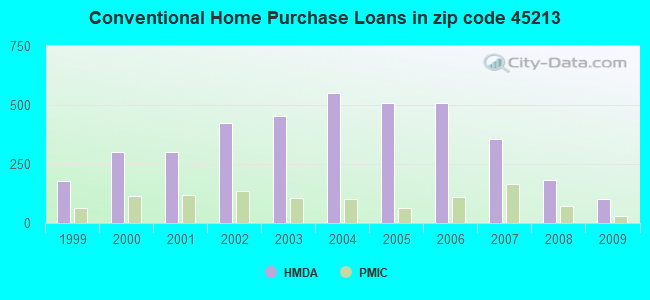
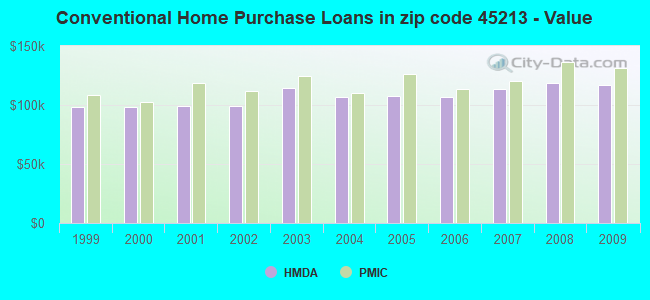
 According to the data from the years 2002 - 2018 the average number of fire incidents per year is 44. The highest number of reported fires - 82 took place in 2007, and the least - 21 in 2017. The data has a rising trend.
 When looking into fire subcategories, the most reports belonged to: Structure Fires (38.8%), and Outside Fires (28.5%).