Estimated zip code population in 2022: 17,882
Zip code population in 2010: 17,614
Zip code population in 2000: 17,286
Houses and condos: 8,957
Renter-occupied apartments: 3,052
% of renters here:
36%State:
33%
March 2022 cost of living index in zip code 45208: 90.3
(less than average, U.S. average is 100)
Land area: 4.2
sq. mi.
Water area: 0.0
sq. mi.
Population density: 4,212 people per square mile (average).
OSM Map
General Map
Google Map
MSN Map
OSM Map
General Map
Google Map
MSN Map
OSM Map
General Map
Google Map
MSN Map
OSM Map
General Map
Google Map
MSN Map
Please wait while loading the map...
Real estate property taxes paid for housing units in 2022:
This zip code:
1.7% ($9,097)Ohio:
1.3% ($2,639)
Median real estate property taxes paid for housing units with mortgages in 2022: $9,213 (1.7%)
Median real estate property taxes paid for housing units with no mortgage in 2022: $8,793 (1.7%)
Profiles of local businesses
Business Search - 14 Million verified businesses
Males: 8,650 Females: 9,232
For population 25 years and over in 45208:
High school or higher: 103.0%Bachelor's degree or higher: 86.5%Graduate or professional degree: 44.4%Unemployed: 1.1%Mean travel time to work (commute): 21.6 minutes
For population 15 years and over in 45208:
Never married: 37.2%Now married: 50.8%Separated: 0.5%Widowed: 3.9%Divorced: 7.6%
Zip code 45208 compared to state average:
Median household income above state average. Median house value significantly above state average. Unemployed percentage significantly below state average. Black race population percentage significantly below state average. House age above state average. Percentage of population with a bachelor's degree or higher significantly above state average. 15,299 85.6% White 790 4.4% Hispanic or Latino 715 4.0% Black 635 3.6% Asian 370 2.1% Two or more races 69 0.4% Some other race
Data:
Median household income ($)
Median household income (% change since 2000)
Household income diversity
Ratio of average income to average house value (%)
Ratio of average income to average rent
Median household income ($) - White
Median household income ($) - Black or African American
Median household income ($) - Asian
Median household income ($) - Hispanic or Latino
Median household income ($) - American Indian and Alaska Native
Median household income ($) - Multirace
Median household income ($) - Other Race
Median household income for houses/condos with a mortgage ($)
Median household income for apartments without a mortgage ($)
Races - White alone (%)
Races - White alone (% change since 2000)
Races - Black alone (%)
Races - Black alone (% change since 2000)
Races - American Indian alone (%)
Races - American Indian alone (% change since 2000)
Races - Asian alone (%)
Races - Asian alone (% change since 2000)
Races - Hispanic (%)
Races - Hispanic (% change since 2000)
Races - Native Hawaiian and Other Pacific Islander alone (%)
Races - Native Hawaiian and Other Pacific Islander alone (% change since 2000)
Races - Two or more races (%)
Races - Two or more races (% change since 2000)
Races - Other race alone (%)
Races - Other race alone (% change since 2000)
Racial diversity
Unemployment (%)
Unemployment (% change since 2000)
Unemployment (%) - White
Unemployment (%) - Black or African American
Unemployment (%) - Asian
Unemployment (%) - Hispanic or Latino
Unemployment (%) - American Indian and Alaska Native
Unemployment (%) - Multirace
Unemployment (%) - Other Race
Population density (people per square mile)
Population - Males (%)
Population - Females (%)
Population - Males (%) - White
Population - Males (%) - Black or African American
Population - Males (%) - Asian
Population - Males (%) - Hispanic or Latino
Population - Males (%) - American Indian and Alaska Native
Population - Males (%) - Multirace
Population - Males (%) - Other Race
Population - Females (%) - White
Population - Females (%) - Black or African American
Population - Females (%) - Asian
Population - Females (%) - Hispanic or Latino
Population - Females (%) - American Indian and Alaska Native
Population - Females (%) - Multirace
Population - Females (%) - Other Race
Coronavirus confirmed cases (Apr 27, 2024)
Deaths caused by coronavirus (Apr 27, 2024)
Coronavirus confirmed cases (per 100k population) (Apr 27, 2024)
Deaths caused by coronavirus (per 100k population) (Apr 27, 2024)
Daily increase in number of cases (Apr 27, 2024)
Weekly increase in number of cases (Apr 27, 2024)
Cases doubled (in days) (Apr 27, 2024)
Hospitalized patients (Apr 18, 2022)
Negative test results (Apr 18, 2022)
Total test results (Apr 18, 2022)
COVID Vaccine doses distributed (per 100k population) (Sep 19, 2023)
COVID Vaccine doses administered (per 100k population) (Sep 19, 2023)
COVID Vaccine doses distributed (Sep 19, 2023)
COVID Vaccine doses administered (Sep 19, 2023)
Likely homosexual households (%)
Likely homosexual households (% change since 2000)
Likely homosexual households - Lesbian couples (%)
Likely homosexual households - Lesbian couples (% change since 2000)
Likely homosexual households - Gay men (%)
Likely homosexual households - Gay men (% change since 2000)
Cost of living index
Median gross rent ($)
Median contract rent ($)
Median monthly housing costs ($)
Median house or condo value ($)
Median house or condo value ($ change since 2000)
Mean house or condo value by units in structure - 1, detached ($)
Mean house or condo value by units in structure - 1, attached ($)
Mean house or condo value by units in structure - 2 ($)
Mean house or condo value by units in structure by units in structure - 3 or 4 ($)
Mean house or condo value by units in structure - 5 or more ($)
Mean house or condo value by units in structure - Boat, RV, van, etc. ($)
Mean house or condo value by units in structure - Mobile home ($)
Median house or condo value ($) - White
Median house or condo value ($) - Black or African American
Median house or condo value ($) - Asian
Median house or condo value ($) - Hispanic or Latino
Median house or condo value ($) - American Indian and Alaska Native
Median house or condo value ($) - Multirace
Median house or condo value ($) - Other Race
Median resident age
Resident age diversity
Median resident age - Males
Median resident age - Females
Median resident age - White
Median resident age - Black or African American
Median resident age - Asian
Median resident age - Hispanic or Latino
Median resident age - American Indian and Alaska Native
Median resident age - Multirace
Median resident age - Other Race
Median resident age - Males - White
Median resident age - Males - Black or African American
Median resident age - Males - Asian
Median resident age - Males - Hispanic or Latino
Median resident age - Males - American Indian and Alaska Native
Median resident age - Males - Multirace
Median resident age - Males - Other Race
Median resident age - Females - White
Median resident age - Females - Black or African American
Median resident age - Females - Asian
Median resident age - Females - Hispanic or Latino
Median resident age - Females - American Indian and Alaska Native
Median resident age - Females - Multirace
Median resident age - Females - Other Race
Commute - mean travel time to work (minutes)
Travel time to work - Less than 5 minutes (%)
Travel time to work - Less than 5 minutes (% change since 2000)
Travel time to work - 5 to 9 minutes (%)
Travel time to work - 5 to 9 minutes (% change since 2000)
Travel time to work - 10 to 19 minutes (%)
Travel time to work - 10 to 19 minutes (% change since 2000)
Travel time to work - 20 to 29 minutes (%)
Travel time to work - 20 to 29 minutes (% change since 2000)
Travel time to work - 30 to 39 minutes (%)
Travel time to work - 30 to 39 minutes (% change since 2000)
Travel time to work - 40 to 59 minutes (%)
Travel time to work - 40 to 59 minutes (% change since 2000)
Travel time to work - 60 to 89 minutes (%)
Travel time to work - 60 to 89 minutes (% change since 2000)
Travel time to work - 90 or more minutes (%)
Travel time to work - 90 or more minutes (% change since 2000)
Marital status - Never married (%)
Marital status - Now married (%)
Marital status - Separated (%)
Marital status - Widowed (%)
Marital status - Divorced (%)
Median family income ($)
Median family income (% change since 2000)
Median non-family income ($)
Median non-family income (% change since 2000)
Median per capita income ($)
Median per capita income (% change since 2000)
Median family income ($) - White
Median family income ($) - Black or African American
Median family income ($) - Asian
Median family income ($) - Hispanic or Latino
Median family income ($) - American Indian and Alaska Native
Median family income ($) - Multirace
Median family income ($) - Other Race
Median year house/condo built
Median year apartment built
Year house built - Built 2005 or later (%)
Year house built - Built 2000 to 2004 (%)
Year house built - Built 1990 to 1999 (%)
Year house built - Built 1980 to 1989 (%)
Year house built - Built 1970 to 1979 (%)
Year house built - Built 1960 to 1969 (%)
Year house built - Built 1950 to 1959 (%)
Year house built - Built 1940 to 1949 (%)
Year house built - Built 1939 or earlier (%)
Average household size
Household density (households per square mile)
Average household size - White
Average household size - Black or African American
Average household size - Asian
Average household size - Hispanic or Latino
Average household size - American Indian and Alaska Native
Average household size - Multirace
Average household size - Other Race
Occupied housing units (%)
Vacant housing units (%)
Owner occupied housing units (%)
Renter occupied housing units (%)
Vacancy status - For rent (%)
Vacancy status - For sale only (%)
Vacancy status - Rented or sold, not occupied (%)
Vacancy status - For seasonal, recreational, or occasional use (%)
Vacancy status - For migrant workers (%)
Vacancy status - Other vacant (%)
Residents with income below the poverty level (%)
Residents with income below 50% of the poverty level (%)
Children below poverty level (%)
Poor families by family type - Married-couple family (%)
Poor families by family type - Male, no wife present (%)
Poor families by family type - Female, no husband present (%)
Poverty status for native-born residents (%)
Poverty status for foreign-born residents (%)
Poverty among high school graduates not in families (%)
Poverty among people who did not graduate high school not in families (%)
Residents with income below the poverty level (%) - White
Residents with income below the poverty level (%) - Black or African American
Residents with income below the poverty level (%) - Asian
Residents with income below the poverty level (%) - Hispanic or Latino
Residents with income below the poverty level (%) - American Indian and Alaska Native
Residents with income below the poverty level (%) - Multirace
Residents with income below the poverty level (%) - Other Race
Air pollution - Air Quality Index (AQI)
Air pollution - CO
Air pollution - NO2
Air pollution - SO2
Air pollution - Ozone
Air pollution - PM10
Air pollution - PM25
Air pollution - Pb
Crime - Murders per 100,000 population
Crime - Rapes per 100,000 population
Crime - Robberies per 100,000 population
Crime - Assaults per 100,000 population
Crime - Burglaries per 100,000 population
Crime - Thefts per 100,000 population
Crime - Auto thefts per 100,000 population
Crime - Arson per 100,000 population
Crime - City-data.com crime index
Crime - Violent crime index
Crime - Property crime index
Crime - Murders per 100,000 population (5 year average)
Crime - Rapes per 100,000 population (5 year average)
Crime - Robberies per 100,000 population (5 year average)
Crime - Assaults per 100,000 population (5 year average)
Crime - Burglaries per 100,000 population (5 year average)
Crime - Thefts per 100,000 population (5 year average)
Crime - Auto thefts per 100,000 population (5 year average)
Crime - Arson per 100,000 population (5 year average)
Crime - City-data.com crime index (5 year average)
Crime - Violent crime index (5 year average)
Crime - Property crime index (5 year average)
1996 Presidential Elections Results (%) - Democratic Party (Clinton)
1996 Presidential Elections Results (%) - Republican Party (Dole)
1996 Presidential Elections Results (%) - Other
2000 Presidential Elections Results (%) - Democratic Party (Gore)
2000 Presidential Elections Results (%) - Republican Party (Bush)
2000 Presidential Elections Results (%) - Other
2004 Presidential Elections Results (%) - Democratic Party (Kerry)
2004 Presidential Elections Results (%) - Republican Party (Bush)
2004 Presidential Elections Results (%) - Other
2008 Presidential Elections Results (%) - Democratic Party (Obama)
2008 Presidential Elections Results (%) - Republican Party (McCain)
2008 Presidential Elections Results (%) - Other
2012 Presidential Elections Results (%) - Democratic Party (Obama)
2012 Presidential Elections Results (%) - Republican Party (Romney)
2012 Presidential Elections Results (%) - Other
2016 Presidential Elections Results (%) - Democratic Party (Clinton)
2016 Presidential Elections Results (%) - Republican Party (Trump)
2016 Presidential Elections Results (%) - Other
2020 Presidential Elections Results (%) - Democratic Party (Biden)
2020 Presidential Elections Results (%) - Republican Party (Trump)
2020 Presidential Elections Results (%) - Other
Ancestries Reported - Arab (%)
Ancestries Reported - Czech (%)
Ancestries Reported - Danish (%)
Ancestries Reported - Dutch (%)
Ancestries Reported - English (%)
Ancestries Reported - French (%)
Ancestries Reported - French Canadian (%)
Ancestries Reported - German (%)
Ancestries Reported - Greek (%)
Ancestries Reported - Hungarian (%)
Ancestries Reported - Irish (%)
Ancestries Reported - Italian (%)
Ancestries Reported - Lithuanian (%)
Ancestries Reported - Norwegian (%)
Ancestries Reported - Polish (%)
Ancestries Reported - Portuguese (%)
Ancestries Reported - Russian (%)
Ancestries Reported - Scotch-Irish (%)
Ancestries Reported - Scottish (%)
Ancestries Reported - Slovak (%)
Ancestries Reported - Subsaharan African (%)
Ancestries Reported - Swedish (%)
Ancestries Reported - Swiss (%)
Ancestries Reported - Ukrainian (%)
Ancestries Reported - United States (%)
Ancestries Reported - Welsh (%)
Ancestries Reported - West Indian (%)
Ancestries Reported - Other (%)
Educational Attainment - No schooling completed (%)
Educational Attainment - Less than high school (%)
Educational Attainment - High school or equivalent (%)
Educational Attainment - Less than 1 year of college (%)
Educational Attainment - 1 or more years of college (%)
Educational Attainment - Associate degree (%)
Educational Attainment - Bachelor's degree (%)
Educational Attainment - Master's degree (%)
Educational Attainment - Professional school degree (%)
Educational Attainment - Doctorate degree (%)
School Enrollment - Nursery, preschool (%)
School Enrollment - Kindergarten (%)
School Enrollment - Grade 1 to 4 (%)
School Enrollment - Grade 5 to 8 (%)
School Enrollment - Grade 9 to 12 (%)
School Enrollment - College undergrad (%)
School Enrollment - Graduate or professional (%)
School Enrollment - Not enrolled in school (%)
School enrollment - Public schools (%)
School enrollment - Private schools (%)
School enrollment - Not enrolled (%)
Median number of rooms in houses and condos
Median number of rooms in apartments
Housing units lacking complete plumbing facilities (%)
Housing units lacking complete kitchen facilities (%)
Density of houses
Urban houses (%)
Rural houses (%)
Households with people 60 years and over (%)
Households with people 65 years and over (%)
Households with people 75 years and over (%)
Households with one or more nonrelatives (%)
Households with no nonrelatives (%)
Population in households (%)
Family households (%)
Nonfamily households (%)
Population in families (%)
Family households with own children (%)
Median number of bedrooms in owner occupied houses
Mean number of bedrooms in owner occupied houses
Median number of bedrooms in renter occupied houses
Mean number of bedrooms in renter occupied houses
Median number of vehichles in owner occupied houses
Mean number of vehichles in owner occupied houses
Median number of vehichles in renter occupied houses
Mean number of vehichles in renter occupied houses
Mortgage status - with mortgage (%)
Mortgage status - with second mortgage (%)
Mortgage status - with home equity loan (%)
Mortgage status - with both second mortgage and home equity loan (%)
Mortgage status - without a mortgage (%)
Average family size
Average family size - White
Average family size - Black or African American
Average family size - Asian
Average family size - Hispanic or Latino
Average family size - American Indian and Alaska Native
Average family size - Multirace
Average family size - Other Race
Geographical mobility - Same house 1 year ago (%)
Geographical mobility - Moved within same county (%)
Geographical mobility - Moved from different county within same state (%)
Geographical mobility - Moved from different state (%)
Geographical mobility - Moved from abroad (%)
Place of birth - Born in state of residence (%)
Place of birth - Born in other state (%)
Place of birth - Native, outside of US (%)
Place of birth - Foreign born (%)
Housing units in structures - 1, detached (%)
Housing units in structures - 1, attached (%)
Housing units in structures - 2 (%)
Housing units in structures - 3 or 4 (%)
Housing units in structures - 5 to 9 (%)
Housing units in structures - 10 to 19 (%)
Housing units in structures - 20 to 49 (%)
Housing units in structures - 50 or more (%)
Housing units in structures - Mobile home (%)
Housing units in structures - Boat, RV, van, etc. (%)
House/condo owner moved in on average (years ago)
Renter moved in on average (years ago)
Year householder moved into unit - Moved in 1999 to March 2000 (%)
Year householder moved into unit - Moved in 1995 to 1998 (%)
Year householder moved into unit - Moved in 1990 to 1994 (%)
Year householder moved into unit - Moved in 1980 to 1989 (%)
Year householder moved into unit - Moved in 1970 to 1979 (%)
Year householder moved into unit - Moved in 1969 or earlier (%)
Means of transportation to work - Drove car alone (%)
Means of transportation to work - Carpooled (%)
Means of transportation to work - Public transportation (%)
Means of transportation to work - Bus or trolley bus (%)
Means of transportation to work - Streetcar or trolley car (%)
Means of transportation to work - Subway or elevated (%)
Means of transportation to work - Railroad (%)
Means of transportation to work - Ferryboat (%)
Means of transportation to work - Taxicab (%)
Means of transportation to work - Motorcycle (%)
Means of transportation to work - Bicycle (%)
Means of transportation to work - Walked (%)
Means of transportation to work - Other means (%)
Working at home (%)
Industry diversity
Most Common Industries - Agriculture, forestry, fishing and hunting, and mining (%)
Most Common Industries - Agriculture, forestry, fishing and hunting (%)
Most Common Industries - Mining, quarrying, and oil and gas extraction (%)
Most Common Industries - Construction (%)
Most Common Industries - Manufacturing (%)
Most Common Industries - Wholesale trade (%)
Most Common Industries - Retail trade (%)
Most Common Industries - Transportation and warehousing, and utilities (%)
Most Common Industries - Transportation and warehousing (%)
Most Common Industries - Utilities (%)
Most Common Industries - Information (%)
Most Common Industries - Finance and insurance, and real estate and rental and leasing (%)
Most Common Industries - Finance and insurance (%)
Most Common Industries - Real estate and rental and leasing (%)
Most Common Industries - Professional, scientific, and management, and administrative and waste management services (%)
Most Common Industries - Professional, scientific, and technical services (%)
Most Common Industries - Management of companies and enterprises (%)
Most Common Industries - Administrative and support and waste management services (%)
Most Common Industries - Educational services, and health care and social assistance (%)
Most Common Industries - Educational services (%)
Most Common Industries - Health care and social assistance (%)
Most Common Industries - Arts, entertainment, and recreation, and accommodation and food services (%)
Most Common Industries - Arts, entertainment, and recreation (%)
Most Common Industries - Accommodation and food services (%)
Most Common Industries - Other services, except public administration (%)
Most Common Industries - Public administration (%)
Occupation diversity
Most Common Occupations - Management, business, science, and arts occupations (%)
Most Common Occupations - Management, business, and financial occupations (%)
Most Common Occupations - Management occupations (%)
Most Common Occupations - Business and financial operations occupations (%)
Most Common Occupations - Computer, engineering, and science occupations (%)
Most Common Occupations - Computer and mathematical occupations (%)
Most Common Occupations - Architecture and engineering occupations (%)
Most Common Occupations - Life, physical, and social science occupations (%)
Most Common Occupations - Education, legal, community service, arts, and media occupations (%)
Most Common Occupations - Community and social service occupations (%)
Most Common Occupations - Legal occupations (%)
Most Common Occupations - Education, training, and library occupations (%)
Most Common Occupations - Arts, design, entertainment, sports, and media occupations (%)
Most Common Occupations - Healthcare practitioners and technical occupations (%)
Most Common Occupations - Health diagnosing and treating practitioners and other technical occupations (%)
Most Common Occupations - Health technologists and technicians (%)
Most Common Occupations - Service occupations (%)
Most Common Occupations - Healthcare support occupations (%)
Most Common Occupations - Protective service occupations (%)
Most Common Occupations - Fire fighting and prevention, and other protective service workers including supervisors (%)
Most Common Occupations - Law enforcement workers including supervisors (%)
Most Common Occupations - Food preparation and serving related occupations (%)
Most Common Occupations - Building and grounds cleaning and maintenance occupations (%)
Most Common Occupations - Personal care and service occupations (%)
Most Common Occupations - Sales and office occupations (%)
Most Common Occupations - Sales and related occupations (%)
Most Common Occupations - Office and administrative support occupations (%)
Most Common Occupations - Natural resources, construction, and maintenance occupations (%)
Most Common Occupations - Farming, fishing, and forestry occupations (%)
Most Common Occupations - Construction and extraction occupations (%)
Most Common Occupations - Installation, maintenance, and repair occupations (%)
Most Common Occupations - Production, transportation, and material moving occupations (%)
Most Common Occupations - Production occupations (%)
Most Common Occupations - Transportation occupations (%)
Most Common Occupations - Material moving occupations (%)
People in Group quarters - Institutionalized population (%)
People in Group quarters - Correctional institutions (%)
People in Group quarters - Federal prisons and detention centers (%)
People in Group quarters - Halfway houses (%)
People in Group quarters - Local jails and other confinement facilities (including police lockups) (%)
People in Group quarters - Military disciplinary barracks (%)
People in Group quarters - State prisons (%)
People in Group quarters - Other types of correctional institutions (%)
People in Group quarters - Nursing homes (%)
People in Group quarters - Hospitals/wards, hospices, and schools for the handicapped (%)
People in Group quarters - Hospitals/wards and hospices for chronically ill (%)
People in Group quarters - Hospices or homes for chronically ill (%)
People in Group quarters - Military hospitals or wards for chronically ill (%)
People in Group quarters - Other hospitals or wards for chronically ill (%)
People in Group quarters - Hospitals or wards for drug/alcohol abuse (%)
People in Group quarters - Mental (Psychiatric) hospitals or wards (%)
People in Group quarters - Schools, hospitals, or wards for the mentally retarded (%)
People in Group quarters - Schools, hospitals, or wards for the physically handicapped (%)
People in Group quarters - Institutions for the deaf (%)
People in Group quarters - Institutions for the blind (%)
People in Group quarters - Orthopedic wards and institutions for the physically handicapped (%)
People in Group quarters - Wards in general hospitals for patients who have no usual home elsewhere (%)
People in Group quarters - Wards in military hospitals for patients who have no usual home elsewhere (%)
People in Group quarters - Juvenile institutions (%)
People in Group quarters - Long-term care (%)
People in Group quarters - Homes for abused, dependent, and neglected children (%)
People in Group quarters - Residential treatment centers for emotionally disturbed children (%)
People in Group quarters - Training schools for juvenile delinquents (%)
People in Group quarters - Short-term care, detention or diagnostic centers for delinquent children (%)
People in Group quarters - Type of juvenile institution unknown (%)
People in Group quarters - Noninstitutionalized population (%)
People in Group quarters - College dormitories (includes college quarters off campus) (%)
People in Group quarters - Military quarters (%)
People in Group quarters - On base (%)
People in Group quarters - Barracks, unaccompanied personnel housing (UPH), (Enlisted/Officer), ;and similar group living quarters for military personnel (%)
People in Group quarters - Transient quarters for temporary residents (%)
People in Group quarters - Military ships (%)
People in Group quarters - Group homes (%)
People in Group quarters - Homes or halfway houses for drug/alcohol abuse (%)
People in Group quarters - Homes for the mentally ill (%)
People in Group quarters - Homes for the mentally retarded (%)
People in Group quarters - Homes for the physically handicapped (%)
People in Group quarters - Other group homes (%)
People in Group quarters - Religious group quarters (%)
People in Group quarters - Dormitories (%)
People in Group quarters - Agriculture workers' dormitories on farms (%)
People in Group quarters - Job Corps and vocational training facilities (%)
People in Group quarters - Other workers' dormitories (%)
People in Group quarters - Crews of maritime vessels (%)
People in Group quarters - Other nonhousehold living situations (%)
People in Group quarters - Other noninstitutional group quarters (%)
Residents speaking English at home (%)
Residents speaking English at home - Born in the United States (%)
Residents speaking English at home - Native, born elsewhere (%)
Residents speaking English at home - Foreign born (%)
Residents speaking Spanish at home (%)
Residents speaking Spanish at home - Born in the United States (%)
Residents speaking Spanish at home - Native, born elsewhere (%)
Residents speaking Spanish at home - Foreign born (%)
Residents speaking other language at home (%)
Residents speaking other language at home - Born in the United States (%)
Residents speaking other language at home - Native, born elsewhere (%)
Residents speaking other language at home - Foreign born (%)
Class of Workers - Employee of private company (%)
Class of Workers - Self-employed in own incorporated business (%)
Class of Workers - Private not-for-profit wage and salary workers (%)
Class of Workers - Local government workers (%)
Class of Workers - State government workers (%)
Class of Workers - Federal government workers (%)
Class of Workers - Self-employed workers in own not incorporated business and Unpaid family workers (%)
House heating fuel used in houses and condos - Utility gas (%)
House heating fuel used in houses and condos - Bottled, tank, or LP gas (%)
House heating fuel used in houses and condos - Electricity (%)
House heating fuel used in houses and condos - Fuel oil, kerosene, etc. (%)
House heating fuel used in houses and condos - Coal or coke (%)
House heating fuel used in houses and condos - Wood (%)
House heating fuel used in houses and condos - Solar energy (%)
House heating fuel used in houses and condos - Other fuel (%)
House heating fuel used in houses and condos - No fuel used (%)
House heating fuel used in apartments - Utility gas (%)
House heating fuel used in apartments - Bottled, tank, or LP gas (%)
House heating fuel used in apartments - Electricity (%)
House heating fuel used in apartments - Fuel oil, kerosene, etc. (%)
House heating fuel used in apartments - Coal or coke (%)
House heating fuel used in apartments - Wood (%)
House heating fuel used in apartments - Solar energy (%)
House heating fuel used in apartments - Other fuel (%)
House heating fuel used in apartments - No fuel used (%)
Armed forces status - In Armed Forces (%)
Armed forces status - Civilian (%)
Armed forces status - Civilian - Veteran (%)
Armed forces status - Civilian - Nonveteran (%)
Fatal accidents locations in years 2005-2021
Fatal accidents locations in 2005
Fatal accidents locations in 2006
Fatal accidents locations in 2007
Fatal accidents locations in 2008
Fatal accidents locations in 2009
Fatal accidents locations in 2010
Fatal accidents locations in 2011
Fatal accidents locations in 2012
Fatal accidents locations in 2013
Fatal accidents locations in 2014
Fatal accidents locations in 2015
Fatal accidents locations in 2016
Fatal accidents locations in 2017
Fatal accidents locations in 2018
Fatal accidents locations in 2019
Fatal accidents locations in 2020
Fatal accidents locations in 2021
Alcohol use - People drinking some alcohol every month (%)
Alcohol use - People not drinking at all (%)
Alcohol use - Average days/month drinking alcohol
Alcohol use - Average drinks/week
Alcohol use - Average days/year people drink much
Audiometry - Average condition of hearing (%)
Audiometry - People that can hear a whisper from across a quiet room (%)
Audiometry - People that can hear normal voice from across a quiet room (%)
Audiometry - Ears ringing, roaring, buzzing (%)
Audiometry - Had a job exposure to loud noise (%)
Audiometry - Had off-work exposure to loud noise (%)
Blood Pressure & Cholesterol - Has high blood pressure (%)
Blood Pressure & Cholesterol - Checking blood pressure at home (%)
Blood Pressure & Cholesterol - Frequently checking blood cholesterol (%)
Blood Pressure & Cholesterol - Has high cholesterol level (%)
Consumer Behavior - Money monthly spent on food at supermarket/grocery store
Consumer Behavior - Money monthly spent on food at other stores
Consumer Behavior - Money monthly spent on eating out
Consumer Behavior - Money monthly spent on carryout/delivered foods
Consumer Behavior - Income spent on food at supermarket/grocery store (%)
Consumer Behavior - Income spent on food at other stores (%)
Consumer Behavior - Income spent on eating out (%)
Consumer Behavior - Income spent on carryout/delivered foods (%)
Current Health Status - General health condition (%)
Current Health Status - Blood donors (%)
Current Health Status - Has blood ever tested for HIV virus (%)
Current Health Status - Left-handed people (%)
Dermatology - People using sunscreen (%)
Diabetes - Diabetics (%)
Diabetes - Had a blood test for high blood sugar (%)
Diabetes - People taking insulin (%)
Diet Behavior & Nutrition - Diet health (%)
Diet Behavior & Nutrition - Milk product consumption (# of products/month)
Diet Behavior & Nutrition - Meals not home prepared (#/week)
Diet Behavior & Nutrition - Meals from fast food or pizza place (#/week)
Diet Behavior & Nutrition - Ready-to-eat foods (#/month)
Diet Behavior & Nutrition - Frozen meals/pizza (#/month)
Drug Use - People that ever used marijuana or hashish (%)
Drug Use - Ever used hard drugs (%)
Drug Use - Ever used any form of cocaine (%)
Drug Use - Ever used heroin (%)
Drug Use - Ever used methamphetamine (%)
Health Insurance - People covered by health insurance (%)
Kidney Conditions-Urology - Avg. # of times urinating at night
Medical Conditions - People with asthma (%)
Medical Conditions - People with anemia (%)
Medical Conditions - People with psoriasis (%)
Medical Conditions - People with overweight (%)
Medical Conditions - Elderly people having difficulties in thinking or remembering (%)
Medical Conditions - People who ever received blood transfusion (%)
Medical Conditions - People having trouble seeing even with glass/contacts (%)
Medical Conditions - People with arthritis (%)
Medical Conditions - People with gout (%)
Medical Conditions - People with congestive heart failure (%)
Medical Conditions - People with coronary heart disease (%)
Medical Conditions - People with angina pectoris (%)
Medical Conditions - People who ever had heart attack (%)
Medical Conditions - People who ever had stroke (%)
Medical Conditions - People with emphysema (%)
Medical Conditions - People with thyroid problem (%)
Medical Conditions - People with chronic bronchitis (%)
Medical Conditions - People with any liver condition (%)
Medical Conditions - People who ever had cancer or malignancy (%)
Mental Health - People who have little interest in doing things (%)
Mental Health - People feeling down, depressed, or hopeless (%)
Mental Health - People who have trouble sleeping or sleeping too much (%)
Mental Health - People feeling tired or having little energy (%)
Mental Health - People with poor appetite or overeating (%)
Mental Health - People feeling bad about themself (%)
Mental Health - People who have trouble concentrating on things (%)
Mental Health - People moving or speaking slowly or too fast (%)
Mental Health - People having thoughts they would be better off dead (%)
Oral Health - Average years since last visit a dentist
Oral Health - People embarrassed because of mouth (%)
Oral Health - People with gum disease (%)
Oral Health - General health of teeth and gums (%)
Oral Health - Average days a week using dental floss/device
Oral Health - Average days a week using mouthwash for dental problem
Oral Health - Average number of teeth
Pesticide Use - Households using pesticides to control insects (%)
Pesticide Use - Households using pesticides to kill weeds (%)
Physical Activity - People doing vigorous-intensity work activities (%)
Physical Activity - People doing moderate-intensity work activities (%)
Physical Activity - People walking or bicycling (%)
Physical Activity - People doing vigorous-intensity recreational activities (%)
Physical Activity - People doing moderate-intensity recreational activities (%)
Physical Activity - Average hours a day doing sedentary activities
Physical Activity - Average hours a day watching TV or videos
Physical Activity - Average hours a day using computer
Physical Functioning - People having limitations keeping them from working (%)
Physical Functioning - People limited in amount of work they can do (%)
Physical Functioning - People that need special equipment to walk (%)
Physical Functioning - People experiencing confusion/memory problems (%)
Physical Functioning - People requiring special healthcare equipment (%)
Prescription Medications - Average number of prescription medicines taking
Preventive Aspirin Use - Adults 40+ taking low-dose aspirin (%)
Reproductive Health - Vaginal deliveries (%)
Reproductive Health - Cesarean deliveries (%)
Reproductive Health - Deliveries resulted in a live birth (%)
Reproductive Health - Pregnancies resulted in a delivery (%)
Reproductive Health - Women breastfeeding newborns (%)
Reproductive Health - Women that had a hysterectomy (%)
Reproductive Health - Women that had both ovaries removed (%)
Reproductive Health - Women that have ever taken birth control pills (%)
Reproductive Health - Women taking birth control pills (%)
Reproductive Health - Women that have ever used Depo-Provera or injectables (%)
Reproductive Health - Women that have ever used female hormones (%)
Sexual Behavior - People 18+ that ever had sex (vaginal, anal, or oral) (%)
Sexual Behavior - Males 18+ that ever had vaginal sex with a woman (%)
Sexual Behavior - Males 18+ that ever performed oral sex on a woman (%)
Sexual Behavior - Males 18+ that ever had anal sex with a woman (%)
Sexual Behavior - Males 18+ that ever had any sex with a man (%)
Sexual Behavior - Females 18+ that ever had vaginal sex with a man (%)
Sexual Behavior - Females 18+ that ever performed oral sex on a man (%)
Sexual Behavior - Females 18+ that ever had anal sex with a man (%)
Sexual Behavior - Females 18+ that ever had any kind of sex with a woman (%)
Sexual Behavior - Average age people first had sex
Sexual Behavior - Average number of female sex partners in lifetime (males 18+)
Sexual Behavior - Average number of female vaginal sex partners in lifetime (males 18+)
Sexual Behavior - Average age people first performed oral sex on a woman (18+)
Sexual Behavior - Average number of woman performed oral sex on in lifetime (18+)
Sexual Behavior - Average number of male sex partners in lifetime (males 18+)
Sexual Behavior - Average number of male anal sex partners in lifetime (males 18+)
Sexual Behavior - Average age people first performed oral sex on a man (18+)
Sexual Behavior - Average number of male oral sex partners in lifetime (18+)
Sexual Behavior - People using protection when performing oral sex (%)
Sexual Behavior - Average number of times people have vaginal or anal sex a year
Sexual Behavior - People having sex without condom (%)
Sexual Behavior - Average number of male sex partners in lifetime (females 18+)
Sexual Behavior - Average number of male vaginal sex partners in lifetime (females 18+)
Sexual Behavior - Average number of female sex partners in lifetime (females 18+)
Sexual Behavior - Circumcised males 18+ (%)
Sleep Disorders - Average hours sleeping at night
Sleep Disorders - People that has trouble sleeping (%)
Smoking-Cigarette Use - People smoking cigarettes (%)
Taste & Smell - People 40+ having problems with smell (%)
Taste & Smell - People 40+ having problems with taste (%)
Taste & Smell - People 40+ that ever had wisdom teeth removed (%)
Taste & Smell - People 40+ that ever had tonsils teeth removed (%)
Taste & Smell - People 40+ that ever had a loss of consciousness because of a head injury (%)
Taste & Smell - People 40+ that ever had a broken nose or other serious injury to face or skull (%)
Taste & Smell - People 40+ that ever had two or more sinus infections (%)
Weight - Average height (inches)
Weight - Average weight (pounds)
Weight - Average BMI
Weight - People that are obese (%)
Weight - People that ever were obese (%)
Weight - People trying to lose weight (%)
100%
urban population.
Estimated median house/condo value in 2022: $537,920
45208:
$537,920Ohio:
$204,100
According to our research of Ohio and other state lists, there were 4 registered sex offenders living in 45208 zip code as of April 27, 2024 . The ratio of all residents to sex offenders in zip code 45208 is 4,696 to 1.The ratio of registered sex offenders to all residents in this zip code is much lower than the state average.
Median resident age: This zip code:
37.1 yearsOhio median age:
39.9 years
Average household size: This zip code:
2.1 peopleOhio:
2.4 people
Averages for the 2020 tax year for zip code 45208, filed in 2021:
Average Adjusted Gross Income (AGI) in 2020: $233,782 (Individual Income Tax Returns) Here:
$233,782State:
$67,288
Salary/wage: $161,435 (reported on 79.8% of returns )Here:
$161,435State:
$55,628
(% of AGI for various income ranges: 1317.5% for AGIs below $25k , 3962.2% for AGIs $25k-50k , 6751.7% for AGIs $50k-75k , 10460.0% for AGIs $75k-100k , 20995.8% for AGIs $100k-200k , 146505.4% for AGIs over 200k ) Taxable interest for individuals: $6,271 (reported on 50.5% of returns )This zip code:
$6,271Ohio:
$1,518
(% of AGI for various income ranges: 26.2% for AGIs below $25k , 30.2% for AGIs $25k-50k , 55.7% for AGIs $50k-75k , 114.9% for AGIs $75k-100k , 232.3% for AGIs $100k-200k , 4420.5% for AGIs over 200k ) Ordinary dividends: $36,895 (reported on 54.6% of returns )(% of AGI for various income ranges: 178.7% for AGIs below $25k , 223.8% for AGIs $25k-50k , 341.9% for AGIs $50k-75k , 920.4% for AGIs $75k-100k , 1830.0% for AGIs $100k-200k , 27418.7% for AGIs over 200k ) Net capital gain/loss in AGI: +$62,329 (reported on 48.6% of returns )Here:
+$62,329State:
+$18,919
(% of AGI for various income ranges: 62.6% for AGIs below $25k , 112.3% for AGIs $25k-50k , 267.6% for AGIs $50k-75k , 857.0% for AGIs $75k-100k , 1683.2% for AGIs $100k-200k , 44197.0% for AGIs over 200k ) Profit/loss from business: +$34,860 (reported on 18.2% of returns )Here:
+$34,860State:
+$13,744
(% of AGI for various income ranges: 139.2% for AGIs below $25k , 185.8% for AGIs $25k-50k , 241.7% for AGIs $50k-75k , 516.6% for AGIs $75k-100k , 1490.2% for AGIs $100k-200k , 6567.5% for AGIs over 200k ) Taxable individual retirement arrangement distribution: $46,093 (reported on 13.0% of returns )45208:
$46,093Ohio:
$18,876
(% of AGI for various income ranges: 79.3% for AGIs below $25k , 143.0% for AGIs $25k-50k , 285.2% for AGIs $50k-75k , 670.9% for AGIs $75k-100k , 1370.0% for AGIs $100k-200k , 6194.4% for AGIs over 200k ) Self-employed (Keogh) retirement plans: $31,284 (reported on 3.2% of returns )45208:
$31,284Ohio:
$24,898
(% of AGI for various income ranges: 17.9% for AGIs below $25k , 143.9% for AGIs $100k-200k , 1349.0% for AGIs over 200k ) Total itemized deductions: $51,156 (reported on 24.1% of returns )Here:
$51,156State:
$33,869
(% of AGI for various income ranges: 184.7% for AGIs below $25k , 196.1% for AGIs $25k-50k , 359.8% for AGIs $50k-75k , 811.1% for AGIs $75k-100k , 1994.0% for AGIs $100k-200k , 14816.9% for AGIs over 200k ) Charity contributions: $26,841 (reported on 21.1% of returns )Here:
$26,841State:
$14,577
(% of AGI for various income ranges: 9.1% for AGIs below $25k , 19.0% for AGIs $25k-50k , 45.6% for AGIs $50k-75k , 147.7% for AGIs $75k-100k , 440.7% for AGIs $100k-200k , 8098.5% for AGIs over 200k ) Taxes paid: $9,115 (reported on 24.0% of returns )(% of AGI for various income ranges: 36.2% for AGIs below $25k , 44.5% for AGIs $25k-50k , 90.9% for AGIs $50k-75k , 277.0% for AGIs $75k-100k , 606.4% for AGIs $100k-200k , 2091.8% for AGIs over 200k ) Earned income credit: $1,076 (reported on 3.5% of returns )(% of AGI for various income ranges: 25.8% for AGIs below $25k , 11.0% for AGIs $25k-50k ) Percentage of individuals using paid preparers for their 2020 taxes: 92.9%(% for various income ranges: 90.4% for AGIs below $25k , 93.0% for AGIs $25k-50k , 93.2% for AGIs $50k-75k , 92.9% for AGIs $75k-100k , 93.3% for AGIs $100k-200k , 94.1% for AGIs over 200k )
Averages for the 2012 tax year for zip code 45208, filed in 2013:
Average Adjusted Gross Income (AGI) in 2012: $154,859 (Individual Income Tax Returns) Here:
$154,859State:
$54,926
Salary/wage: $105,916 (reported on 80.7% of returns )Here:
$105,916State:
$45,869
(% of AGI for various income ranges: 72.1% for AGIs below $25k , 82.5% for AGIs $25k-50k , 73.2% for AGIs $50k-75k , 70.9% for AGIs $75k-100k , 71.7% for AGIs $100k-200k , 45.7% for AGIs over 200k ) Taxable interest for individuals: $4,405 (reported on 51.3% of returns )This zip code:
$4,405Ohio:
$1,297
(% of AGI for various income ranges: 1.7% for AGIs below $25k , 0.6% for AGIs $25k-50k , 0.9% for AGIs $50k-75k , 0.7% for AGIs $75k-100k , 1.0% for AGIs $100k-200k , 1.8% for AGIs over 200k ) Ordinary dividends: $24,310 (reported on 51.7% of returns )(% of AGI for various income ranges: 9.2% for AGIs below $25k , 3.6% for AGIs $25k-50k , 5.2% for AGIs $50k-75k , 5.8% for AGIs $75k-100k , 5.7% for AGIs $100k-200k , 9.5% for AGIs over 200k ) Net capital gain/loss in AGI: +$46,267 (reported on 41.3% of returns )Here:
+$46,267State:
+$11,232
(% of AGI for various income ranges: 1.9% for AGIs below $25k , 1.5% for AGIs $25k-50k , 2.3% for AGIs $50k-75k , 2.6% for AGIs $75k-100k , 3.5% for AGIs $100k-200k , 17.3% for AGIs over 200k ) Profit/loss from business: +$29,064 (reported on 17.1% of returns )Here:
+$29,064State:
+$12,773
(% of AGI for various income ranges: 6.8% for AGIs below $25k , 3.6% for AGIs $25k-50k , 4.4% for AGIs $50k-75k , 3.4% for AGIs $75k-100k , 4.7% for AGIs $100k-200k , 2.6% for AGIs over 200k ) Taxable individual retirement arrangement distribution: $38,523 (reported on 14.6% of returns )45208:
$38,523Ohio:
$14,511
(% of AGI for various income ranges: 4.0% for AGIs below $25k , 1.9% for AGIs $25k-50k , 3.2% for AGIs $50k-75k , 4.1% for AGIs $75k-100k , 4.2% for AGIs $100k-200k , 3.6% for AGIs over 200k ) Self-employment retirement plans: $24,290 (reported on 3.0% of returns )45208:
$24,290Ohio:
$20,257
(% of AGI for various income ranges: 0.4% for AGIs $50k-75k , 0.5% for AGIs $100k-200k , 0.6% for AGIs over 200k ) Total itemized deductions: $43,052 (17% of AGI, reported on 53.5% of returns )Here:
$43,052State:
$21,278
Here:
16.7% of AGIState:
18.8% of AGI
(% of AGI for various income ranges: 16.8% for AGIs below $25k , 9.1% for AGIs $25k-50k , 13.9% for AGIs $50k-75k , 18.5% for AGIs $75k-100k , 17.9% for AGIs $100k-200k , 14.3% for AGIs over 200k ) Charity contributions: $9,231 (reported on 45.6% of returns )(% of AGI for various income ranges: 0.9% for AGIs below $25k , 0.7% for AGIs $25k-50k , 1.7% for AGIs $50k-75k , 2.1% for AGIs $75k-100k , 2.3% for AGIs $100k-200k , 3.2% for AGIs over 200k ) Taxes paid: $22,195 (reported on 53.0% of returns )45208:
$22,195State:
$9,568
(% of AGI for various income ranges: 4.1% for AGIs below $25k , 2.9% for AGIs $25k-50k , 5.3% for AGIs $50k-75k , 7.6% for AGIs $75k-100k , 8.9% for AGIs $100k-200k , 7.9% for AGIs over 200k ) Earned income credit: $1,154 (reported on 3.7% of returns )(% of AGI for various income ranges: 1.4% for AGIs below $25k , 0.1% for AGIs $25k-50k ) Percentage of individuals using paid preparers for their 2012 taxes: 55.2%(% for various income ranges: 50.5% for AGIs below $25k , 38.4% for AGIs $25k-50k , 51.1% for AGIs $50k-75k , 57.6% for AGIs $75k-100k , 59.7% for AGIs $100k-200k , 78.6% for AGIs over 200k )
Averages for the 2004 tax year for zip code 45208, filed in 2005:
Average Adjusted Gross Income (AGI) in 2004: $118,853 (Individual Income Tax Returns) Here:
$118,853State:
$44,480
Salary/wage: $83,137 (reported on 78.5% of returns )Here:
$83,137State:
$39,198
(% of AGI for various income ranges: 68.9% for AGIs $10k-25k , 80.1% for AGIs $25k-50k , 74.1% for AGIs $50k-75k , 74.2% for AGIs $75k-100k , 47.6% for AGIs over 100k ) Taxable interest for individuals: $4,665 (reported on 61.8% of returns )This zip code:
$4,665Ohio:
$1,532
(% of AGI for various income ranges: 3.2% for AGIs $10k-25k , 1.7% for AGIs $25k-50k , 1.9% for AGIs $50k-75k , 1.4% for AGIs $75k-100k , 2.5% for AGIs over 100k ) Taxable dividends: $18,280 (reported on 57.4% of returns )(% of AGI for various income ranges: 7.2% for AGIs $10k-25k , 4.2% for AGIs $25k-50k , 5.0% for AGIs $50k-75k , 5.7% for AGIs $75k-100k , 9.6% for AGIs over 100k ) Net capital gain/loss: +$39,547 (reported on 47.4% of returns )Here:
+$39,547State:
+$8,582
(% of AGI for various income ranges: 2.8% for AGIs $10k-25k , 1.6% for AGIs $25k-50k , 2.6% for AGIs $50k-75k , 3.1% for AGIs $75k-100k , 19.4% for AGIs over 100k ) Profit/loss from business: +$26,101 (reported on 16.5% of returns )Here:
+$26,101State:
+$10,813
(% of AGI for various income ranges: 6.8% for AGIs $10k-25k , 3.9% for AGIs $25k-50k , 4.2% for AGIs $50k-75k , 4.5% for AGIs $75k-100k , 3.3% for AGIs over 100k ) IRA payment deduction: $3,186 (reported on 2.4% of returns )(% of AGI for various income ranges: 0.3% for AGIs $10k-25k , 0.2% for AGIs $25k-50k , 0.1% for AGIs $50k-75k , 0.1% for AGIs $75k-100k , 0.0% for AGIs over 100k ) Self-employed pension: $20,125 (reported on 3.5% of returns )(% of AGI for various income ranges: 0.3% for AGIs $10k-25k , 0.2% for AGIs $25k-50k , 0.3% for AGIs $50k-75k , 0.5% for AGIs $75k-100k , 0.7% for AGIs over 100k ) Total itemized deductions: $37,951 (19% of AGI, reported on 53.5% of returns )Here:
$37,951State:
$17,503
Here:
18.8% of AGIState:
20.8% of AGI
(% of AGI for various income ranges: 17.7% for AGIs $10k-25k , 13.7% for AGIs $25k-50k , 17.7% for AGIs $50k-75k , 21.2% for AGIs $75k-100k , 16.6% for AGIs over 100k ) Charity contributions deductions: $9,094 (4% of AGI, reported on 48.4% of returns )Here:
4.3% of AGIState:
3.4% of AGI
(% of AGI for various income ranges: 1.6% for AGIs $10k-25k , 1.5% for AGIs $25k-50k , 2.2% for AGIs $50k-75k , 2.7% for AGIs $75k-100k , 4.1% for AGIs over 100k ) Total tax: $25,218 (reported on 86.7% of returns )45208:
$25,218State:
$6,781
(% of AGI for various income ranges: 5.6% for AGIs $10k-25k , 9.3% for AGIs $25k-50k , 12.0% for AGIs $50k-75k , 12.4% for AGIs $75k-100k , 20.3% for AGIs over 100k ) Earned income credit: $981 (reported on 3.2% of returns )Percentage of individuals using paid preparers for their 2004 taxes: 54.7%(% for various income ranges: 55.3% for AGIs below $10k , 43.9% for AGIs $10k-25k , 44.2% for AGIs $25k-50k , 53.7% for AGIs $50k-75k , 57.0% for AGIs $75k-100k , 68.5% for AGIs over 100k )
Estimated median household income in 2022: This zip code:
$128,840Ohio:
$65,720
Nearest zip codes: 45209 ,
45226 ,
45212 ,
41074 ,
45207 ,
45213 .
Cincinnati Zip Code Map
Percentage of family households: This zip code:
38.2%Ohio:
43.3%
Percentage of households with unmarried partners: This zip code:
6.1%Ohio:
44.6%
Likely homosexual households (counted as self-reported same-sex unmarried-partner households)
Lesbian couples: 0.3% of all households Gay men: 0.4% of all households
Household received Food Stamps/SNAP in the past 12 months: 109Household did not receive Food Stamps/SNAP in the past 12 months: 8,380
Women who had a birth in the past 12 months: 205 (210 now married , 0 unmarried) Women who did not have a birth in the past 12 months: 4,288 (1,938 now married , 2,349 unmarried)
Housing units in zip code 45208 with a mortgage: 3,910 (469
second mortgage , 388
both second mortgage and home equity loan )
Houses without a mortgage: 116
Median monthly owner costs for units with a mortgage: $2,646
Median monthly owner costs for units without a mortgage: $1,271
Residents with income below the poverty level in 2022:
This zip code:
4.7%Whole state:
13.4%
Residents with income below 50% of the poverty level in 2022:
This zip code:
1.5%Whole state:
7.0%
Median number of rooms in houses and condos: Median number of rooms in apartments: Notable locations in this zip code not listed on our city pages
Click to draw/clear zip code borders Notable locations in zip code 45208: (A) , Cincinnati Country Club (B) , Cincinnati Fire Department Engine and Truck 46 (C) , Number 46 Engine Company (D) . Display/hide their locations on the map
Churches in zip code 45208 include: (A) , First Church of Christ Scientist (B) , Church of the Redeemer (C) , Saint Marys Roman Catholic Church (D) , Knox Presbyterian Church (E) , Bible Deliverance Church (F) , Hyde Park United Methodist Church (G) , Hyde Park Baptist Church (H) , Mount Lookout Church of the Nazarene (I) . Display/hide their locations on the map
Parks in zip code 45208 include: (1) , Wulsin Triangle (2) , Owls Nest Park (3) , Observatory Historic District (4) , Madison Park (5) , Hyde Park Square (6) . Display/hide their locations on the map
Year house built (houses)
9 2020 or later227 2010 to 2019119 2000 to 2009272 1990 to 1999307 1980 to 1989764 1970 to 19791,038 1960 to 1969732 1950 to 1959636 1940 to 19494,740 1939 or earlier
Zip code 45208 household income distribution in 2022 341 Less than $10,00092 $10,000 to $14,999163 $15,000 to $19,999174 $20,000 to $24,999166 $25,000 to $29,999147 $30,000 to $34,99966 $35,000 to $39,999220 $40,000 to $44,999179 $45,000 to $49,999303 $50,000 to $59,999616 $60,000 to $74,999973 $75,000 to $99,999596 $100,000 to $124,999682 $125,000 to $149,9991,150 $150,000 to $199,9992,635 $200,000 or moreEstimate of home value of owner-occupied houses/condos in 2022 in zip code 45208 23 Less than $10,0005 $10,000 to $14,9995 $50,000 to $59,9992 $70,000 to $79,9995 $80,000 to $89,99931 $90,000 to $99,999101 $100,000 to $124,99913 $125,000 to $149,999206 $150,000 to $174,99944 $175,000 to $199,999271 $200,000 to $249,999429 $250,000 to $299,999935 $300,000 to $399,9991,193 $400,000 to $499,9991,760 $500,000 to $749,999780 $750,000 to $999,999474 $1,000,000 to $1,499,99977 $1,500,000 to $1,999,999127 $2,000,000 or moreRent paid by renters in 2022 in zip code 45208 9 Less than $10010 $250 to $29928 $500 to $54954 $550 to $59918 $650 to $699123 $700 to $749111 $750 to $799251 $800 to $899302 $900 to $999753 $1,000 to $1,249816 $1,250 to $1,499221 $1,500 to $1,999103 $2,000 to $2,49981 $2,500 to $2,99939 $3,000 to $3,499137 $3,500 or more102 No cash rent
Median gross rent in 2022: $1,280.
Median price asked for vacant for-sale houses and condos in 2022: $423,842.
Estimated median house (or condo) value in 2022 for: White Non-Hispanic householders: $596,223Black or African American householders: $235,059Asian householders: $593,584Some other race householders: $507,844Two or more races householders: $250,624Hispanic or Latino householders: $826,534Estimated median house or condo value in 2022: $537,920
45208:
$537,920Ohio:
$204,100
Lower value quartile - upper value quartile: $353,973 - $815,683
Mean price in 2022: Detached houses: $712,456Here:
$712,456State:
$254,366
Townhouses or other attached units: $349,811Here:
$349,811State:
$225,733
In 2-unit structures: $226,867Here:
$226,867State:
$144,384
In 3-to-4-unit structures: $281,518Here:
$281,518State:
$203,002
In 5-or-more-unit structures: $402,941Here:
$402,941State:
$211,593
Housing units in structures:
One, detached: 4,797One, attached: 264Two: 6443 or 4: 6225 to 9: 79510 to 19: 53220 to 49: 49950 or more: 780Mobile homes: 21Unemployment : 1.1%
Means of transportation to work in zip code 45208 72.3% 7,682 Drove a car alone5.4% 570 Carpooled0.2% 23 Bus or trolley bus0.1% 6 Bicycle1.1% 116 Walked0.4% 43 Other means23.2% 2,467 Worked at homeTravel time to work (commute) in zip code 45208 86 Less than 5 minutes653 5 to 9 minutes1,249 10 to 14 minutes2,205 15 to 19 minutes1,766 20 to 24 minutes624 25 to 29 minutes999 30 to 34 minutes228 35 to 39 minutes70 40 to 44 minutes340 45 to 59 minutes99 60 to 89 minutes134 90 or more minutes
Neighborhoods in zip code 45208: Percentage of zip code residents living and working in this county: 80.8%
Household type by relationship:
Households: 17,882
Male householders: 4,159 (1,489 living alone ), Female householders: 4,361 (1,756 living alone )3,668 spouses (3,648 opposite-sex spouses ), 595 unmarried partners , (595 opposite-sex unmarried partners ), 3,966 children (3,771 natural , 137 adopted , 65 stepchildren ), 118 grandchildren , 104 brothers or sisters , 23 parents , 0 foster children , 14 other relatives , 725 non-relatives In group quarters: 208 (-1 institutionalized population )
Size of family households: 2,248 2-persons , 780 3-persons , 885 4-persons , 428 5-persons , 4 6-persons , 3 7-or-more-persons
Size of nonfamily households: 3,244 1-person , 842 2-persons , 82 3-persons , 23 4-persons
3,010 married couples with children. single-parent households (151 men , 299 women ).
95.0% of residents of 45208 zip code speak English at home. of residents speak Spanish at home (90% very well, 10% well ).of residents speak other Indo-European language at home (90% very well, 7% well, 3% not well ).of residents speak Asian or Pacific Island language at home (96% very well, 4% well ).of residents speak other language at home (74% very well, 26% not well ).
Foreign born population: 897 (5.0%)
(78.1%
of them are naturalized citizens )
This zip code:
5.0%Whole state:
5.0%
13% Honduras 12% Japan 5% Norway 5% Poland 5% Austria 4% Thailand 4% Sweden 22% German 11% Irish 11% English 8% American 7% European 2% Italian 2% Greek
Year of entry for the foreign-born population
155 2010 or later 316 2000 to 2009 192 1990 to 1999 349 Before 1990
There are
105 Medical Specialists in Zip Code 45208 .
Facilities with environmental interests located in this zip code:
BP OIL NO 08962 (3980 ERIE AVE in CINCINNATI, OH)
STATE MASTER (Ohio general info) - AIR MAJOR, -31-5541-1038-C, EPCRA, RCRA-OHD987028164, HAZARDOUS WASTE PROGRAM Conditionally Exempt Small Quantity Generators, less than 100 kg/month of hazardous waste (Resource Conservation and Recovery Act (tracking hazardous waste)) - notification Organizations: BP OIL CO (CONTACT/OWNER)
, BP OIL COMPANY (CONTACT/OWNER)
Alternative names: BP OIL CO SITE 08962
BP OIL NO 09281 (2696 MADISON RD in CINCINNATI, OH)
STATE MASTER (Ohio general info) - AIR MAJOR, -315541-1038-OO, EPCRA, RCRA-OHD987029048, HAZARDOUS WASTE PROGRAM Conditionally Exempt Small Quantity Generators, less than 100 kg/month of hazardous waste (Resource Conservation and Recovery Act (tracking hazardous waste)) - notification Organizations: BP OIL CO (CONTACT/OWNER)
, BP OIL COMPANY (CONTACT/OWNER)
Alternative names: BP OIL CO SITE 09281
APPEARANCE PLUS CLEANERS INC (3505 ERIE AVE in CINCINNATI, OH)
Small Quantity Generators, between 100 kg and 1000 kg of hazardous waste/month (Resource Conservation and Recovery Act (tracking hazardous waste)) - notification
ORTNER FREIGHT CAR (2652 ERIE AVENUE in CINCINNATI OH, KY)
AIR MINOR (AIRS/AFS) Business SIC classification: TRANSPORTATION SERVICES
Housing units lacking complete plumbing facilities: 0.6%
Housing units lacking complete kitchen facilities: 1.1%
69.1% Utility gas 26.2% Electricity 1.8% Bottled, tank, or LP gas 1.2% Other fuel 0.9% No fuel used
Population in 1990: 19,557.
Place of birth for U.S.-born residents:
This state: 10,641Northeast: 1,309Midwest: 2,002South: 2,161West: 691
51% of the 45208 zip code residents lived in the same house 5 years ago.
Out of people who lived in different houses, 53% lived in this county.
Out of people who lived in different counties, 50% lived in Ohio.
88% of the 45208 zip code residents lived in the same house 1 year ago.
Out of people who lived in different houses, 64% moved from this county.
Out of people who lived in different houses, 6% moved from different county within same state.
Out of people who lived in different houses, 26% moved from different state.
Out of people who lived in different houses, 1% moved from abroad.
Private vs. public school enrollment:
Students in private schools in grades 1 to 8 (elementary and middle school): 562
Students in private schools in grades 9 to 12 (high school): 345
Students in private undergraduate colleges: 154
Occupation by median earnings in the past 12 months ($)
156,384 Legal occupations 135,388 Management occupations 99,927 Law enforcement workers including supervisors 97,348 Business and financial operations occupations 97,058 Architecture and engineering occupations 82,675 Sales and related occupations
Companies with federal contracts located in this zip code:
TITAN STRATEGIC SERVICES,INC (3380 ERIE AVENUE SUITE 175 in CINCINNATI, VA; small business)
$63,515 with Navy for Antennas, Waveguides, and Related Equipment. Taking place in VA. Signed on 2001-09-27. Completion date: 2001-10-04.
ENCOMIUM PUBLICATIONS (2637 ERIE AVE, STE 203 in CINCINNATI, OH; small business)
$36,897 with Army for ADP Software. Signed on 2006-03-08. Completion date: 2006-03-10.
AMERICAN R C S GROUP INC (3067 GRIEST AVE in CINCINNATI, OH; small business) in 4 contracts from 2003 to 2004
$9,075 with Army for Miscellaneous Items. Signed on 2003-02-11. Completion date: 2003-03-14.
, same as above. Signed on 2003-01-21. Completion date: 2003-01-31.
, same as above. Signed on 2003-02-11. Completion date: 2003-01-31.
, same as above. Signed on 2004-02-27. Completion date: 2004-04-06.
Top industries in this zip code by the number of employees in 2005:
Accommodation and Food Services: Full-Service Restaurants (50-99 employees: 3 establishments, 20-49 employees: 11 establishments, 10-19 employees: 7 establishments, 5-9 employees: 3 establishments, 1-4 employees: 6 establishments)Other Services (except Public Administration): Drycleaning and Laundry Services (except Coin-Operated) (250-499: 1, 5-9: 3)Accommodation and Food Services: Limited-Service Restaurants (50-99: 1, 20-49: 4, 10-19: 1, 5-9: 2, 1-4: 7)Educational Services: Elementary and Secondary Schools (100-249: 1, 50-99: 1)Arts, Entertainment, and Recreation: Golf Courses and Country Clubs (100-249: 1, 50-99: 1)Other Services (except Public Administration): Beauty Salons (50-99: 1, 20-49: 3, 10-19: 1, 5-9: 4, 1-4: 9)Other Services (except Public Administration): Religious Organizations (50-99: 2, 20-49: 2, 5-9: 2, 1-4: 1)Administrative and Support and Waste Management and Remediation Services: Temporary Help Services (100-249: 1, 20-49: 1, 1-4: 2)Health Care and Social Assistance: Offices of Dentists (20-49: 1, 10-19: 7, 5-9: 7, 1-4: 6)
People in group quarters in 2010:
155 people in nursing facilities/skilled-nursing facilities
14 people in group homes intended for adults
People in group quarters in 2000:
287 people in nursing homes
11 people in homes for the mentally retarded
Fatal accident statistics in 2012:
Fatal accident count: 1Vehicles involved in fatal accidents: 1Fatal accidents caused by drunken drivers: 0Fatalities: 1Persons involved in fatal accidents: 1Pedestrians involved in fatal accidents: 0
Home Mortgage Disclosure Act Aggregated Statistics For Year 2009(Based on 4 full and 10 partial tracts) A) FHA, FSA/RHS & VA B) Conventional C) Refinancings D) Home Improvement Loans E) Loans on Dwellings For 5+ Families F) Non-occupant Loans on Number Average Value Number Average Value Number Average Value Number Average Value Number Average Value Number Average Value
LOANS ORIGINATED 123 $217,487 403 $259,719 1,634 $246,857 45 $216,570 4 $968,692 69 $206,420 APPLICATIONS APPROVED, NOT ACCEPTED 7 $184,401 27 $293,217 114 $234,732 4 $23,298 0 $0 8 $151,730 APPLICATIONS DENIED 8 $168,685 34 $247,225 332 $238,706 27 $79,891 0 $0 20 $199,557 APPLICATIONS WITHDRAWN 16 $207,506 43 $272,854 153 $215,124 3 $188,267 0 $0 8 $165,722 FILES CLOSED FOR INCOMPLETENESS 0 $0 14 $375,653 38 $231,557 0 $0 0 $0 1 $370,620
Aggregated Statistics For Year 2008(Based on 4 full and 10 partial tracts) A) FHA, FSA/RHS & VA B) Conventional C) Refinancings D) Home Improvement Loans E) Loans on Dwellings For 5+ Families F) Non-occupant Loans on G) Loans On Manufactured Number Average Value Number Average Value Number Average Value Number Average Value Number Average Value Number Average Value Number Average Value
LOANS ORIGINATED 78 $204,873 541 $258,083 724 $259,433 62 $114,794 16 $449,973 98 $184,613 0 $0 APPLICATIONS APPROVED, NOT ACCEPTED 5 $207,070 61 $268,337 68 $219,060 9 $43,859 0 $0 9 $237,537 0 $0 APPLICATIONS DENIED 10 $159,272 35 $216,842 143 $208,815 33 $51,456 3 $1,281,770 34 $181,869 1 $52,140 APPLICATIONS WITHDRAWN 12 $220,743 38 $283,829 106 $219,887 5 $204,680 0 $0 4 $152,895 0 $0 FILES CLOSED FOR INCOMPLETENESS 4 $154,495 10 $156,467 15 $109,427 6 $30,598 0 $0 7 $96,716 0 $0
Aggregated Statistics For Year 2007(Based on 4 full and 10 partial tracts) A) FHA, FSA/RHS & VA B) Conventional C) Refinancings D) Home Improvement Loans E) Loans on Dwellings For 5+ Families F) Non-occupant Loans on Number Average Value Number Average Value Number Average Value Number Average Value Number Average Value Number Average Value
LOANS ORIGINATED 7 $172,820 756 $238,418 510 $242,891 111 $61,457 8 $2,929,302 148 $201,876 APPLICATIONS APPROVED, NOT ACCEPTED 0 $0 59 $208,498 114 $189,720 20 $131,017 0 $0 18 $144,476 APPLICATIONS DENIED 4 $225,772 39 $188,499 209 $185,013 31 $41,267 1 $1,183,400 40 $175,792 APPLICATIONS WITHDRAWN 1 $128,430 59 $233,660 76 $206,893 6 $281,812 0 $0 28 $147,584 FILES CLOSED FOR INCOMPLETENESS 0 $0 11 $303,325 27 $235,021 5 $40,152 0 $0 7 $163,111
Aggregated Statistics For Year 2006(Based on 4 full and 10 partial tracts) A) FHA, FSA/RHS & VA B) Conventional C) Refinancings D) Home Improvement Loans E) Loans on Dwellings For 5+ Families F) Non-occupant Loans on G) Loans On Manufactured Number Average Value Number Average Value Number Average Value Number Average Value Number Average Value Number Average Value Number Average Value
LOANS ORIGINATED 11 $163,136 995 $229,011 547 $221,395 104 $77,592 21 $495,881 171 $173,802 1 $51,060 APPLICATIONS APPROVED, NOT ACCEPTED 2 $255,080 92 $237,733 114 $196,716 20 $41,690 0 $0 19 $120,677 0 $0 APPLICATIONS DENIED 1 $131,580 79 $165,034 242 $206,949 46 $98,036 1 $294,490 67 $183,214 0 $0 APPLICATIONS WITHDRAWN 2 $166,400 100 $211,541 110 $221,700 6 $326,383 4 $451,845 21 $131,991 0 $0 FILES CLOSED FOR INCOMPLETENESS 0 $0 17 $198,169 40 $182,793 1 $135,890 0 $0 7 $151,574 0 $0
Aggregated Statistics For Year 2005(Based on 4 full and 10 partial tracts) A) FHA, FSA/RHS & VA B) Conventional C) Refinancings D) Home Improvement Loans E) Loans on Dwellings For 5+ Families F) Non-occupant Loans on G) Loans On Manufactured Number Average Value Number Average Value Number Average Value Number Average Value Number Average Value Number Average Value Number Average Value
LOANS ORIGINATED 10 $162,208 919 $217,778 728 $224,420 87 $86,402 18 $739,333 238 $163,981 2 $140,495 APPLICATIONS APPROVED, NOT ACCEPTED 0 $0 91 $158,830 82 $162,823 18 $85,834 0 $0 29 $122,014 0 $0 APPLICATIONS DENIED 2 $170,405 101 $226,885 260 $183,680 56 $66,696 0 $0 54 $124,837 3 $42,917 APPLICATIONS WITHDRAWN 1 $101,100 116 $209,640 134 $223,343 16 $161,832 2 $308,885 43 $157,938 0 $0 FILES CLOSED FOR INCOMPLETENESS 0 $0 35 $189,462 44 $212,209 5 $400,128 0 $0 14 $168,636 0 $0
Aggregated Statistics For Year 2004(Based on 4 full and 10 partial tracts) A) FHA, FSA/RHS & VA B) Conventional C) Refinancings D) Home Improvement Loans E) Loans on Dwellings For 5+ Families F) Non-occupant Loans on G) Loans On Manufactured Number Average Value Number Average Value Number Average Value Number Average Value Number Average Value Number Average Value Number Average Value
LOANS ORIGINATED 8 $98,771 888 $222,748 952 $218,481 120 $98,914 19 $406,680 188 $165,191 0 $0 APPLICATIONS APPROVED, NOT ACCEPTED 0 $0 91 $244,359 123 $164,271 26 $59,344 0 $0 21 $104,249 0 $0 APPLICATIONS DENIED 3 $144,590 64 $145,184 234 $178,948 53 $69,798 1 $86,800 27 $110,379 1 $58,200 APPLICATIONS WITHDRAWN 8 $169,998 97 $179,961 122 $170,740 12 $126,685 1 $756,600 17 $163,844 0 $0 FILES CLOSED FOR INCOMPLETENESS 0 $0 25 $243,256 44 $169,430 6 $101,543 0 $0 5 $132,398 0 $0
Aggregated Statistics For Year 2003(Based on 4 full and 10 partial tracts) A) FHA, FSA/RHS & VA B) Conventional C) Refinancings D) Home Improvement Loans E) Loans on Dwellings For 5+ Families F) Non-occupant Loans on Number Average Value Number Average Value Number Average Value Number Average Value Number Average Value Number Average Value
LOANS ORIGINATED 17 $126,084 912 $234,258 3,198 $211,514 82 $73,799 25 $341,387 273 $159,832 APPLICATIONS APPROVED, NOT ACCEPTED 3 $130,973 73 $211,860 266 $202,530 31 $50,169 0 $0 19 $147,405 APPLICATIONS DENIED 0 $0 87 $178,231 353 $203,326 63 $28,631 0 $0 51 $117,829 APPLICATIONS WITHDRAWN 2 $147,215 68 $181,381 214 $186,733 6 $40,303 4 $559,945 18 $180,827 FILES CLOSED FOR INCOMPLETENESS 4 $89,185 29 $164,361 136 $185,978 8 $54,030 0 $0 20 $172,267
Aggregated Statistics For Year 2002(Based on 4 full and 10 partial tracts) A) FHA, FSA/RHS & VA B) Conventional C) Refinancings D) Home Improvement Loans E) Loans on Dwellings For 5+ Families F) Non-occupant Loans on Number Average Value Number Average Value Number Average Value Number Average Value Number Average Value Number Average Value
LOANS ORIGINATED 19 $121,415 894 $182,172 2,384 $214,775 88 $41,887 25 $439,714 247 $151,065 APPLICATIONS APPROVED, NOT ACCEPTED 0 $0 53 $229,312 233 $186,381 41 $52,962 0 $0 17 $113,166 APPLICATIONS DENIED 4 $77,058 54 $140,341 230 $171,890 60 $30,850 0 $0 20 $92,930 APPLICATIONS WITHDRAWN 2 $165,810 71 $262,528 207 $185,333 4 $17,658 0 $0 24 $161,779 FILES CLOSED FOR INCOMPLETENESS 1 $158,130 17 $112,503 81 $197,854 5 $29,198 0 $0 7 $206,561
Aggregated Statistics For Year 2001(Based on 4 full and 10 partial tracts) A) FHA, FSA/RHS & VA B) Conventional C) Refinancings D) Home Improvement Loans E) Loans on Dwellings For 5+ Families F) Non-occupant Loans on Number Average Value Number Average Value Number Average Value Number Average Value Number Average Value Number Average Value
LOANS ORIGINATED 39 $105,807 866 $191,332 1,753 $200,542 113 $41,462 20 $508,284 180 $158,232 APPLICATIONS APPROVED, NOT ACCEPTED 1 $120,670 69 $178,411 189 $146,030 31 $47,324 0 $0 18 $130,794 APPLICATIONS DENIED 1 $89,870 44 $146,995 234 $155,307 70 $23,061 0 $0 30 $136,126 APPLICATIONS WITHDRAWN 2 $88,565 73 $200,371 154 $172,686 10 $55,095 0 $0 13 $150,247 FILES CLOSED FOR INCOMPLETENESS 0 $0 22 $124,638 42 $151,214 5 $9,450 0 $0 3 $103,773
Aggregated Statistics For Year 2000(Based on 4 full and 10 partial tracts) A) FHA, FSA/RHS & VA B) Conventional C) Refinancings D) Home Improvement Loans E) Loans on Dwellings For 5+ Families F) Non-occupant Loans on Number Average Value Number Average Value Number Average Value Number Average Value Number Average Value Number Average Value
LOANS ORIGINATED 27 $113,222 878 $177,080 348 $159,837 120 $34,198 13 $382,730 112 $129,972 APPLICATIONS APPROVED, NOT ACCEPTED 0 $0 78 $168,564 71 $79,607 55 $16,541 1 $57,190 7 $111,650 APPLICATIONS DENIED 1 $52,820 76 $133,208 143 $108,342 66 $14,328 1 $347,210 23 $121,196 APPLICATIONS WITHDRAWN 2 $71,895 64 $195,796 80 $113,190 11 $26,979 0 $0 13 $140,702 FILES CLOSED FOR INCOMPLETENESS 2 $42,975 26 $220,115 29 $110,163 3 $229,513 0 $0 3 $101,530
Aggregated Statistics For Year 1999(Based on 2 full and 5 partial tracts) A) FHA, FSA/RHS & VA B) Conventional C) Refinancings D) Home Improvement Loans E) Loans on Dwellings For 5+ Families F) Non-occupant Loans on Number Average Value Number Average Value Number Average Value Number Average Value Number Average Value Number Average Value
LOANS ORIGINATED 18 $118,418 397 $175,089 446 $158,014 84 $25,455 5 $329,870 61 $119,929 APPLICATIONS APPROVED, NOT ACCEPTED 0 $0 29 $180,728 59 $111,665 20 $18,048 0 $0 9 $69,866 APPLICATIONS DENIED 1 $80,180 22 $133,338 93 $106,897 40 $16,930 1 $197,800 10 $103,171 APPLICATIONS WITHDRAWN 1 $125,120 27 $177,180 50 $129,810 4 $49,515 0 $0 9 $131,933 FILES CLOSED FOR INCOMPLETENESS 0 $0 7 $143,220 12 $133,022 1 $12,480 0 $0 0 $0
Private Mortgage Insurance Companies Aggregated Statistics For Year 2009(Based on 4 full and 8 partial tracts) A) Conventional B) Refinancings Number Average Value Number Average Value
LOANS ORIGINATED 55 $209,824 29 $244,236 APPLICATIONS APPROVED, NOT ACCEPTED 25 $226,937 7 $286,207 APPLICATIONS DENIED 3 $189,917 0 $0 APPLICATIONS WITHDRAWN 5 $257,050 0 $0 FILES CLOSED FOR INCOMPLETENESS 0 $0 0 $0
Aggregated Statistics For Year 2008(Based on 4 full and 10 partial tracts) A) Conventional B) Refinancings C) Non-occupant Loans on Number Average Value Number Average Value Number Average Value
LOANS ORIGINATED 147 $244,779 26 $221,171 14 $160,454 APPLICATIONS APPROVED, NOT ACCEPTED 23 $251,079 8 $227,510 1 $70,460 APPLICATIONS DENIED 9 $319,878 2 $229,325 3 $274,663 APPLICATIONS WITHDRAWN 11 $200,195 0 $0 3 $193,000 FILES CLOSED FOR INCOMPLETENESS 0 $0 0 $0 0 $0
Aggregated Statistics For Year 2007(Based on 4 full and 10 partial tracts) A) Conventional B) Refinancings C) Non-occupant Loans on Number Average Value Number Average Value Number Average Value
LOANS ORIGINATED 120 $208,701 14 $198,819 7 $142,111 APPLICATIONS APPROVED, NOT ACCEPTED 19 $238,466 8 $296,140 3 $189,040 APPLICATIONS DENIED 6 $404,757 2 $264,740 4 $379,722 APPLICATIONS WITHDRAWN 8 $315,559 5 $207,738 0 $0 FILES CLOSED FOR INCOMPLETENESS 0 $0 0 $0 0 $0
Aggregated Statistics For Year 2006(Based on 4 full and 10 partial tracts) A) Conventional B) Refinancings C) Non-occupant Loans on Number Average Value Number Average Value Number Average Value
LOANS ORIGINATED 77 $185,906 20 $207,317 10 $112,142 APPLICATIONS APPROVED, NOT ACCEPTED 14 $223,917 6 $151,097 0 $0 APPLICATIONS DENIED 2 $117,440 0 $0 0 $0 APPLICATIONS WITHDRAWN 2 $226,695 0 $0 0 $0 FILES CLOSED FOR INCOMPLETENESS 0 $0 0 $0 0 $0
Aggregated Statistics For Year 2005(Based on 4 full and 10 partial tracts) A) Conventional B) Refinancings C) Non-occupant Loans on Number Average Value Number Average Value Number Average Value
LOANS ORIGINATED 61 $197,898 28 $196,341 16 $146,445 APPLICATIONS APPROVED, NOT ACCEPTED 19 $204,768 4 $186,915 5 $105,124 APPLICATIONS DENIED 0 $0 2 $92,945 0 $0 APPLICATIONS WITHDRAWN 1 $225,900 3 $200,810 0 $0 FILES CLOSED FOR INCOMPLETENESS 3 $300,680 0 $0 0 $0
Aggregated Statistics For Year 2004(Based on 4 full and 10 partial tracts) A) Conventional B) Refinancings C) Non-occupant Loans on Number Average Value Number Average Value Number Average Value
LOANS ORIGINATED 109 $197,090 21 $186,722 23 $152,648 APPLICATIONS APPROVED, NOT ACCEPTED 30 $196,243 24 $203,448 4 $93,808 APPLICATIONS DENIED 0 $0 0 $0 0 $0 APPLICATIONS WITHDRAWN 8 $126,124 4 $154,468 2 $43,910 FILES CLOSED FOR INCOMPLETENESS 4 $234,460 2 $462,350 2 $174,895
Aggregated Statistics For Year 2003(Based on 4 full and 10 partial tracts) A) Conventional B) Refinancings C) Non-occupant Loans on Number Average Value Number Average Value Number Average Value
LOANS ORIGINATED 171 $199,291 75 $178,400 13 $112,945 APPLICATIONS APPROVED, NOT ACCEPTED 39 $158,474 45 $197,995 6 $184,007 APPLICATIONS DENIED 1 $110,930 2 $113,460 0 $0 APPLICATIONS WITHDRAWN 9 $120,786 9 $238,311 0 $0 FILES CLOSED FOR INCOMPLETENESS 1 $45,950 1 $79,650 1 $45,950
Aggregated Statistics For Year 2002(Based on 4 full and 10 partial tracts) A) Conventional B) Refinancings C) Non-occupant Loans on Number Average Value Number Average Value Number Average Value
LOANS ORIGINATED 196 $178,536 74 $177,615 17 $137,112 APPLICATIONS APPROVED, NOT ACCEPTED 27 $187,149 12 $193,402 4 $117,692 APPLICATIONS DENIED 2 $52,930 2 $222,595 1 $371,860 APPLICATIONS WITHDRAWN 4 $183,265 2 $197,565 2 $114,235 FILES CLOSED FOR INCOMPLETENESS 2 $58,970 0 $0 0 $0
Aggregated Statistics For Year 2001(Based on 4 full and 10 partial tracts) A) Conventional B) Refinancings C) Non-occupant Loans on Number Average Value Number Average Value Number Average Value
LOANS ORIGINATED 201 $177,097 73 $188,655 9 $134,606 APPLICATIONS APPROVED, NOT ACCEPTED 54 $175,158 24 $155,951 10 $148,647 APPLICATIONS DENIED 0 $0 7 $153,826 0 $0 APPLICATIONS WITHDRAWN 5 $163,390 10 $200,685 2 $113,665 FILES CLOSED FOR INCOMPLETENESS 1 $171,680 0 $0 0 $0
Aggregated Statistics For Year 2000(Based on 4 full and 10 partial tracts) A) Conventional B) Refinancings C) Non-occupant Loans on Number Average Value Number Average Value Number Average Value
LOANS ORIGINATED 216 $159,886 19 $145,855 11 $137,702 APPLICATIONS APPROVED, NOT ACCEPTED 19 $169,904 0 $0 3 $110,750 APPLICATIONS DENIED 6 $175,783 0 $0 0 $0 APPLICATIONS WITHDRAWN 4 $181,245 0 $0 3 $202,547 FILES CLOSED FOR INCOMPLETENESS 0 $0 0 $0 0 $0
Aggregated Statistics For Year 1999(Based on 2 full and 5 partial tracts) A) Conventional B) Refinancings C) Non-occupant Loans on Number Average Value Number Average Value Number Average Value
LOANS ORIGINATED 112 $163,402 23 $158,828 5 $114,860 APPLICATIONS APPROVED, NOT ACCEPTED 9 $133,654 6 $151,017 2 $76,225 APPLICATIONS DENIED 5 $184,552 1 $152,750 0 $0 APPLICATIONS WITHDRAWN 0 $0 1 $127,000 0 $0 FILES CLOSED FOR INCOMPLETENESS 0 $0 0 $0 0 $0
2002 - 2018 National Fire Incident Reporting System (NFIRS) incidents See full 2006 National Fire Incident Reporting System statistics for zip code 45208, Ohio
Most common first names in zip code 45208 among deceased individuals Name Count Lived (average)
Mary 273 81.9 years William 211 77.0 years John 191 77.4 years Robert 151 74.8 years Charles 138 77.4 years Margaret 129 83.3 years Helen 128 82.2 years James 120 73.3 years Dorothy 96 80.2 years Ruth 95 82.7 years
Most common last names in zip code 45208 among deceased individuals Last name Count Lived (average)
Smith 61 80.5 years Johnson 45 79.7 years Williams 36 77.2 years Miller 36 77.4 years Brown 35 76.7 years Jones 34 79.0 years Wilson 26 78.3 years Anderson 24 80.9 years Hall 18 80.0 years Davis 18 78.5 years
Businesses in zip code 45208
Name Count Name Count
Buffalo Wild Wings 1 Papa John's Pizza 1 CVS 1 Popeyes 1 FedEx 1 SAS Shoes 1 GNC 1 Shoe Carnival 1 New Balance 1 Starbucks 3 Nike 2 T.J.Maxx 1 Nordstrom 1 UPS 3

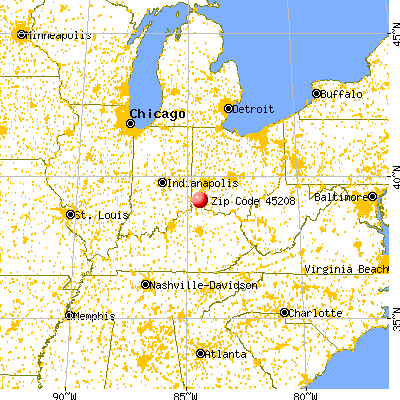


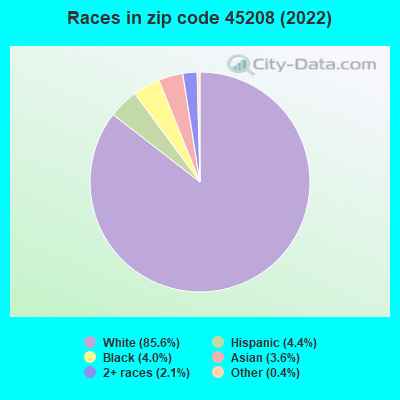


 Nearest zip codes: 45209, 45226, 45212, 41074, 45207, 45213.
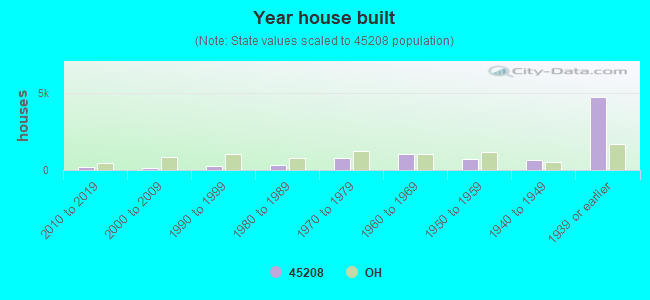

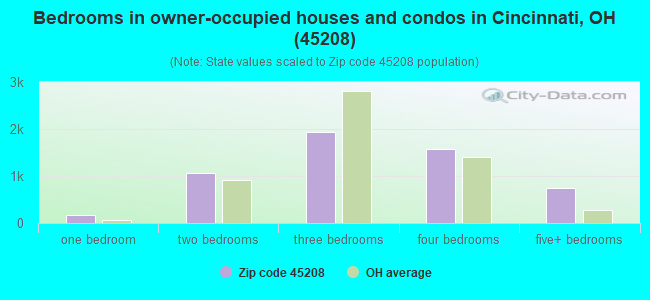
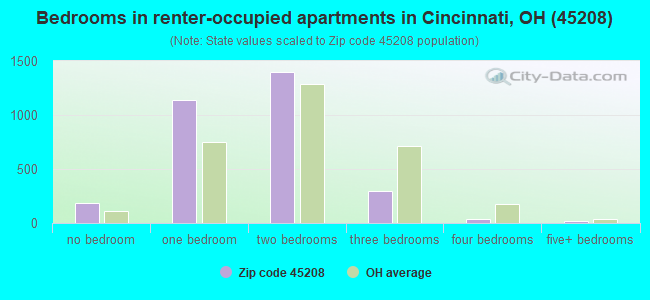
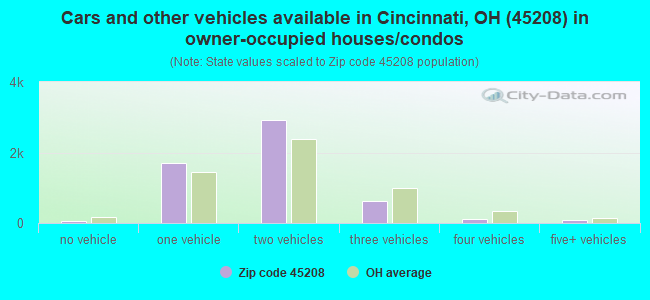
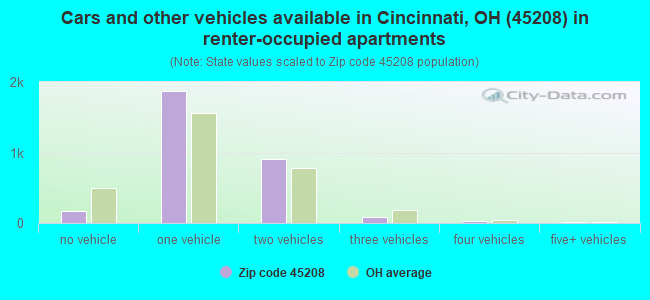


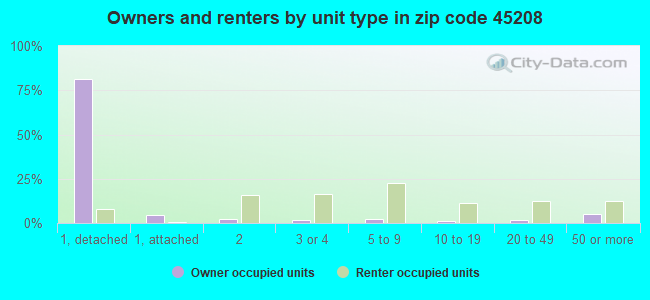
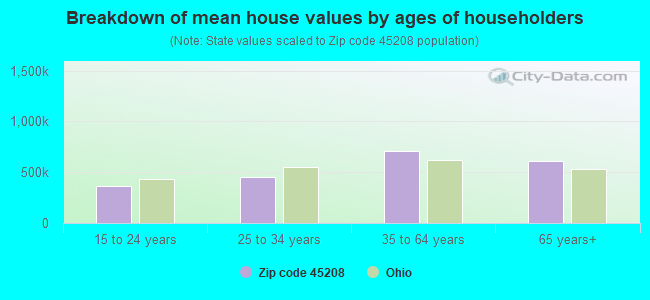


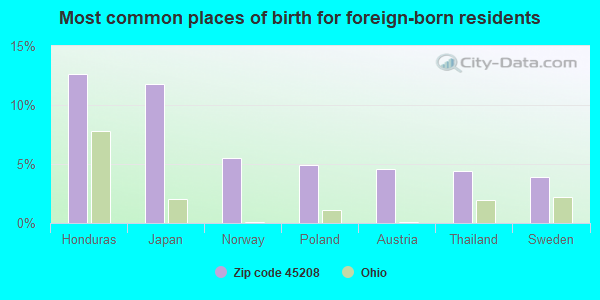
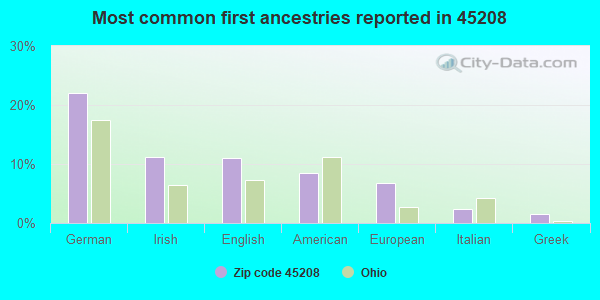
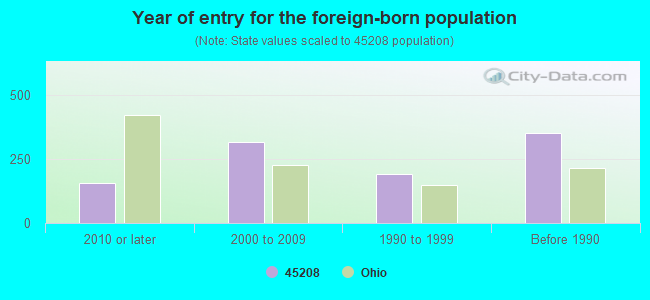


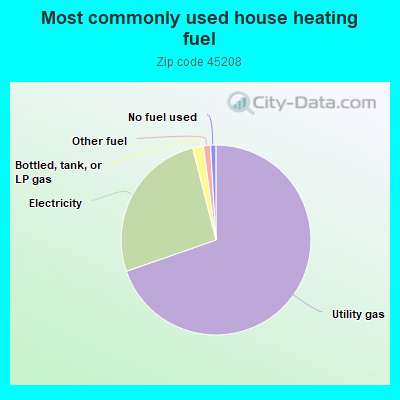
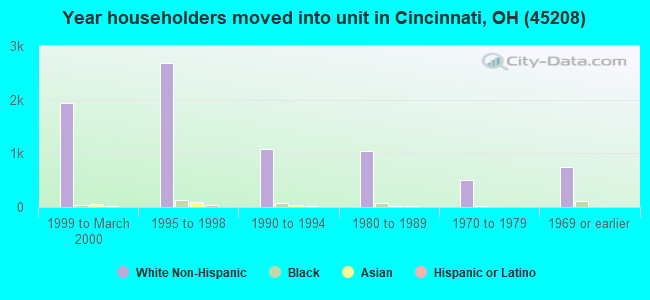
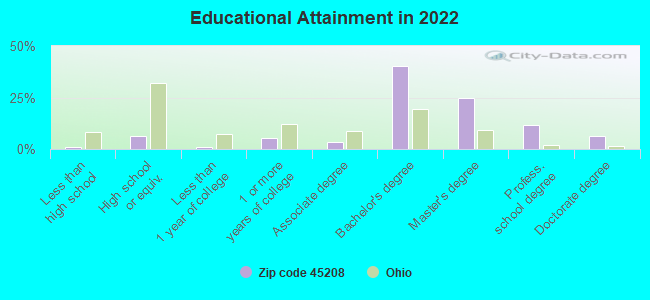
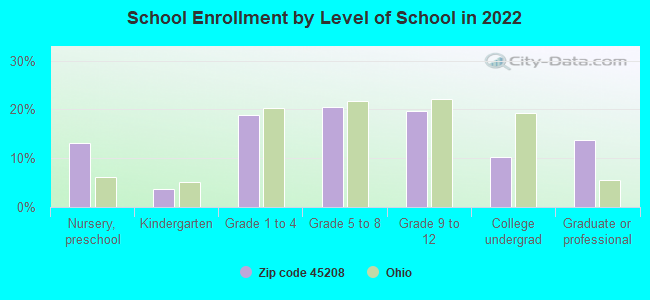
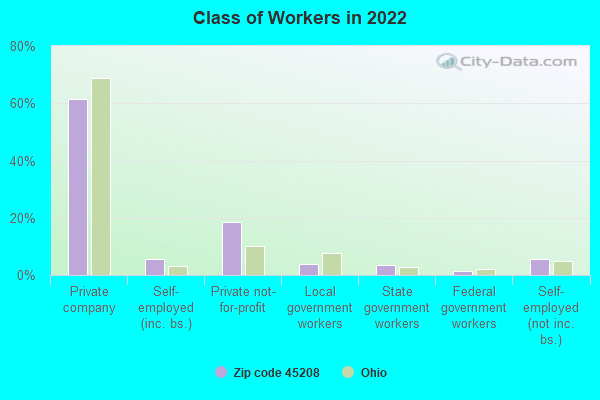
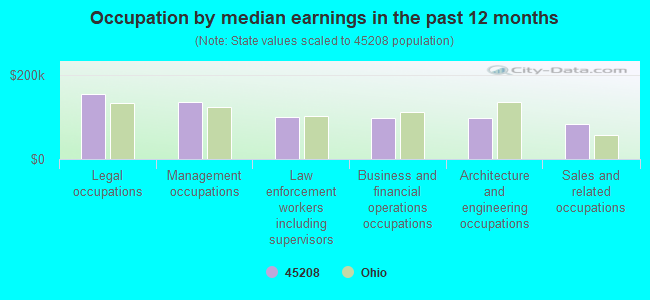
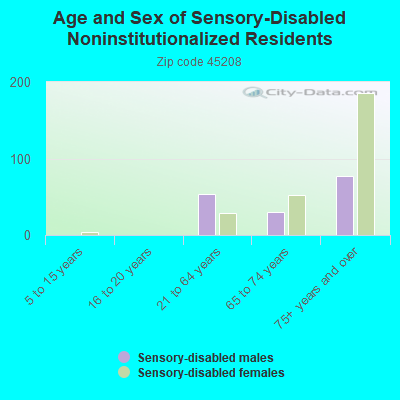
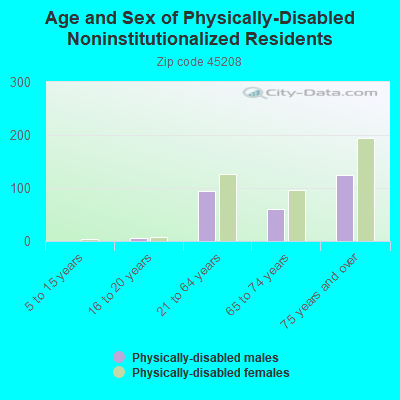
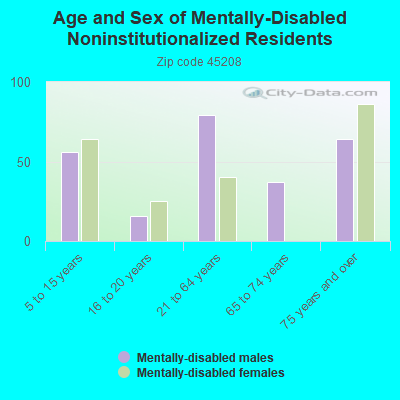
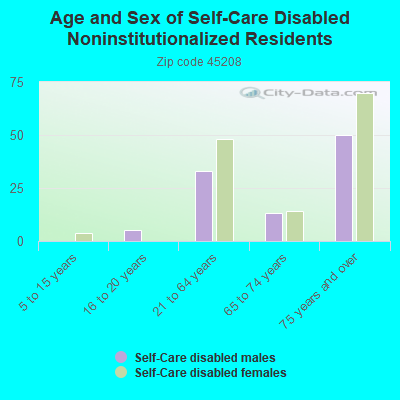
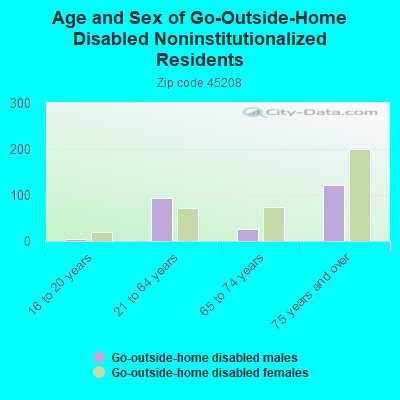
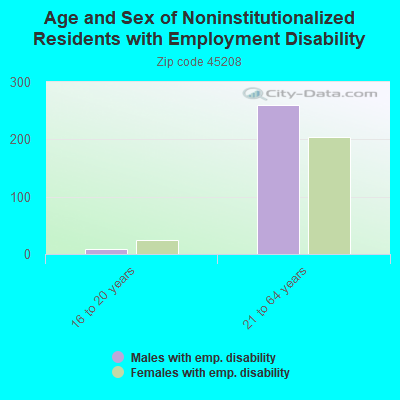
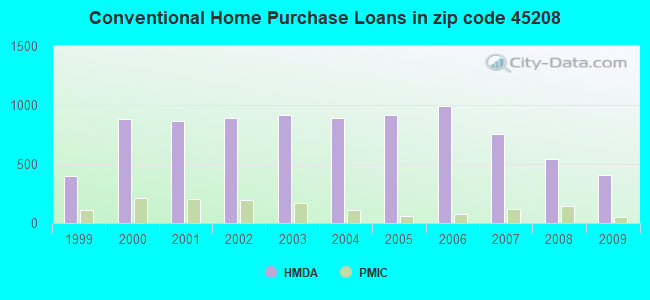
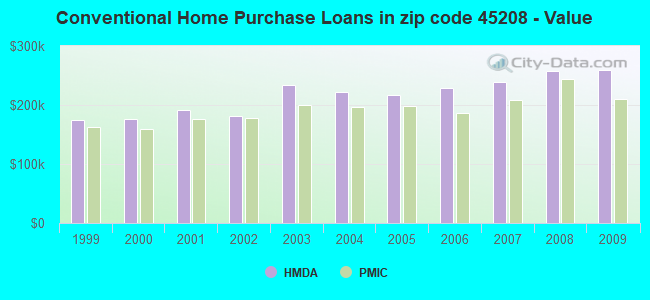
 According to the data from the years 2002 - 2018 the average number of fire incidents per year is 28. The highest number of reported fires - 53 took place in 2003, and the least - 10 in 2002. The data has a rising trend.
 When looking into fire subcategories, the most reports belonged to: Outside Fires (33.8%), and Structure Fires (27.9%).