Estimated zip code population in 2022: 6,790
Zip code population in 2010: 7,974
Zip code population in 2000: 9,259
Houses and condos: 3,006
Renter-occupied apartments: 938
% of renters here:
39%State:
33%
March 2022 cost of living index in zip code 45207: 88.0
(less than average, U.S. average is 100)
Land area: 1.2
sq. mi.
Water area: 0.0
sq. mi.
Population density: 5,774 people per square mile (average).
OSM Map
General Map
Google Map
MSN Map
OSM Map
General Map
Google Map
MSN Map
OSM Map
General Map
Google Map
MSN Map
OSM Map
General Map
Google Map
MSN Map
Please wait while loading the map...
Real estate property taxes paid for housing units in 2022:
This zip code:
1.0% ($1,454)Ohio:
1.3% ($2,639)
Median real estate property taxes paid for housing units with mortgages in 2022: $1,288 (0.6%)
Median real estate property taxes paid for housing units with no mortgage in 2022: $1,835 (1.5%)
Business Search - 14 Million verified businesses
Males: 3,361 Females: 3,428
For population 25 years and over in 45207:
High school or higher: 87.0%Bachelor's degree or higher: 24.9%Graduate or professional degree: 15.1%Unemployed: 6.9%Mean travel time to work (commute): 19.0 minutes
For population 15 years and over in 45207:
Never married: 65.3%Now married: 19.3%Separated: 0.7%Widowed: 5.0%Divorced: 9.8%
Zip code 45207 compared to state average:
Unemployed percentage above state average. Black race population percentage significantly above state average. Median age significantly below state average. Foreign-born population percentage above state average. House age significantly above state average. Number of college students significantly above state average. Percentage of population with a bachelor's degree or higher below state average. 3,824 56.4% Black 2,414 35.6% White 305 4.5% Hispanic or Latino 115 1.7% Asian 109 1.6% Two or more races 19 0.3% American Indian
Data:
Median household income ($)
Median household income (% change since 2000)
Household income diversity
Ratio of average income to average house value (%)
Ratio of average income to average rent
Median household income ($) - White
Median household income ($) - Black or African American
Median household income ($) - Asian
Median household income ($) - Hispanic or Latino
Median household income ($) - American Indian and Alaska Native
Median household income ($) - Multirace
Median household income ($) - Other Race
Median household income for houses/condos with a mortgage ($)
Median household income for apartments without a mortgage ($)
Races - White alone (%)
Races - White alone (% change since 2000)
Races - Black alone (%)
Races - Black alone (% change since 2000)
Races - American Indian alone (%)
Races - American Indian alone (% change since 2000)
Races - Asian alone (%)
Races - Asian alone (% change since 2000)
Races - Hispanic (%)
Races - Hispanic (% change since 2000)
Races - Native Hawaiian and Other Pacific Islander alone (%)
Races - Native Hawaiian and Other Pacific Islander alone (% change since 2000)
Races - Two or more races (%)
Races - Two or more races (% change since 2000)
Races - Other race alone (%)
Races - Other race alone (% change since 2000)
Racial diversity
Unemployment (%)
Unemployment (% change since 2000)
Unemployment (%) - White
Unemployment (%) - Black or African American
Unemployment (%) - Asian
Unemployment (%) - Hispanic or Latino
Unemployment (%) - American Indian and Alaska Native
Unemployment (%) - Multirace
Unemployment (%) - Other Race
Population density (people per square mile)
Population - Males (%)
Population - Females (%)
Population - Males (%) - White
Population - Males (%) - Black or African American
Population - Males (%) - Asian
Population - Males (%) - Hispanic or Latino
Population - Males (%) - American Indian and Alaska Native
Population - Males (%) - Multirace
Population - Males (%) - Other Race
Population - Females (%) - White
Population - Females (%) - Black or African American
Population - Females (%) - Asian
Population - Females (%) - Hispanic or Latino
Population - Females (%) - American Indian and Alaska Native
Population - Females (%) - Multirace
Population - Females (%) - Other Race
Coronavirus confirmed cases (Apr 27, 2024)
Deaths caused by coronavirus (Apr 27, 2024)
Coronavirus confirmed cases (per 100k population) (Apr 27, 2024)
Deaths caused by coronavirus (per 100k population) (Apr 27, 2024)
Daily increase in number of cases (Apr 27, 2024)
Weekly increase in number of cases (Apr 27, 2024)
Cases doubled (in days) (Apr 27, 2024)
Hospitalized patients (Apr 18, 2022)
Negative test results (Apr 18, 2022)
Total test results (Apr 18, 2022)
COVID Vaccine doses distributed (per 100k population) (Sep 19, 2023)
COVID Vaccine doses administered (per 100k population) (Sep 19, 2023)
COVID Vaccine doses distributed (Sep 19, 2023)
COVID Vaccine doses administered (Sep 19, 2023)
Likely homosexual households (%)
Likely homosexual households (% change since 2000)
Likely homosexual households - Lesbian couples (%)
Likely homosexual households - Lesbian couples (% change since 2000)
Likely homosexual households - Gay men (%)
Likely homosexual households - Gay men (% change since 2000)
Cost of living index
Median gross rent ($)
Median contract rent ($)
Median monthly housing costs ($)
Median house or condo value ($)
Median house or condo value ($ change since 2000)
Mean house or condo value by units in structure - 1, detached ($)
Mean house or condo value by units in structure - 1, attached ($)
Mean house or condo value by units in structure - 2 ($)
Mean house or condo value by units in structure by units in structure - 3 or 4 ($)
Mean house or condo value by units in structure - 5 or more ($)
Mean house or condo value by units in structure - Boat, RV, van, etc. ($)
Mean house or condo value by units in structure - Mobile home ($)
Median house or condo value ($) - White
Median house or condo value ($) - Black or African American
Median house or condo value ($) - Asian
Median house or condo value ($) - Hispanic or Latino
Median house or condo value ($) - American Indian and Alaska Native
Median house or condo value ($) - Multirace
Median house or condo value ($) - Other Race
Median resident age
Resident age diversity
Median resident age - Males
Median resident age - Females
Median resident age - White
Median resident age - Black or African American
Median resident age - Asian
Median resident age - Hispanic or Latino
Median resident age - American Indian and Alaska Native
Median resident age - Multirace
Median resident age - Other Race
Median resident age - Males - White
Median resident age - Males - Black or African American
Median resident age - Males - Asian
Median resident age - Males - Hispanic or Latino
Median resident age - Males - American Indian and Alaska Native
Median resident age - Males - Multirace
Median resident age - Males - Other Race
Median resident age - Females - White
Median resident age - Females - Black or African American
Median resident age - Females - Asian
Median resident age - Females - Hispanic or Latino
Median resident age - Females - American Indian and Alaska Native
Median resident age - Females - Multirace
Median resident age - Females - Other Race
Commute - mean travel time to work (minutes)
Travel time to work - Less than 5 minutes (%)
Travel time to work - Less than 5 minutes (% change since 2000)
Travel time to work - 5 to 9 minutes (%)
Travel time to work - 5 to 9 minutes (% change since 2000)
Travel time to work - 10 to 19 minutes (%)
Travel time to work - 10 to 19 minutes (% change since 2000)
Travel time to work - 20 to 29 minutes (%)
Travel time to work - 20 to 29 minutes (% change since 2000)
Travel time to work - 30 to 39 minutes (%)
Travel time to work - 30 to 39 minutes (% change since 2000)
Travel time to work - 40 to 59 minutes (%)
Travel time to work - 40 to 59 minutes (% change since 2000)
Travel time to work - 60 to 89 minutes (%)
Travel time to work - 60 to 89 minutes (% change since 2000)
Travel time to work - 90 or more minutes (%)
Travel time to work - 90 or more minutes (% change since 2000)
Marital status - Never married (%)
Marital status - Now married (%)
Marital status - Separated (%)
Marital status - Widowed (%)
Marital status - Divorced (%)
Median family income ($)
Median family income (% change since 2000)
Median non-family income ($)
Median non-family income (% change since 2000)
Median per capita income ($)
Median per capita income (% change since 2000)
Median family income ($) - White
Median family income ($) - Black or African American
Median family income ($) - Asian
Median family income ($) - Hispanic or Latino
Median family income ($) - American Indian and Alaska Native
Median family income ($) - Multirace
Median family income ($) - Other Race
Median year house/condo built
Median year apartment built
Year house built - Built 2005 or later (%)
Year house built - Built 2000 to 2004 (%)
Year house built - Built 1990 to 1999 (%)
Year house built - Built 1980 to 1989 (%)
Year house built - Built 1970 to 1979 (%)
Year house built - Built 1960 to 1969 (%)
Year house built - Built 1950 to 1959 (%)
Year house built - Built 1940 to 1949 (%)
Year house built - Built 1939 or earlier (%)
Average household size
Household density (households per square mile)
Average household size - White
Average household size - Black or African American
Average household size - Asian
Average household size - Hispanic or Latino
Average household size - American Indian and Alaska Native
Average household size - Multirace
Average household size - Other Race
Occupied housing units (%)
Vacant housing units (%)
Owner occupied housing units (%)
Renter occupied housing units (%)
Vacancy status - For rent (%)
Vacancy status - For sale only (%)
Vacancy status - Rented or sold, not occupied (%)
Vacancy status - For seasonal, recreational, or occasional use (%)
Vacancy status - For migrant workers (%)
Vacancy status - Other vacant (%)
Residents with income below the poverty level (%)
Residents with income below 50% of the poverty level (%)
Children below poverty level (%)
Poor families by family type - Married-couple family (%)
Poor families by family type - Male, no wife present (%)
Poor families by family type - Female, no husband present (%)
Poverty status for native-born residents (%)
Poverty status for foreign-born residents (%)
Poverty among high school graduates not in families (%)
Poverty among people who did not graduate high school not in families (%)
Residents with income below the poverty level (%) - White
Residents with income below the poverty level (%) - Black or African American
Residents with income below the poverty level (%) - Asian
Residents with income below the poverty level (%) - Hispanic or Latino
Residents with income below the poverty level (%) - American Indian and Alaska Native
Residents with income below the poverty level (%) - Multirace
Residents with income below the poverty level (%) - Other Race
Air pollution - Air Quality Index (AQI)
Air pollution - CO
Air pollution - NO2
Air pollution - SO2
Air pollution - Ozone
Air pollution - PM10
Air pollution - PM25
Air pollution - Pb
Crime - Murders per 100,000 population
Crime - Rapes per 100,000 population
Crime - Robberies per 100,000 population
Crime - Assaults per 100,000 population
Crime - Burglaries per 100,000 population
Crime - Thefts per 100,000 population
Crime - Auto thefts per 100,000 population
Crime - Arson per 100,000 population
Crime - City-data.com crime index
Crime - Violent crime index
Crime - Property crime index
Crime - Murders per 100,000 population (5 year average)
Crime - Rapes per 100,000 population (5 year average)
Crime - Robberies per 100,000 population (5 year average)
Crime - Assaults per 100,000 population (5 year average)
Crime - Burglaries per 100,000 population (5 year average)
Crime - Thefts per 100,000 population (5 year average)
Crime - Auto thefts per 100,000 population (5 year average)
Crime - Arson per 100,000 population (5 year average)
Crime - City-data.com crime index (5 year average)
Crime - Violent crime index (5 year average)
Crime - Property crime index (5 year average)
1996 Presidential Elections Results (%) - Democratic Party (Clinton)
1996 Presidential Elections Results (%) - Republican Party (Dole)
1996 Presidential Elections Results (%) - Other
2000 Presidential Elections Results (%) - Democratic Party (Gore)
2000 Presidential Elections Results (%) - Republican Party (Bush)
2000 Presidential Elections Results (%) - Other
2004 Presidential Elections Results (%) - Democratic Party (Kerry)
2004 Presidential Elections Results (%) - Republican Party (Bush)
2004 Presidential Elections Results (%) - Other
2008 Presidential Elections Results (%) - Democratic Party (Obama)
2008 Presidential Elections Results (%) - Republican Party (McCain)
2008 Presidential Elections Results (%) - Other
2012 Presidential Elections Results (%) - Democratic Party (Obama)
2012 Presidential Elections Results (%) - Republican Party (Romney)
2012 Presidential Elections Results (%) - Other
2016 Presidential Elections Results (%) - Democratic Party (Clinton)
2016 Presidential Elections Results (%) - Republican Party (Trump)
2016 Presidential Elections Results (%) - Other
2020 Presidential Elections Results (%) - Democratic Party (Biden)
2020 Presidential Elections Results (%) - Republican Party (Trump)
2020 Presidential Elections Results (%) - Other
Ancestries Reported - Arab (%)
Ancestries Reported - Czech (%)
Ancestries Reported - Danish (%)
Ancestries Reported - Dutch (%)
Ancestries Reported - English (%)
Ancestries Reported - French (%)
Ancestries Reported - French Canadian (%)
Ancestries Reported - German (%)
Ancestries Reported - Greek (%)
Ancestries Reported - Hungarian (%)
Ancestries Reported - Irish (%)
Ancestries Reported - Italian (%)
Ancestries Reported - Lithuanian (%)
Ancestries Reported - Norwegian (%)
Ancestries Reported - Polish (%)
Ancestries Reported - Portuguese (%)
Ancestries Reported - Russian (%)
Ancestries Reported - Scotch-Irish (%)
Ancestries Reported - Scottish (%)
Ancestries Reported - Slovak (%)
Ancestries Reported - Subsaharan African (%)
Ancestries Reported - Swedish (%)
Ancestries Reported - Swiss (%)
Ancestries Reported - Ukrainian (%)
Ancestries Reported - United States (%)
Ancestries Reported - Welsh (%)
Ancestries Reported - West Indian (%)
Ancestries Reported - Other (%)
Educational Attainment - No schooling completed (%)
Educational Attainment - Less than high school (%)
Educational Attainment - High school or equivalent (%)
Educational Attainment - Less than 1 year of college (%)
Educational Attainment - 1 or more years of college (%)
Educational Attainment - Associate degree (%)
Educational Attainment - Bachelor's degree (%)
Educational Attainment - Master's degree (%)
Educational Attainment - Professional school degree (%)
Educational Attainment - Doctorate degree (%)
School Enrollment - Nursery, preschool (%)
School Enrollment - Kindergarten (%)
School Enrollment - Grade 1 to 4 (%)
School Enrollment - Grade 5 to 8 (%)
School Enrollment - Grade 9 to 12 (%)
School Enrollment - College undergrad (%)
School Enrollment - Graduate or professional (%)
School Enrollment - Not enrolled in school (%)
School enrollment - Public schools (%)
School enrollment - Private schools (%)
School enrollment - Not enrolled (%)
Median number of rooms in houses and condos
Median number of rooms in apartments
Housing units lacking complete plumbing facilities (%)
Housing units lacking complete kitchen facilities (%)
Density of houses
Urban houses (%)
Rural houses (%)
Households with people 60 years and over (%)
Households with people 65 years and over (%)
Households with people 75 years and over (%)
Households with one or more nonrelatives (%)
Households with no nonrelatives (%)
Population in households (%)
Family households (%)
Nonfamily households (%)
Population in families (%)
Family households with own children (%)
Median number of bedrooms in owner occupied houses
Mean number of bedrooms in owner occupied houses
Median number of bedrooms in renter occupied houses
Mean number of bedrooms in renter occupied houses
Median number of vehichles in owner occupied houses
Mean number of vehichles in owner occupied houses
Median number of vehichles in renter occupied houses
Mean number of vehichles in renter occupied houses
Mortgage status - with mortgage (%)
Mortgage status - with second mortgage (%)
Mortgage status - with home equity loan (%)
Mortgage status - with both second mortgage and home equity loan (%)
Mortgage status - without a mortgage (%)
Average family size
Average family size - White
Average family size - Black or African American
Average family size - Asian
Average family size - Hispanic or Latino
Average family size - American Indian and Alaska Native
Average family size - Multirace
Average family size - Other Race
Geographical mobility - Same house 1 year ago (%)
Geographical mobility - Moved within same county (%)
Geographical mobility - Moved from different county within same state (%)
Geographical mobility - Moved from different state (%)
Geographical mobility - Moved from abroad (%)
Place of birth - Born in state of residence (%)
Place of birth - Born in other state (%)
Place of birth - Native, outside of US (%)
Place of birth - Foreign born (%)
Housing units in structures - 1, detached (%)
Housing units in structures - 1, attached (%)
Housing units in structures - 2 (%)
Housing units in structures - 3 or 4 (%)
Housing units in structures - 5 to 9 (%)
Housing units in structures - 10 to 19 (%)
Housing units in structures - 20 to 49 (%)
Housing units in structures - 50 or more (%)
Housing units in structures - Mobile home (%)
Housing units in structures - Boat, RV, van, etc. (%)
House/condo owner moved in on average (years ago)
Renter moved in on average (years ago)
Year householder moved into unit - Moved in 1999 to March 2000 (%)
Year householder moved into unit - Moved in 1995 to 1998 (%)
Year householder moved into unit - Moved in 1990 to 1994 (%)
Year householder moved into unit - Moved in 1980 to 1989 (%)
Year householder moved into unit - Moved in 1970 to 1979 (%)
Year householder moved into unit - Moved in 1969 or earlier (%)
Means of transportation to work - Drove car alone (%)
Means of transportation to work - Carpooled (%)
Means of transportation to work - Public transportation (%)
Means of transportation to work - Bus or trolley bus (%)
Means of transportation to work - Streetcar or trolley car (%)
Means of transportation to work - Subway or elevated (%)
Means of transportation to work - Railroad (%)
Means of transportation to work - Ferryboat (%)
Means of transportation to work - Taxicab (%)
Means of transportation to work - Motorcycle (%)
Means of transportation to work - Bicycle (%)
Means of transportation to work - Walked (%)
Means of transportation to work - Other means (%)
Working at home (%)
Industry diversity
Most Common Industries - Agriculture, forestry, fishing and hunting, and mining (%)
Most Common Industries - Agriculture, forestry, fishing and hunting (%)
Most Common Industries - Mining, quarrying, and oil and gas extraction (%)
Most Common Industries - Construction (%)
Most Common Industries - Manufacturing (%)
Most Common Industries - Wholesale trade (%)
Most Common Industries - Retail trade (%)
Most Common Industries - Transportation and warehousing, and utilities (%)
Most Common Industries - Transportation and warehousing (%)
Most Common Industries - Utilities (%)
Most Common Industries - Information (%)
Most Common Industries - Finance and insurance, and real estate and rental and leasing (%)
Most Common Industries - Finance and insurance (%)
Most Common Industries - Real estate and rental and leasing (%)
Most Common Industries - Professional, scientific, and management, and administrative and waste management services (%)
Most Common Industries - Professional, scientific, and technical services (%)
Most Common Industries - Management of companies and enterprises (%)
Most Common Industries - Administrative and support and waste management services (%)
Most Common Industries - Educational services, and health care and social assistance (%)
Most Common Industries - Educational services (%)
Most Common Industries - Health care and social assistance (%)
Most Common Industries - Arts, entertainment, and recreation, and accommodation and food services (%)
Most Common Industries - Arts, entertainment, and recreation (%)
Most Common Industries - Accommodation and food services (%)
Most Common Industries - Other services, except public administration (%)
Most Common Industries - Public administration (%)
Occupation diversity
Most Common Occupations - Management, business, science, and arts occupations (%)
Most Common Occupations - Management, business, and financial occupations (%)
Most Common Occupations - Management occupations (%)
Most Common Occupations - Business and financial operations occupations (%)
Most Common Occupations - Computer, engineering, and science occupations (%)
Most Common Occupations - Computer and mathematical occupations (%)
Most Common Occupations - Architecture and engineering occupations (%)
Most Common Occupations - Life, physical, and social science occupations (%)
Most Common Occupations - Education, legal, community service, arts, and media occupations (%)
Most Common Occupations - Community and social service occupations (%)
Most Common Occupations - Legal occupations (%)
Most Common Occupations - Education, training, and library occupations (%)
Most Common Occupations - Arts, design, entertainment, sports, and media occupations (%)
Most Common Occupations - Healthcare practitioners and technical occupations (%)
Most Common Occupations - Health diagnosing and treating practitioners and other technical occupations (%)
Most Common Occupations - Health technologists and technicians (%)
Most Common Occupations - Service occupations (%)
Most Common Occupations - Healthcare support occupations (%)
Most Common Occupations - Protective service occupations (%)
Most Common Occupations - Fire fighting and prevention, and other protective service workers including supervisors (%)
Most Common Occupations - Law enforcement workers including supervisors (%)
Most Common Occupations - Food preparation and serving related occupations (%)
Most Common Occupations - Building and grounds cleaning and maintenance occupations (%)
Most Common Occupations - Personal care and service occupations (%)
Most Common Occupations - Sales and office occupations (%)
Most Common Occupations - Sales and related occupations (%)
Most Common Occupations - Office and administrative support occupations (%)
Most Common Occupations - Natural resources, construction, and maintenance occupations (%)
Most Common Occupations - Farming, fishing, and forestry occupations (%)
Most Common Occupations - Construction and extraction occupations (%)
Most Common Occupations - Installation, maintenance, and repair occupations (%)
Most Common Occupations - Production, transportation, and material moving occupations (%)
Most Common Occupations - Production occupations (%)
Most Common Occupations - Transportation occupations (%)
Most Common Occupations - Material moving occupations (%)
People in Group quarters - Institutionalized population (%)
People in Group quarters - Correctional institutions (%)
People in Group quarters - Federal prisons and detention centers (%)
People in Group quarters - Halfway houses (%)
People in Group quarters - Local jails and other confinement facilities (including police lockups) (%)
People in Group quarters - Military disciplinary barracks (%)
People in Group quarters - State prisons (%)
People in Group quarters - Other types of correctional institutions (%)
People in Group quarters - Nursing homes (%)
People in Group quarters - Hospitals/wards, hospices, and schools for the handicapped (%)
People in Group quarters - Hospitals/wards and hospices for chronically ill (%)
People in Group quarters - Hospices or homes for chronically ill (%)
People in Group quarters - Military hospitals or wards for chronically ill (%)
People in Group quarters - Other hospitals or wards for chronically ill (%)
People in Group quarters - Hospitals or wards for drug/alcohol abuse (%)
People in Group quarters - Mental (Psychiatric) hospitals or wards (%)
People in Group quarters - Schools, hospitals, or wards for the mentally retarded (%)
People in Group quarters - Schools, hospitals, or wards for the physically handicapped (%)
People in Group quarters - Institutions for the deaf (%)
People in Group quarters - Institutions for the blind (%)
People in Group quarters - Orthopedic wards and institutions for the physically handicapped (%)
People in Group quarters - Wards in general hospitals for patients who have no usual home elsewhere (%)
People in Group quarters - Wards in military hospitals for patients who have no usual home elsewhere (%)
People in Group quarters - Juvenile institutions (%)
People in Group quarters - Long-term care (%)
People in Group quarters - Homes for abused, dependent, and neglected children (%)
People in Group quarters - Residential treatment centers for emotionally disturbed children (%)
People in Group quarters - Training schools for juvenile delinquents (%)
People in Group quarters - Short-term care, detention or diagnostic centers for delinquent children (%)
People in Group quarters - Type of juvenile institution unknown (%)
People in Group quarters - Noninstitutionalized population (%)
People in Group quarters - College dormitories (includes college quarters off campus) (%)
People in Group quarters - Military quarters (%)
People in Group quarters - On base (%)
People in Group quarters - Barracks, unaccompanied personnel housing (UPH), (Enlisted/Officer), ;and similar group living quarters for military personnel (%)
People in Group quarters - Transient quarters for temporary residents (%)
People in Group quarters - Military ships (%)
People in Group quarters - Group homes (%)
People in Group quarters - Homes or halfway houses for drug/alcohol abuse (%)
People in Group quarters - Homes for the mentally ill (%)
People in Group quarters - Homes for the mentally retarded (%)
People in Group quarters - Homes for the physically handicapped (%)
People in Group quarters - Other group homes (%)
People in Group quarters - Religious group quarters (%)
People in Group quarters - Dormitories (%)
People in Group quarters - Agriculture workers' dormitories on farms (%)
People in Group quarters - Job Corps and vocational training facilities (%)
People in Group quarters - Other workers' dormitories (%)
People in Group quarters - Crews of maritime vessels (%)
People in Group quarters - Other nonhousehold living situations (%)
People in Group quarters - Other noninstitutional group quarters (%)
Residents speaking English at home (%)
Residents speaking English at home - Born in the United States (%)
Residents speaking English at home - Native, born elsewhere (%)
Residents speaking English at home - Foreign born (%)
Residents speaking Spanish at home (%)
Residents speaking Spanish at home - Born in the United States (%)
Residents speaking Spanish at home - Native, born elsewhere (%)
Residents speaking Spanish at home - Foreign born (%)
Residents speaking other language at home (%)
Residents speaking other language at home - Born in the United States (%)
Residents speaking other language at home - Native, born elsewhere (%)
Residents speaking other language at home - Foreign born (%)
Class of Workers - Employee of private company (%)
Class of Workers - Self-employed in own incorporated business (%)
Class of Workers - Private not-for-profit wage and salary workers (%)
Class of Workers - Local government workers (%)
Class of Workers - State government workers (%)
Class of Workers - Federal government workers (%)
Class of Workers - Self-employed workers in own not incorporated business and Unpaid family workers (%)
House heating fuel used in houses and condos - Utility gas (%)
House heating fuel used in houses and condos - Bottled, tank, or LP gas (%)
House heating fuel used in houses and condos - Electricity (%)
House heating fuel used in houses and condos - Fuel oil, kerosene, etc. (%)
House heating fuel used in houses and condos - Coal or coke (%)
House heating fuel used in houses and condos - Wood (%)
House heating fuel used in houses and condos - Solar energy (%)
House heating fuel used in houses and condos - Other fuel (%)
House heating fuel used in houses and condos - No fuel used (%)
House heating fuel used in apartments - Utility gas (%)
House heating fuel used in apartments - Bottled, tank, or LP gas (%)
House heating fuel used in apartments - Electricity (%)
House heating fuel used in apartments - Fuel oil, kerosene, etc. (%)
House heating fuel used in apartments - Coal or coke (%)
House heating fuel used in apartments - Wood (%)
House heating fuel used in apartments - Solar energy (%)
House heating fuel used in apartments - Other fuel (%)
House heating fuel used in apartments - No fuel used (%)
Armed forces status - In Armed Forces (%)
Armed forces status - Civilian (%)
Armed forces status - Civilian - Veteran (%)
Armed forces status - Civilian - Nonveteran (%)
Fatal accidents locations in years 2005-2021
Fatal accidents locations in 2005
Fatal accidents locations in 2006
Fatal accidents locations in 2007
Fatal accidents locations in 2008
Fatal accidents locations in 2009
Fatal accidents locations in 2010
Fatal accidents locations in 2011
Fatal accidents locations in 2012
Fatal accidents locations in 2013
Fatal accidents locations in 2014
Fatal accidents locations in 2015
Fatal accidents locations in 2016
Fatal accidents locations in 2017
Fatal accidents locations in 2018
Fatal accidents locations in 2019
Fatal accidents locations in 2020
Fatal accidents locations in 2021
Alcohol use - People drinking some alcohol every month (%)
Alcohol use - People not drinking at all (%)
Alcohol use - Average days/month drinking alcohol
Alcohol use - Average drinks/week
Alcohol use - Average days/year people drink much
Audiometry - Average condition of hearing (%)
Audiometry - People that can hear a whisper from across a quiet room (%)
Audiometry - People that can hear normal voice from across a quiet room (%)
Audiometry - Ears ringing, roaring, buzzing (%)
Audiometry - Had a job exposure to loud noise (%)
Audiometry - Had off-work exposure to loud noise (%)
Blood Pressure & Cholesterol - Has high blood pressure (%)
Blood Pressure & Cholesterol - Checking blood pressure at home (%)
Blood Pressure & Cholesterol - Frequently checking blood cholesterol (%)
Blood Pressure & Cholesterol - Has high cholesterol level (%)
Consumer Behavior - Money monthly spent on food at supermarket/grocery store
Consumer Behavior - Money monthly spent on food at other stores
Consumer Behavior - Money monthly spent on eating out
Consumer Behavior - Money monthly spent on carryout/delivered foods
Consumer Behavior - Income spent on food at supermarket/grocery store (%)
Consumer Behavior - Income spent on food at other stores (%)
Consumer Behavior - Income spent on eating out (%)
Consumer Behavior - Income spent on carryout/delivered foods (%)
Current Health Status - General health condition (%)
Current Health Status - Blood donors (%)
Current Health Status - Has blood ever tested for HIV virus (%)
Current Health Status - Left-handed people (%)
Dermatology - People using sunscreen (%)
Diabetes - Diabetics (%)
Diabetes - Had a blood test for high blood sugar (%)
Diabetes - People taking insulin (%)
Diet Behavior & Nutrition - Diet health (%)
Diet Behavior & Nutrition - Milk product consumption (# of products/month)
Diet Behavior & Nutrition - Meals not home prepared (#/week)
Diet Behavior & Nutrition - Meals from fast food or pizza place (#/week)
Diet Behavior & Nutrition - Ready-to-eat foods (#/month)
Diet Behavior & Nutrition - Frozen meals/pizza (#/month)
Drug Use - People that ever used marijuana or hashish (%)
Drug Use - Ever used hard drugs (%)
Drug Use - Ever used any form of cocaine (%)
Drug Use - Ever used heroin (%)
Drug Use - Ever used methamphetamine (%)
Health Insurance - People covered by health insurance (%)
Kidney Conditions-Urology - Avg. # of times urinating at night
Medical Conditions - People with asthma (%)
Medical Conditions - People with anemia (%)
Medical Conditions - People with psoriasis (%)
Medical Conditions - People with overweight (%)
Medical Conditions - Elderly people having difficulties in thinking or remembering (%)
Medical Conditions - People who ever received blood transfusion (%)
Medical Conditions - People having trouble seeing even with glass/contacts (%)
Medical Conditions - People with arthritis (%)
Medical Conditions - People with gout (%)
Medical Conditions - People with congestive heart failure (%)
Medical Conditions - People with coronary heart disease (%)
Medical Conditions - People with angina pectoris (%)
Medical Conditions - People who ever had heart attack (%)
Medical Conditions - People who ever had stroke (%)
Medical Conditions - People with emphysema (%)
Medical Conditions - People with thyroid problem (%)
Medical Conditions - People with chronic bronchitis (%)
Medical Conditions - People with any liver condition (%)
Medical Conditions - People who ever had cancer or malignancy (%)
Mental Health - People who have little interest in doing things (%)
Mental Health - People feeling down, depressed, or hopeless (%)
Mental Health - People who have trouble sleeping or sleeping too much (%)
Mental Health - People feeling tired or having little energy (%)
Mental Health - People with poor appetite or overeating (%)
Mental Health - People feeling bad about themself (%)
Mental Health - People who have trouble concentrating on things (%)
Mental Health - People moving or speaking slowly or too fast (%)
Mental Health - People having thoughts they would be better off dead (%)
Oral Health - Average years since last visit a dentist
Oral Health - People embarrassed because of mouth (%)
Oral Health - People with gum disease (%)
Oral Health - General health of teeth and gums (%)
Oral Health - Average days a week using dental floss/device
Oral Health - Average days a week using mouthwash for dental problem
Oral Health - Average number of teeth
Pesticide Use - Households using pesticides to control insects (%)
Pesticide Use - Households using pesticides to kill weeds (%)
Physical Activity - People doing vigorous-intensity work activities (%)
Physical Activity - People doing moderate-intensity work activities (%)
Physical Activity - People walking or bicycling (%)
Physical Activity - People doing vigorous-intensity recreational activities (%)
Physical Activity - People doing moderate-intensity recreational activities (%)
Physical Activity - Average hours a day doing sedentary activities
Physical Activity - Average hours a day watching TV or videos
Physical Activity - Average hours a day using computer
Physical Functioning - People having limitations keeping them from working (%)
Physical Functioning - People limited in amount of work they can do (%)
Physical Functioning - People that need special equipment to walk (%)
Physical Functioning - People experiencing confusion/memory problems (%)
Physical Functioning - People requiring special healthcare equipment (%)
Prescription Medications - Average number of prescription medicines taking
Preventive Aspirin Use - Adults 40+ taking low-dose aspirin (%)
Reproductive Health - Vaginal deliveries (%)
Reproductive Health - Cesarean deliveries (%)
Reproductive Health - Deliveries resulted in a live birth (%)
Reproductive Health - Pregnancies resulted in a delivery (%)
Reproductive Health - Women breastfeeding newborns (%)
Reproductive Health - Women that had a hysterectomy (%)
Reproductive Health - Women that had both ovaries removed (%)
Reproductive Health - Women that have ever taken birth control pills (%)
Reproductive Health - Women taking birth control pills (%)
Reproductive Health - Women that have ever used Depo-Provera or injectables (%)
Reproductive Health - Women that have ever used female hormones (%)
Sexual Behavior - People 18+ that ever had sex (vaginal, anal, or oral) (%)
Sexual Behavior - Males 18+ that ever had vaginal sex with a woman (%)
Sexual Behavior - Males 18+ that ever performed oral sex on a woman (%)
Sexual Behavior - Males 18+ that ever had anal sex with a woman (%)
Sexual Behavior - Males 18+ that ever had any sex with a man (%)
Sexual Behavior - Females 18+ that ever had vaginal sex with a man (%)
Sexual Behavior - Females 18+ that ever performed oral sex on a man (%)
Sexual Behavior - Females 18+ that ever had anal sex with a man (%)
Sexual Behavior - Females 18+ that ever had any kind of sex with a woman (%)
Sexual Behavior - Average age people first had sex
Sexual Behavior - Average number of female sex partners in lifetime (males 18+)
Sexual Behavior - Average number of female vaginal sex partners in lifetime (males 18+)
Sexual Behavior - Average age people first performed oral sex on a woman (18+)
Sexual Behavior - Average number of woman performed oral sex on in lifetime (18+)
Sexual Behavior - Average number of male sex partners in lifetime (males 18+)
Sexual Behavior - Average number of male anal sex partners in lifetime (males 18+)
Sexual Behavior - Average age people first performed oral sex on a man (18+)
Sexual Behavior - Average number of male oral sex partners in lifetime (18+)
Sexual Behavior - People using protection when performing oral sex (%)
Sexual Behavior - Average number of times people have vaginal or anal sex a year
Sexual Behavior - People having sex without condom (%)
Sexual Behavior - Average number of male sex partners in lifetime (females 18+)
Sexual Behavior - Average number of male vaginal sex partners in lifetime (females 18+)
Sexual Behavior - Average number of female sex partners in lifetime (females 18+)
Sexual Behavior - Circumcised males 18+ (%)
Sleep Disorders - Average hours sleeping at night
Sleep Disorders - People that has trouble sleeping (%)
Smoking-Cigarette Use - People smoking cigarettes (%)
Taste & Smell - People 40+ having problems with smell (%)
Taste & Smell - People 40+ having problems with taste (%)
Taste & Smell - People 40+ that ever had wisdom teeth removed (%)
Taste & Smell - People 40+ that ever had tonsils teeth removed (%)
Taste & Smell - People 40+ that ever had a loss of consciousness because of a head injury (%)
Taste & Smell - People 40+ that ever had a broken nose or other serious injury to face or skull (%)
Taste & Smell - People 40+ that ever had two or more sinus infections (%)
Weight - Average height (inches)
Weight - Average weight (pounds)
Weight - Average BMI
Weight - People that are obese (%)
Weight - People that ever were obese (%)
Weight - People trying to lose weight (%)
100%
urban population.
Estimated median house/condo value in 2022: $144,529
45207:
$144,529Ohio:
$204,100
According to our research of Ohio and other state lists, there were 5 registered sex offenders living in 45207 zip code as of April 27, 2024 . The ratio of all residents to sex offenders in zip code 45207 is 1,495 to 1.The ratio of registered sex offenders to all residents in this zip code is much lower than the state average.
Median resident age: This zip code:
27.4 yearsOhio median age:
39.9 years
Average household size: This zip code:
2.1 peopleOhio:
2.4 people
Averages for the 2020 tax year for zip code 45207, filed in 2021:
Average Adjusted Gross Income (AGI) in 2020: $36,337 (Individual Income Tax Returns) Here:
$36,337State:
$67,288
Salary/wage: $32,941 (reported on 87.1% of returns )Here:
$32,941State:
$55,628
(% of AGI for various income ranges: 1099.9% for AGIs below $25k , 3549.2% for AGIs $25k-50k , 6506.8% for AGIs $50k-75k , 9902.9% for AGIs $75k-100k , 16615.7% for AGIs $100k-200k ) Taxable interest for individuals: $272 (reported on 10.0% of returns )This zip code:
$272Ohio:
$1,518
(% of AGI for various income ranges: 1.3% for AGIs below $25k , 0.9% for AGIs $25k-50k , 2.6% for AGIs $50k-75k , 24.3% for AGIs $75k-100k , 38.6% for AGIs $100k-200k ) Ordinary dividends: $1,033 (reported on 6.0% of returns )(% of AGI for various income ranges: 1.4% for AGIs below $25k , 5.8% for AGIs $25k-50k , 8.9% for AGIs $50k-75k , 40.0% for AGIs $75k-100k , 82.9% for AGIs $100k-200k ) Net capital gain/loss in AGI: +$1,633 (reported on 6.0% of returns )Here:
+$1,633State:
+$18,919
(% of AGI for various income ranges: 1.3% for AGIs below $25k , 3.6% for AGIs $25k-50k , 47.9% for AGIs $50k-75k , 167.1% for AGIs $100k-200k ) Profit/loss from business: +$4,538 (reported on 14.9% of returns )Here:
+$4,538State:
+$13,744
(% of AGI for various income ranges: 56.4% for AGIs below $25k , 87.6% for AGIs $25k-50k , 200.0% for AGIs $50k-75k , 117.1% for AGIs $75k-100k , 115.7% for AGIs $100k-200k ) Taxable individual retirement arrangement distribution: $12,414 (reported on 2.8% of returns )45207:
$12,414Ohio:
$18,876
(% of AGI for various income ranges: 23.6% for AGIs below $25k , 334.2% for AGIs $50k-75k ) Total itemized deductions: $22,100 (reported on 3.6% of returns )Here:
$22,100State:
$33,869
(% of AGI for various income ranges: 519.5% for AGIs $50k-75k , 1431.4% for AGIs $100k-200k ) Charity contributions: $7,257 (reported on 2.8% of returns )(% of AGI for various income ranges: 111.6% for AGIs $50k-75k , 422.9% for AGIs $100k-200k ) Taxes paid: $6,300 (reported on 3.6% of returns )(% of AGI for various income ranges: 127.9% for AGIs $50k-75k , 462.9% for AGIs $100k-200k ) Earned income credit: $2,559 (reported on 32.5% of returns )(% of AGI for various income ranges: 150.4% for AGIs below $25k , 88.5% for AGIs $25k-50k ) Percentage of individuals using paid preparers for their 2020 taxes: 93.2%(% for various income ranges: 93.2% for AGIs below $25k , 93.8% for AGIs $25k-50k , 92.3% for AGIs $50k-75k , 90.0% for AGIs $75k-100k , 91.7% for AGIs $100k-200k , 100.0% for AGIs over 200k )
Averages for the 2012 tax year for zip code 45207, filed in 2013:
Average Adjusted Gross Income (AGI) in 2012: $25,070 (Individual Income Tax Returns) Here:
$25,070State:
$54,926
Salary/wage: $23,237 (reported on 85.7% of returns )Here:
$23,237State:
$45,869
(% of AGI for various income ranges: 78.7% for AGIs below $25k , 82.1% for AGIs $25k-50k , 78.5% for AGIs $50k-75k , 84.4% for AGIs $75k-100k , 69.1% for AGIs $100k-200k ) Taxable interest for individuals: $300 (reported on 9.3% of returns )This zip code:
$300Ohio:
$1,297
(% of AGI for various income ranges: 0.6% for AGIs $75k-100k ) Ordinary dividends: $1,364 (reported on 4.6% of returns )(% of AGI for various income ranges: 1.1% for AGIs $50k-75k ) Net capital gain/loss in AGI: +$867 (reported on 2.5% of returns )(% of AGI for various income ranges: 0.5% for AGIs $50k-75k ) Profit/loss from business: +$6,631 (reported on 11.0% of returns )Here:
+$6,631State:
+$12,773
(% of AGI for various income ranges: 8.6% for AGIs below $25k , 0.9% for AGIs $25k-50k ) Taxable individual retirement arrangement distribution: $7,840 (reported on 4.2% of returns )(% of AGI for various income ranges: 0.7% for AGIs below $25k , 2.1% for AGIs $25k-50k , 2.0% for AGIs $50k-75k ) Total itemized deductions: $13,261 (23% of AGI, reported on 11.8% of returns )Here:
$13,261State:
$21,278
Here:
23.4% of AGIState:
18.8% of AGI
(% of AGI for various income ranges: 1.9% for AGIs below $25k , 5.6% for AGIs $25k-50k , 9.7% for AGIs $50k-75k , 14.2% for AGIs $75k-100k , 11.6% for AGIs $100k-200k ) Charity contributions: $3,729 (reported on 8.9% of returns )(% of AGI for various income ranges: 0.4% for AGIs below $25k , 0.9% for AGIs $25k-50k , 2.5% for AGIs $50k-75k , 2.9% for AGIs $75k-100k , 2.4% for AGIs $100k-200k ) Taxes paid: $4,596 (reported on 11.0% of returns )(% of AGI for various income ranges: 0.4% for AGIs below $25k , 1.3% for AGIs $25k-50k , 3.3% for AGIs $50k-75k , 4.8% for AGIs $75k-100k , 5.6% for AGIs $100k-200k ) Earned income credit: $2,667 (reported on 40.5% of returns )(% of AGI for various income ranges: 12.2% for AGIs below $25k , 1.5% for AGIs $25k-50k ) Percentage of individuals using paid preparers for their 2012 taxes: 39.2%(% for various income ranges: 37.6% for AGIs below $25k , 41.9% for AGIs $25k-50k , 44.4% for AGIs $50k-75k , 75.0% for AGIs $75k-100k , 0.0% for AGIs $100k-200k )
Averages for the 2004 tax year for zip code 45207, filed in 2005:
Average Adjusted Gross Income (AGI) in 2004: $23,142 (Individual Income Tax Returns) Here:
$23,142State:
$44,480
Salary/wage: $21,790 (reported on 89.0% of returns )Here:
$21,790State:
$39,198
(% of AGI for various income ranges: 90.9% for AGIs below $10k , 84.9% for AGIs $10k-25k , 86.1% for AGIs $25k-50k , 85.1% for AGIs $50k-75k , 90.5% for AGIs $75k-100k , 61.1% for AGIs over 100k ) Taxable interest for individuals: $366 (reported on 14.3% of returns )This zip code:
$366Ohio:
$1,532
(% of AGI for various income ranges: 0.4% for AGIs below $10k , 0.1% for AGIs $10k-25k , 0.3% for AGIs $25k-50k , 0.4% for AGIs $50k-75k , 0.1% for AGIs over 100k ) Taxable dividends: $1,071 (reported on 6.1% of returns )(% of AGI for various income ranges: 0.2% for AGIs below $10k , 0.0% for AGIs $10k-25k , 0.4% for AGIs $25k-50k , 0.4% for AGIs $50k-75k , 0.5% for AGIs over 100k ) Net capital gain/loss: +$2,310 (reported on 3.7% of returns )Here:
+$2,310State:
+$8,582
(% of AGI for various income ranges: -0.0% for AGIs $10k-25k , 0.2% for AGIs $25k-50k , 0.7% for AGIs $50k-75k , 2.3% for AGIs over 100k ) Profit/loss from business: +$3,828 (reported on 6.8% of returns )Here:
+$3,828State:
+$10,813
(% of AGI for various income ranges: 2.3% for AGIs below $10k , 2.8% for AGIs $10k-25k , 0.6% for AGIs $25k-50k , -0.0% for AGIs $50k-75k ) IRA payment deduction: $667 (reported on 1.0% of returns )Total itemized deductions: $12,647 (25% of AGI, reported on 16.5% of returns )Here:
$12,647State:
$17,503
Here:
25.1% of AGIState:
20.8% of AGI
(% of AGI for various income ranges: 1.6% for AGIs below $10k , 4.0% for AGIs $10k-25k , 9.2% for AGIs $25k-50k , 13.8% for AGIs $50k-75k , 14.7% for AGIs $75k-100k , 17.1% for AGIs over 100k ) Charity contributions deductions: $3,243 (6% of AGI, reported on 13.7% of returns )Here:
6.1% of AGIState:
3.4% of AGI
(% of AGI for various income ranges: 0.6% for AGIs $10k-25k , 2.0% for AGIs $25k-50k , 3.2% for AGIs $50k-75k , 3.2% for AGIs $75k-100k , 3.9% for AGIs over 100k ) Total tax: $2,713 (reported on 56.1% of returns )(% of AGI for various income ranges: 1.6% for AGIs below $10k , 3.0% for AGIs $10k-25k , 6.3% for AGIs $25k-50k , 9.5% for AGIs $50k-75k , 11.8% for AGIs $75k-100k , 14.4% for AGIs over 100k ) Earned income credit: $2,077 (reported on 40.0% of returns )Percentage of individuals using paid preparers for their 2004 taxes: 56.2%(% for various income ranges: 52.6% for AGIs below $10k , 61.8% for AGIs $10k-25k , 54.1% for AGIs $25k-50k , 51.5% for AGIs $50k-75k , 54.5% for AGIs $75k-100k , 44.1% for AGIs over 100k )
Estimated median household income in 2022: This zip code:
$44,202Ohio:
$65,720
Nearest zip codes: 45229 ,
45206 ,
45212 ,
41074 ,
45217 ,
45208 .
Cincinnati Zip Code Map
Percentage of family households: This zip code:
32.1%Ohio:
43.3%
Percentage of households with unmarried partners: This zip code:
4.2%Ohio:
44.6%
No gay or lesbian households reported
Household received Food Stamps/SNAP in the past 12 months: 364Household did not receive Food Stamps/SNAP in the past 12 months: 2,028
Women who had a birth in the past 12 months: 50 (19 now married , 30 unmarried) Women who did not have a birth in the past 12 months: 1,921 (225 now married , 1,697 unmarried)
Housing units in zip code 45207 with a mortgage: 942 (42
second mortgage , 31
both second mortgage and home equity loan )
Houses without a mortgage: 3
Median monthly owner costs for units with a mortgage: $1,215
Median monthly owner costs for units without a mortgage: $504
Residents with income below the poverty level in 2022:
This zip code:
19.7%Whole state:
13.4%
Residents with income below 50% of the poverty level in 2022:
This zip code:
11.1%Whole state:
7.0%
Median number of rooms in houses and condos: Median number of rooms in apartments: Notable locations in this zip code not listed on our city pages
Click to draw/clear zip code borders Notable locations in zip code 45207: (A) , Walker Hall (B) , University Center (C) , Schott Building (D) , Schmidt Hall (E) , Romero International Center (F) , McDonald Library (G) , Logan Hall (H) , Kuhlman Hall (I) , Husman Hall (J) , Hinkle Hall (K) , Buschmann Hall (L) , Brockman Hall (M) , Alumni Hall (N) , Alter Hall (O) , Albers Hall (P) . Display/hide their locations on the map
Churches in zip code 45207 include: (A) , Calvary United Methodist Church (B) , Saint Andrews Episcopal Church (C) , Bellarmine Chapel (D) , First Baptist Church of Evanston (E) , Church of God Sanctified (F) , Bible Way Church of God in Christ (G) , Saint Marks Catholic Church (H) , Willing Workers Baptist Church (I) . Display/hide their locations on the map
Cemeteries: (1) , Jewish Cemetery (2) . Display/hide their locations on the map
Parks in zip code 45207 include: (1) , O'Brien Terrace (2) , Hoyes Field (3) . Display/hide their locations on the map
Tourist attraction (not listed on the city page) :
Year house built (houses)
0 2020 or later34 2010 to 201969 2000 to 200967 1990 to 199917 1980 to 198968 1970 to 197958 1960 to 1969119 1950 to 1959204 1940 to 19492,327 1939 or earlier
Zip code 45207 household income distribution in 2022 218 Less than $10,000123 $10,000 to $14,999148 $15,000 to $19,999130 $20,000 to $24,99938 $25,000 to $29,999231 $30,000 to $34,999131 $35,000 to $39,999194 $40,000 to $44,999212 $45,000 to $49,999170 $50,000 to $59,999169 $60,000 to $74,999235 $75,000 to $99,99973 $100,000 to $124,999103 $125,000 to $149,99984 $150,000 to $199,999133 $200,000 or moreEstimate of home value of owner-occupied houses/condos in 2022 in zip code 45207 8 Less than $10,000140 $35,000 to $39,99911 $40,000 to $49,99949 $50,000 to $59,999122 $70,000 to $79,99961 $80,000 to $89,99927 $90,000 to $99,999194 $100,000 to $124,99969 $125,000 to $149,99977 $150,000 to $174,999107 $175,000 to $199,999120 $200,000 to $249,99964 $250,000 to $299,999130 $300,000 to $399,999141 $400,000 to $499,99948 $500,000 to $749,99917 $750,000 to $999,999Rent paid by renters in 2022 in zip code 45207 44 Less than $1009 $150 to $19920 $200 to $24914 $250 to $29921 $350 to $39928 $400 to $44917 $450 to $49939 $500 to $54986 $550 to $599140 $600 to $64949 $650 to $69997 $700 to $74979 $800 to $899154 $900 to $99962 $1,000 to $1,24914 $1,250 to $1,4995 $1,500 to $1,99914 No cash rent
Median gross rent in 2022: $899.
Median price asked for vacant for-sale houses and condos in 2022: $233,049.
Estimated median house (or condo) value in 2022 for: White Non-Hispanic householders: $301,495Black or African American householders: $138,096Asian householders: $294,847Native Hawaiian and other Pacific Islander householders: $139,382Two or more races householders: $148,388Estimated median house or condo value in 2022: $144,529
45207:
$144,529Ohio:
$204,100
Lower value quartile - upper value quartile: $84,624 - $267,617
Mean price in 2022: Detached houses: $81,693Here:
$81,693State:
$254,366
Townhouses or other attached units: $445,702Here:
$445,702State:
$225,733
In 2-unit structures: $255,731Here:
$255,731State:
$144,384
Housing units in structures:
One, detached: 1,822One, attached: 55Two: 4713 or 4: 2075 to 9: 10010 to 19: 19320 to 49: 5750 or more: 81Unemployment : 6.9%
Means of transportation to work in zip code 45207 49.9% 1,463 Drove a car alone9.8% 287 Carpooled9.9% 289 Bus or trolley bus11.1% 326 Walked5.9% 172 Other means12.7% 371 Worked at homeTravel time to work (commute) in zip code 45207 328 Less than 5 minutes418 5 to 9 minutes479 10 to 14 minutes338 15 to 19 minutes168 20 to 24 minutes226 25 to 29 minutes196 30 to 34 minutes76 35 to 39 minutes59 40 to 44 minutes135 45 to 59 minutes84 60 to 89 minutes44 90 or more minutes
Percentage of zip code residents living and working in this county: 90.6%
Household type by relationship:
Households: 6,790
Male householders: 816 (314 living alone ), Female householders: 1,581 (799 living alone )551 spouses (551 opposite-sex spouses ), 111 unmarried partners , (88 opposite-sex unmarried partners ), 1,226 children (1,209 natural , 19 adopted , 0 stepchildren ), 71 grandchildren , 45 brothers or sisters , 34 parents , 121 foster children , 252 other relatives , 226 non-relatives In group quarters: 1,700 (-1 institutionalized population )
Size of family households: 568 2-persons , 233 3-persons , 182 4-persons , 62 5-persons , 15 6-persons , 31 7-or-more-persons
Size of nonfamily households: 1,115 1-person , 151 2-persons , 16 3-persons , 12 4-persons , 16 6-persons
315 married couples with children. single-parent households (40 men , 465 women ).
88.4% of residents of 45207 zip code speak English at home. of residents speak Spanish at home (55% very well, 30% well, 14% not well ).of residents speak other Indo-European language at home (52% very well, 29% well, 19% not well ).of residents speak Asian or Pacific Island language at home (73% very well, 17% well, 10% not well ).of residents speak other language at home (24% very well, 70% well, 6% not well ).
Foreign born population: 550 (8.1%)
(32.4%
of them are naturalized citizens )
This zip code:
8.1%Whole state:
5.0%
16% Nicaragua 7% Honduras 6% Japan 2% Thailand 1% Ireland 1% Zimbabwe 1% Poland 7% German 3% American 2% Irish 2% English 1% Italian 1% Senegalese 1% Polish
Year of entry for the foreign-born population
432 2010 or later 76 2000 to 2009 4 1990 to 1999 94 Before 1990
There are
33 Medical Specialists in Zip Code 45207 .
Facilities with environmental interests located in this zip code:
BASF CORP (1720 DANA AVENUE in CINCINNATI, OH)
STATE MASTER (Ohio general info) - RCRA-OHD004236816, HAZARDOUS WASTE PROGRAM Conditionally Exempt Small Quantity Generators, less than 100 kg/month of hazardous waste (Resource Conservation and Recovery Act (tracking hazardous waste)) - notification TRI REPORTER (Tracking of toxic chemicals releasing facilities) Business SIC classification: PAINTS, VARNISHES, LACQUERS, ENAMELS, AND ALLIED PRODUCTSAlternative names: BASF CORP., COATINGS & INKS DIV., BASF CORP DANA AVE
ACADEMY OF WORLD LANGUAGES EL (2030 FAIRFAX AVE in CINCINNATI, OH)
(National Center for Education Statistics) - STATE ID-094623 Organizations: CINCINNATI CITY SD (SCHOOL DISTRICT)
Housing units lacking complete plumbing facilities: 7.3%
Housing units lacking complete kitchen facilities: 6.5%
79.8% Utility gas 18.0% Electricity 1.2% Solar energy 0.6% No fuel used
Population in 1990: 8,156. Population change in the 1990s: +1,103 (+13.5%).
Place of birth for U.S.-born residents:
This state: 4,063Northeast: 279Midwest: 498South: 1,177West: 186
50% of the 45207 zip code residents lived in the same house 5 years ago.
Out of people who lived in different houses, 65% lived in this county.
Out of people who lived in different counties, 50% lived in Ohio.
91% of the 45207 zip code residents lived in the same house 1 year ago.
Out of people who lived in different houses, 87% moved from this county.
Out of people who lived in different houses, 7% moved from different county within same state.
Private vs. public school enrollment:
Students in private schools in grades 1 to 8 (elementary and middle school): 30
Students in private schools in grades 9 to 12 (high school): 25
Students in private undergraduate colleges: 1,146
Occupation by median earnings in the past 12 months ($)
91,414 Transportation occupations 68,734 Management occupations 52,463 Health diagnosing and treating practitioners and other technical occupations 48,105 Material moving occupations 46,326 Healthcare support occupations 35,625 Community and social service occupations
Companies with federal contracts located in this zip code (CINCINNATI, OH):
XAVIER UNIVERSITY (3800 VICTORY PARKWAY) in 13 contracts from 2002 to 2006
Contracts for Tuition, Registration, and Membership Fees, Education Services, Books and Pamphlets by Air Force, Department of Veterans AffairsSigned by year: 2000: $0; 2001: $0; 2002: $77,018; 2003: $79,974; 2004: $82,444; 2005: $54,249; 2006: $10,007.
Biggest contracts: with Air Force for Tuition, Registration, and Membership Fees. Signed on 2004-09-20. Completion date: 2004-09-30.
, same as above. Signed on 2005-04-26. Completion date: 2005-09-30.
, same as above. Signed on 2003-11-17. Completion date: 2004-04-30.
, same as above. Signed on 2003-08-11. Completion date: 2003-09-30.
DYNAMIC INDUSTRIES INC (3611 WOODBURN AVE; small business) in 5 contracts from 2001 to 2005
Contracts for Lathes, Grinding Machines, Maintenance, Repair and Rebuilding of Equipment -- Special Industry Machinery, Maintenance, Repair and Rebuilding of Equipment -- Furnace, Steam Plant, and Drying Equipment; and Nuclear Reactors by Defense Logistics Agency, Bureau of ReclamationSigned by year: 2000: $0; 2001: $60,566; 2002: $0; 2003: $0; 2004: $0; 2005: $68,000; 2006: $0.
Biggest contracts: with Defense Logistics Agency for Lathes. Signed on 2005-03-18. Completion date: 2005-05-30.
with Defense Logistics Agency for Grinding Machines. Signed on 2001-02-05. Completion date: 2001-03-05.
with Defense Logistics Agency for Maintenance, Repair and Rebuilding of Equipment -- Special Industry Machinery. Signed on 2001-08-29. Completion date: 2001-11-30.
with Bureau of Reclamation for Maintenance, Repair and Rebuilding of Equipment -- Furnace, Steam Plant, and Drying Equipment; and Nuclear Reactors. Signed on 2005-03-11. Completion date: 2007-10-25.
I T A, INC (2162 DANA AVE; small business) in 4 contracts from 2002 to 2006
$59,796 with Army for Video Recording and Reproducing Equipment. Signed on 2002-09-24. Completion date: 2002-11-29.
with Army for Radio and Television Communication Equipment, Except Airborne. Signed on 2005-09-28. Completion date: 2005-10-31.
with U.S. Army Corps of Engineers - civil program financing only for Radio and Television Communication Equipment, Except Airborne. Signed on 2005-09-28. Completion date: 2005-10-31.
with Air Force for Lease or Rental of Equipment -- Communication, Detection, and Coherent Radiation Equipment. Signed on 2006-03-10. Completion date: 2006-03-30.
XAVIER UNIVERSITY (1624 HERALD AVENUE)
$4,520 with Army for Education Services. Signed on 2003-12-06. Completion date: 2003-12-07.
Top industries in this zip code by the number of employees in 2005:
Educational Services: Colleges, Universities, and Professional Schools (over 1000 employees: 1 establishment)Utilities: Electric Power Distribution (100-249: 1, 50-99: 1, 5-9: 1, 1-4: 2)Information: Wired Telecommunications Carriers (100-249: 1)Accommodation and Food Services: Food Service Contractors (100-249: 1)Administrative and Support and Waste Management and Remediation Services: Temporary Help Services (100-249: 1)Accommodation and Food Services: Limited-Service Restaurants (50-99: 1, 1-4: 2)Construction: New Single-Family Housing Construction (except Operative Builders) (20-49: 1, 5-9: 1, 1-4: 2)Educational Services: Elementary and Secondary Schools (20-49: 1, 1-4: 1)Real Estate and Rental and Leasing: Residential Property Managers (20-49: 1)
People in group quarters in 2010:
1,920 people in college/university student housing
21 people in other noninstitutional facilities
6 people in residential treatment centers for adults
5 people in group homes intended for adults
People in group quarters in 2000:
1,504 people in college dormitories (includes college quarters off campus)
135 people in nursing homes
2 people in religious group quarters
Fatal accident statistics in 2011:
Fatal accident count: 1Vehicles involved in fatal accidents: 3Fatal accidents caused by drunken drivers: 0Fatalities: 1Persons involved in fatal accidents: 4Pedestrians involved in fatal accidents: 0
Home Mortgage Disclosure Act Aggregated Statistics For Year 2009(Based on 4 full and 6 partial tracts) A) FHA, FSA/RHS & VA B) Conventional C) Refinancings D) Home Improvement Loans E) Loans on Dwellings For 5+ Families F) Non-occupant Loans on Number Average Value Number Average Value Number Average Value Number Average Value Number Average Value Number Average Value
LOANS ORIGINATED 13 $110,765 9 $143,239 81 $172,988 11 $37,954 2 $206,550 8 $76,892 APPLICATIONS APPROVED, NOT ACCEPTED 1 $56,020 0 $0 9 $102,360 0 $0 0 $0 0 $0 APPLICATIONS DENIED 14 $60,545 14 $30,681 82 $113,906 20 $23,354 0 $0 28 $35,153 APPLICATIONS WITHDRAWN 2 $77,900 2 $31,960 28 $132,130 4 $30,342 0 $0 11 $60,000 FILES CLOSED FOR INCOMPLETENESS 0 $0 0 $0 10 $153,439 4 $60,910 0 $0 6 $57,252
Aggregated Statistics For Year 2008(Based on 4 full and 6 partial tracts) A) FHA, FSA/RHS & VA B) Conventional C) Refinancings D) Home Improvement Loans E) Loans on Dwellings For 5+ Families F) Non-occupant Loans on G) Loans On Manufactured Number Average Value Number Average Value Number Average Value Number Average Value Number Average Value Number Average Value Number Average Value
LOANS ORIGINATED 11 $123,096 46 $156,229 87 $126,568 13 $42,306 4 $115,258 40 $74,716 0 $0 APPLICATIONS APPROVED, NOT ACCEPTED 3 $122,857 3 $452,857 22 $135,685 2 $37,985 0 $0 4 $78,398 0 $0 APPLICATIONS DENIED 10 $72,962 17 $60,992 130 $84,056 57 $26,453 1 $58,480 58 $62,662 1 $34,900 APPLICATIONS WITHDRAWN 1 $19,810 14 $77,128 36 $94,138 6 $64,853 0 $0 11 $54,435 0 $0 FILES CLOSED FOR INCOMPLETENESS 2 $185,145 4 $67,218 10 $76,073 6 $40,282 0 $0 4 $81,198 0 $0
Aggregated Statistics For Year 2007(Based on 4 full and 6 partial tracts) A) FHA, FSA/RHS & VA B) Conventional C) Refinancings D) Home Improvement Loans E) Loans on Dwellings For 5+ Families F) Non-occupant Loans on Number Average Value Number Average Value Number Average Value Number Average Value Number Average Value Number Average Value
LOANS ORIGINATED 15 $78,034 91 $96,425 153 $93,642 48 $35,729 5 $390,574 106 $76,173 APPLICATIONS APPROVED, NOT ACCEPTED 2 $48,895 15 $83,406 42 $100,354 14 $25,877 0 $0 18 $90,137 APPLICATIONS DENIED 6 $74,343 33 $82,980 239 $86,014 69 $42,339 0 $0 85 $80,718 APPLICATIONS WITHDRAWN 0 $0 13 $80,775 85 $100,311 12 $63,728 0 $0 26 $87,785 FILES CLOSED FOR INCOMPLETENESS 1 $66,260 9 $87,431 13 $139,579 3 $51,507 0 $0 7 $61,681
Aggregated Statistics For Year 2006(Based on 4 full and 6 partial tracts) A) FHA, FSA/RHS & VA B) Conventional C) Refinancings D) Home Improvement Loans E) Loans on Dwellings For 5+ Families F) Non-occupant Loans on G) Loans On Manufactured Number Average Value Number Average Value Number Average Value Number Average Value Number Average Value Number Average Value Number Average Value
LOANS ORIGINATED 13 $89,737 155 $90,009 247 $103,560 51 $39,474 11 $350,097 157 $79,104 1 $47,160 APPLICATIONS APPROVED, NOT ACCEPTED 0 $0 35 $99,113 80 $97,690 7 $25,040 0 $0 42 $79,187 2 $14,970 APPLICATIONS DENIED 1 $140,200 95 $75,715 310 $103,066 99 $36,205 0 $0 126 $103,176 3 $160,273 APPLICATIONS WITHDRAWN 0 $0 43 $85,985 113 $96,236 16 $69,734 0 $0 30 $90,719 0 $0 FILES CLOSED FOR INCOMPLETENESS 0 $0 12 $57,336 35 $108,109 2 $93,880 0 $0 12 $73,812 0 $0
Aggregated Statistics For Year 2005(Based on 4 full and 6 partial tracts) A) FHA, FSA/RHS & VA B) Conventional C) Refinancings D) Home Improvement Loans E) Loans on Dwellings For 5+ Families F) Non-occupant Loans on G) Loans On Manufactured Number Average Value Number Average Value Number Average Value Number Average Value Number Average Value Number Average Value Number Average Value
LOANS ORIGINATED 14 $111,846 226 $81,996 282 $94,374 47 $65,142 8 $1,092,709 233 $72,369 1 $72,890 APPLICATIONS APPROVED, NOT ACCEPTED 4 $79,398 47 $83,127 76 $87,258 8 $51,690 0 $0 37 $93,641 0 $0 APPLICATIONS DENIED 8 $102,534 117 $58,129 386 $90,429 89 $31,050 1 $199,030 125 $83,404 1 $82,060 APPLICATIONS WITHDRAWN 3 $112,953 55 $89,461 140 $106,215 30 $112,791 0 $0 47 $104,074 0 $0 FILES CLOSED FOR INCOMPLETENESS 2 $137,710 10 $73,982 31 $110,429 3 $43,253 0 $0 10 $75,338 0 $0
Aggregated Statistics For Year 2004(Based on 4 full and 6 partial tracts) A) FHA, FSA/RHS & VA B) Conventional C) Refinancings D) Home Improvement Loans E) Loans on Dwellings For 5+ Families F) Non-occupant Loans on Number Average Value Number Average Value Number Average Value Number Average Value Number Average Value Number Average Value
LOANS ORIGINATED 8 $84,749 172 $84,827 296 $98,972 45 $33,161 5 $525,712 159 $73,057 APPLICATIONS APPROVED, NOT ACCEPTED 5 $92,438 45 $70,125 98 $78,008 9 $45,134 2 $139,820 40 $82,312 APPLICATIONS DENIED 3 $130,517 101 $66,883 308 $83,650 77 $23,201 3 $549,923 99 $75,127 APPLICATIONS WITHDRAWN 3 $74,680 35 $94,437 146 $89,319 10 $74,395 0 $0 29 $90,613 FILES CLOSED FOR INCOMPLETENESS 0 $0 7 $65,841 16 $84,742 2 $4,995 0 $0 5 $75,150
Aggregated Statistics For Year 2003(Based on 4 full and 6 partial tracts) A) FHA, FSA/RHS & VA B) Conventional C) Refinancings D) Home Improvement Loans E) Loans on Dwellings For 5+ Families F) Non-occupant Loans on Number Average Value Number Average Value Number Average Value Number Average Value Number Average Value Number Average Value
LOANS ORIGINATED 12 $94,710 98 $111,958 377 $106,024 39 $16,568 6 $177,300 116 $75,982 APPLICATIONS APPROVED, NOT ACCEPTED 0 $0 42 $87,315 105 $79,648 8 $18,824 0 $0 37 $78,026 APPLICATIONS DENIED 8 $96,855 49 $77,167 314 $80,956 70 $21,189 0 $0 64 $79,861 APPLICATIONS WITHDRAWN 1 $47,160 23 $88,981 130 $87,476 8 $45,234 0 $0 28 $73,280 FILES CLOSED FOR INCOMPLETENESS 4 $74,880 11 $80,124 40 $82,241 2 $4,995 0 $0 7 $76,816
Aggregated Statistics For Year 2002(Based on 4 full and 6 partial tracts) A) FHA, FSA/RHS & VA B) Conventional C) Refinancings D) Home Improvement Loans E) Loans on Dwellings For 5+ Families F) Non-occupant Loans on Number Average Value Number Average Value Number Average Value Number Average Value Number Average Value Number Average Value
LOANS ORIGINATED 24 $74,289 150 $84,929 338 $108,350 35 $19,350 11 $323,946 138 $82,243 APPLICATIONS APPROVED, NOT ACCEPTED 2 $61,920 46 $99,698 117 $97,732 6 $19,468 2 $75,840 26 $89,832 APPLICATIONS DENIED 11 $75,281 73 $86,425 334 $76,795 78 $13,115 0 $0 70 $86,695 APPLICATIONS WITHDRAWN 0 $0 35 $71,818 142 $77,284 6 $26,128 0 $0 22 $71,767 FILES CLOSED FOR INCOMPLETENESS 0 $0 23 $71,470 37 $81,781 5 $18,178 0 $0 15 $68,608
Aggregated Statistics For Year 2001(Based on 4 full and 6 partial tracts) A) FHA, FSA/RHS & VA B) Conventional C) Refinancings D) Home Improvement Loans E) Loans on Dwellings For 5+ Families F) Non-occupant Loans on Number Average Value Number Average Value Number Average Value Number Average Value Number Average Value Number Average Value
LOANS ORIGINATED 43 $88,362 134 $78,752 334 $92,063 42 $19,001 8 $144,650 121 $69,989 APPLICATIONS APPROVED, NOT ACCEPTED 6 $68,910 20 $59,605 140 $73,437 17 $23,985 6 $180,130 26 $54,616 APPLICATIONS DENIED 9 $81,693 67 $75,245 374 $67,546 101 $13,700 2 $222,710 37 $73,594 APPLICATIONS WITHDRAWN 0 $0 19 $40,441 220 $73,975 17 $31,236 0 $0 27 $73,929 FILES CLOSED FOR INCOMPLETENESS 3 $68,153 3 $67,263 37 $74,489 4 $43,442 0 $0 11 $97,581
Aggregated Statistics For Year 2000(Based on 4 full and 6 partial tracts) A) FHA, FSA/RHS & VA B) Conventional C) Refinancings D) Home Improvement Loans E) Loans on Dwellings For 5+ Families F) Non-occupant Loans on Number Average Value Number Average Value Number Average Value Number Average Value Number Average Value Number Average Value
LOANS ORIGINATED 32 $73,502 129 $70,473 244 $66,079 62 $13,347 3 $72,243 77 $65,391 APPLICATIONS APPROVED, NOT ACCEPTED 3 $80,800 26 $68,045 90 $65,178 29 $10,947 1 $52,820 17 $73,524 APPLICATIONS DENIED 7 $64,580 90 $68,372 343 $66,810 165 $10,804 5 $275,802 51 $73,690 APPLICATIONS WITHDRAWN 8 $56,028 34 $75,855 104 $65,025 10 $19,319 6 $165,652 13 $68,218 FILES CLOSED FOR INCOMPLETENESS 6 $59,208 10 $59,037 49 $69,397 4 $3,995 2 $184,610 6 $61,155
Aggregated Statistics For Year 1999(Based on 2 full and 3 partial tracts) A) FHA, FSA/RHS & VA B) Conventional C) Refinancings D) Home Improvement Loans E) Loans on Dwellings For 5+ Families F) Non-occupant Loans on Number Average Value Number Average Value Number Average Value Number Average Value Number Average Value Number Average Value
LOANS ORIGINATED 14 $73,224 68 $75,354 164 $70,558 54 $12,037 1 $486,020 46 $60,080 APPLICATIONS APPROVED, NOT ACCEPTED 4 $47,115 13 $60,890 90 $61,424 10 $7,497 0 $0 17 $67,763 APPLICATIONS DENIED 4 $55,015 31 $64,843 164 $63,823 106 $10,544 0 $0 22 $65,613 APPLICATIONS WITHDRAWN 4 $66,440 15 $88,533 84 $61,156 3 $39,237 1 $93,770 7 $54,157 FILES CLOSED FOR INCOMPLETENESS 0 $0 8 $66,872 28 $59,334 1 $11,660 0 $0 3 $46,527
Private Mortgage Insurance Companies Aggregated Statistics For Year 2009(Based on 4 full and 4 partial tracts) A) Conventional Number Average Value
LOANS ORIGINATED 3 $121,043 APPLICATIONS APPROVED, NOT ACCEPTED 5 $115,678 APPLICATIONS DENIED 2 $43,910 APPLICATIONS WITHDRAWN 1 $100,920 FILES CLOSED FOR INCOMPLETENESS 0 $0
Aggregated Statistics For Year 2008(Based on 4 full and 6 partial tracts) A) Conventional B) Refinancings C) Non-occupant Loans on Number Average Value Number Average Value Number Average Value
LOANS ORIGINATED 16 $102,611 6 $84,673 9 $59,268 APPLICATIONS APPROVED, NOT ACCEPTED 6 $108,820 1 $87,720 1 $65,080 APPLICATIONS DENIED 1 $18,670 0 $0 1 $18,670 APPLICATIONS WITHDRAWN 1 $41,500 0 $0 1 $41,500 FILES CLOSED FOR INCOMPLETENESS 0 $0 0 $0 0 $0
Aggregated Statistics For Year 2007(Based on 4 full and 6 partial tracts) A) Conventional B) Refinancings C) Non-occupant Loans on Number Average Value Number Average Value Number Average Value
LOANS ORIGINATED 29 $83,568 14 $101,386 7 $65,064 APPLICATIONS APPROVED, NOT ACCEPTED 2 $83,515 3 $186,567 1 $116,990 APPLICATIONS DENIED 0 $0 0 $0 0 $0 APPLICATIONS WITHDRAWN 6 $151,382 1 $143,370 2 $49,895 FILES CLOSED FOR INCOMPLETENESS 0 $0 0 $0 0 $0
Aggregated Statistics For Year 2006(Based on 4 full and 6 partial tracts) A) Conventional B) Refinancings C) Non-occupant Loans on Number Average Value Number Average Value Number Average Value
LOANS ORIGINATED 28 $83,697 11 $108,136 19 $65,575 APPLICATIONS APPROVED, NOT ACCEPTED 3 $43,313 11 $104,646 4 $82,245 APPLICATIONS DENIED 2 $108,470 0 $0 0 $0 APPLICATIONS WITHDRAWN 2 $81,830 0 $0 0 $0 FILES CLOSED FOR INCOMPLETENESS 0 $0 0 $0 0 $0
Aggregated Statistics For Year 2005(Based on 4 full and 6 partial tracts) A) Conventional B) Refinancings C) Non-occupant Loans on Number Average Value Number Average Value Number Average Value
LOANS ORIGINATED 21 $81,192 13 $129,808 15 $68,012 APPLICATIONS APPROVED, NOT ACCEPTED 8 $67,295 2 $81,400 5 $48,714 APPLICATIONS DENIED 0 $0 0 $0 0 $0 APPLICATIONS WITHDRAWN 2 $93,835 1 $53,610 1 $66,810 FILES CLOSED FOR INCOMPLETENESS 0 $0 0 $0 0 $0
Aggregated Statistics For Year 2004(Based on 4 full and 6 partial tracts) A) Conventional B) Refinancings C) Non-occupant Loans on Number Average Value Number Average Value Number Average Value
LOANS ORIGINATED 36 $76,482 18 $98,452 22 $61,555 APPLICATIONS APPROVED, NOT ACCEPTED 8 $125,844 8 $85,294 8 $59,198 APPLICATIONS DENIED 2 $76,900 0 $0 2 $76,900 APPLICATIONS WITHDRAWN 4 $82,738 3 $88,593 2 $40,560 FILES CLOSED FOR INCOMPLETENESS 0 $0 0 $0 0 $0
Aggregated Statistics For Year 2003(Based on 4 full and 6 partial tracts) A) Conventional B) Refinancings C) Non-occupant Loans on Number Average Value Number Average Value Number Average Value
LOANS ORIGINATED 20 $109,534 15 $76,169 7 $61,637 APPLICATIONS APPROVED, NOT ACCEPTED 11 $88,365 11 $102,225 1 $52,820 APPLICATIONS DENIED 1 $38,670 0 $0 0 $0 APPLICATIONS WITHDRAWN 2 $90,810 0 $0 0 $0 FILES CLOSED FOR INCOMPLETENESS 1 $42,440 1 $73,570 1 $42,440
Aggregated Statistics For Year 2002(Based on 4 full and 6 partial tracts) A) Conventional B) Refinancings C) Non-occupant Loans on Number Average Value Number Average Value Number Average Value
LOANS ORIGINATED 37 $88,697 29 $86,921 27 $75,880 APPLICATIONS APPROVED, NOT ACCEPTED 14 $97,424 16 $71,662 12 $73,968 APPLICATIONS DENIED 0 $0 4 $81,358 2 $70,910 APPLICATIONS WITHDRAWN 10 $80,826 2 $123,585 8 $81,610 FILES CLOSED FOR INCOMPLETENESS 1 $52,410 0 $0 0 $0
Aggregated Statistics For Year 2001(Based on 4 full and 6 partial tracts) A) Conventional B) Refinancings C) Non-occupant Loans on Number Average Value Number Average Value Number Average Value
LOANS ORIGINATED 33 $63,459 14 $79,997 14 $59,852 APPLICATIONS APPROVED, NOT ACCEPTED 10 $112,129 8 $87,241 2 $76,900 APPLICATIONS DENIED 5 $88,254 9 $80,660 4 $101,920 APPLICATIONS WITHDRAWN 0 $0 1 $87,720 0 $0 FILES CLOSED FOR INCOMPLETENESS 2 $107,350 0 $0 0 $0
Aggregated Statistics For Year 2000(Based on 4 full and 6 partial tracts) A) Conventional B) Refinancings C) Non-occupant Loans on Number Average Value Number Average Value Number Average Value
LOANS ORIGINATED 31 $77,510 19 $73,600 12 $68,908 APPLICATIONS APPROVED, NOT ACCEPTED 3 $51,970 2 $60,870 3 $51,970 APPLICATIONS DENIED 2 $98,110 0 $0 2 $98,110 APPLICATIONS WITHDRAWN 5 $102,248 0 $0 0 $0 FILES CLOSED FOR INCOMPLETENESS 1 $40,360 0 $0 0 $0
Aggregated Statistics For Year 1999(Based on 2 full and 3 partial tracts) A) Conventional B) Refinancings C) Non-occupant Loans on Number Average Value Number Average Value Number Average Value
LOANS ORIGINATED 11 $88,293 7 $73,563 2 $40,380 APPLICATIONS APPROVED, NOT ACCEPTED 2 $35,905 0 $0 0 $0 APPLICATIONS DENIED 1 $66,410 0 $0 1 $31,900 APPLICATIONS WITHDRAWN 1 $71,830 0 $0 0 $0 FILES CLOSED FOR INCOMPLETENESS 0 $0 0 $0 0 $0
2002 - 2018 National Fire Incident Reporting System (NFIRS) incidents See full 2006 National Fire Incident Reporting System statistics for zip code 45207, Ohio
Most common first names in zip code 45207 among deceased individuals Name Count Lived (average)
James 104 71.3 years John 94 75.0 years Mary 90 74.8 years William 83 74.8 years Robert 58 71.5 years Willie 51 73.3 years George 45 77.5 years Charles 41 73.4 years Elizabeth 31 81.1 years Joseph 29 76.8 years
Most common last names in zip code 45207 among deceased individuals Last name Count Lived (average)
Johnson 72 74.4 years Williams 64 74.3 years Smith 60 74.3 years Jackson 45 73.0 years Jones 41 74.6 years Brown 35 73.7 years Davis 31 71.0 years Harris 27 70.1 years Thomas 26 72.0 years Robinson 23 73.1 years
Businesses in zip code 45207

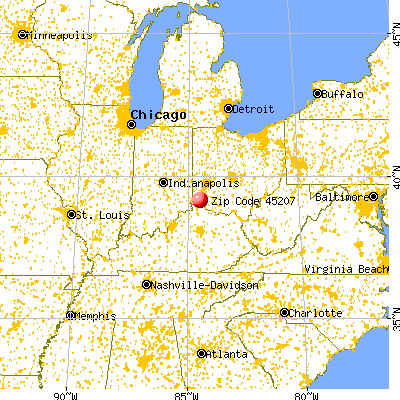

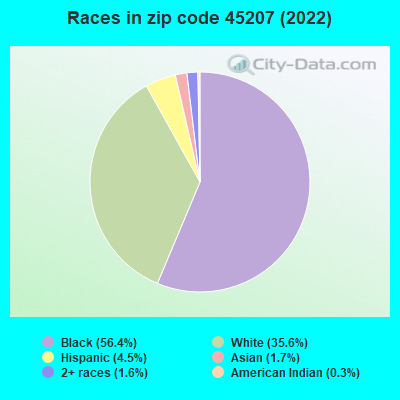


 Nearest zip codes: 45229, 45206, 45212, 41074, 45217, 45208.
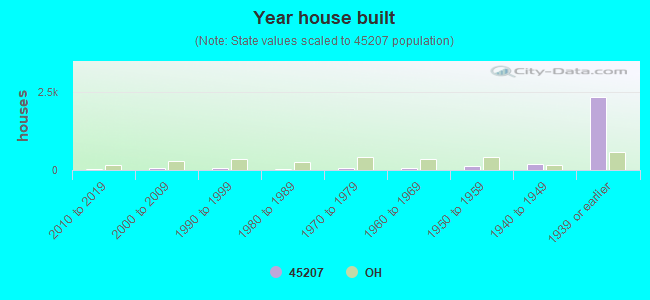
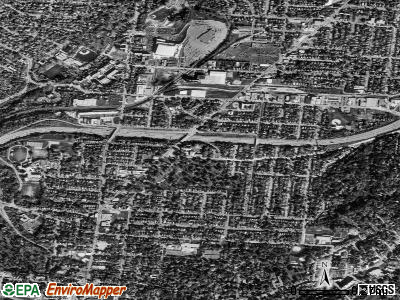
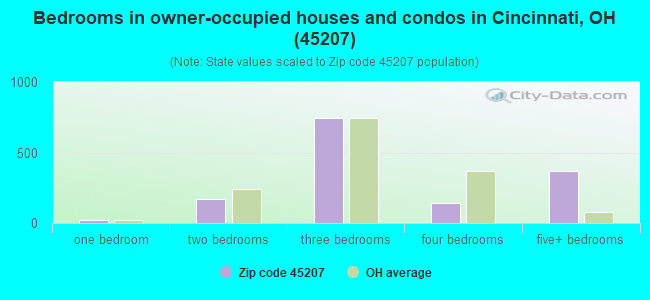
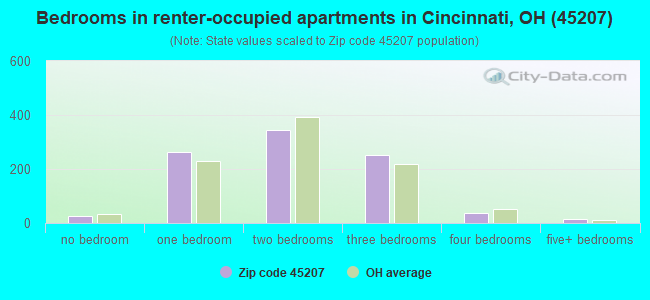
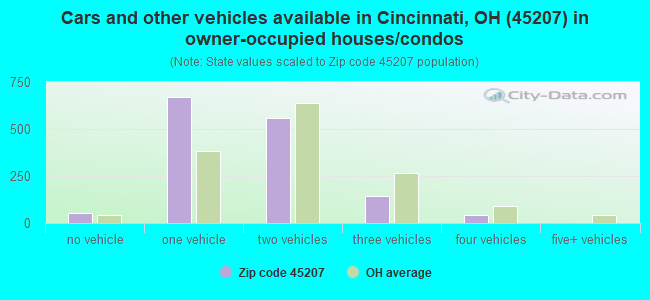
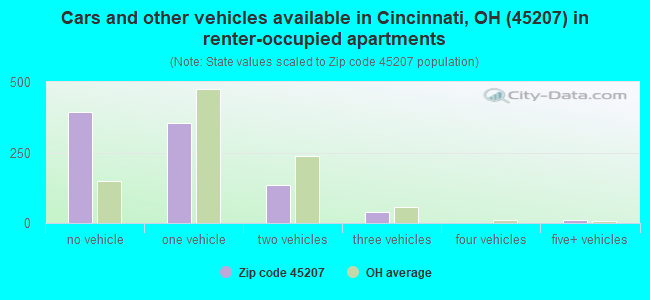


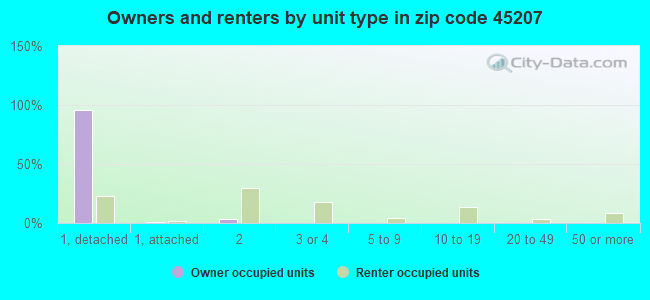
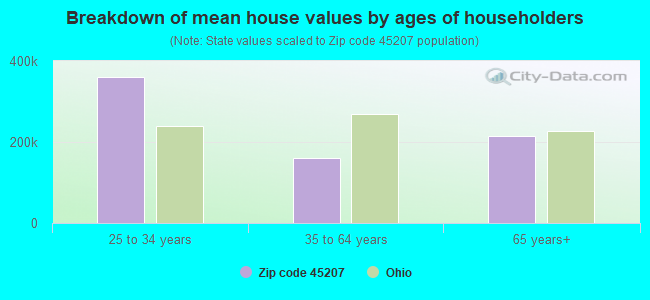


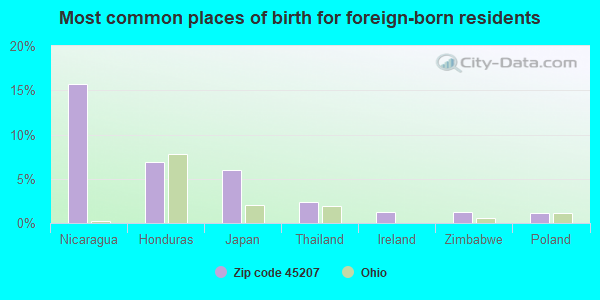
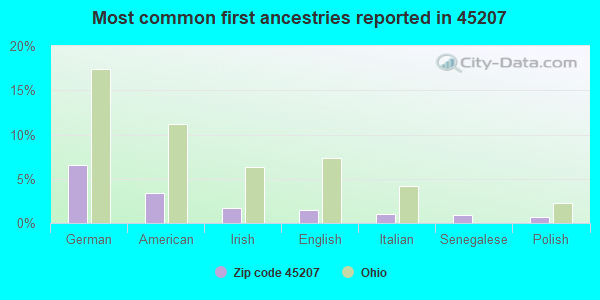
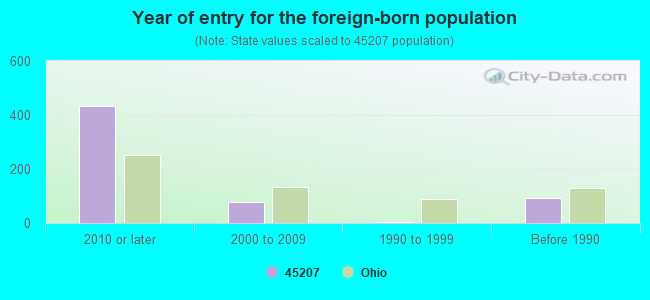


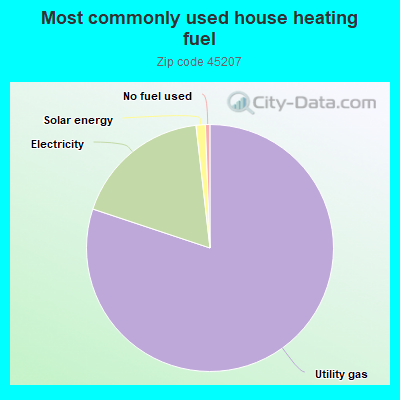
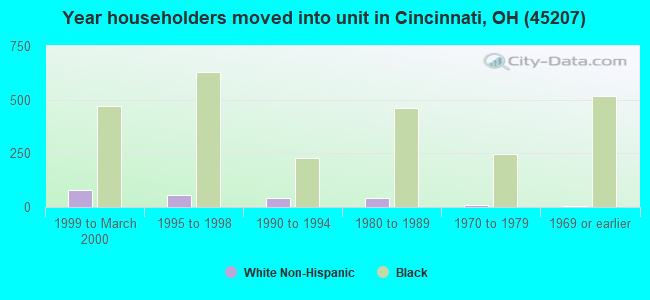
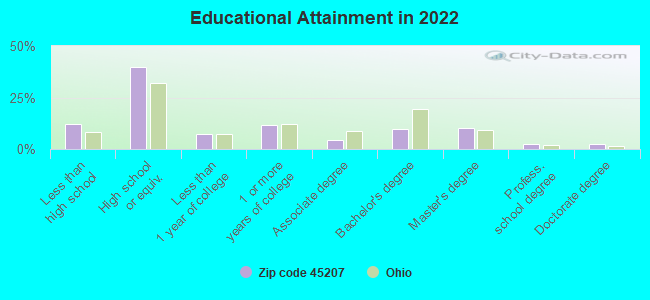
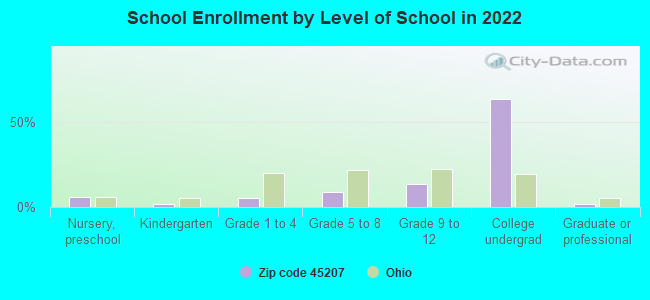
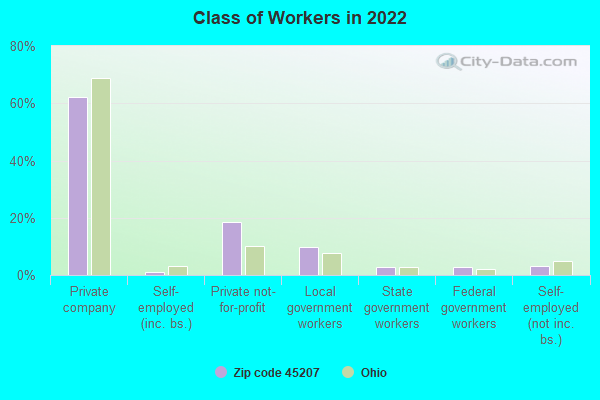
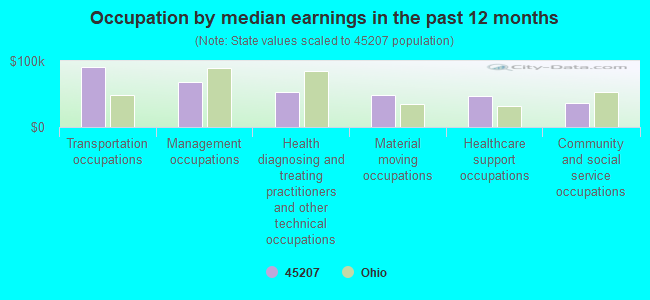
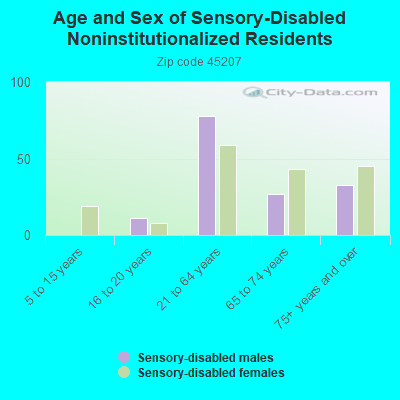
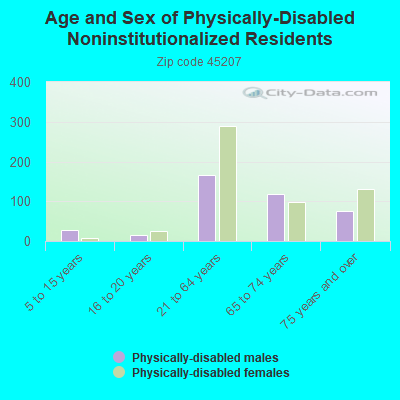
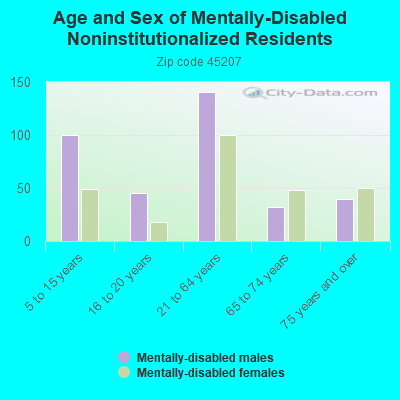
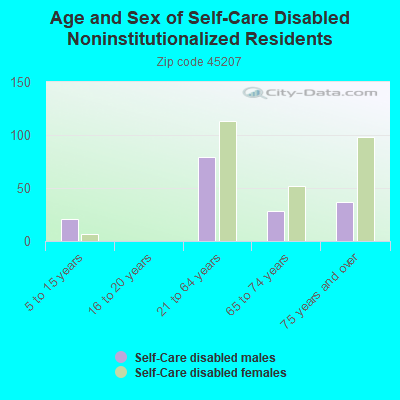
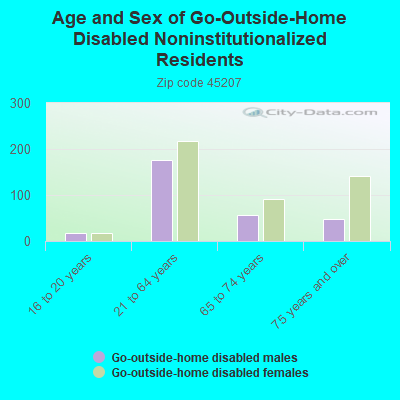
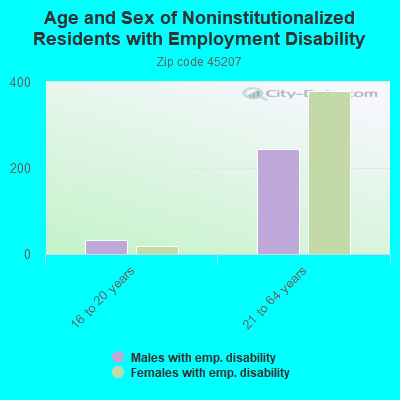
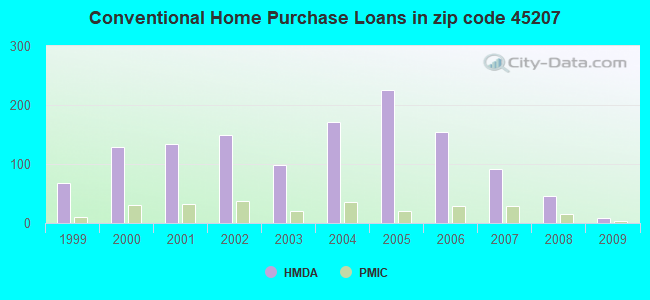
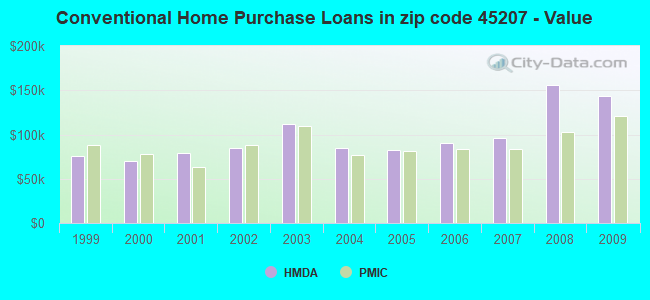
 Based on the data from the years 2002 - 2018 the average number of fire incidents per year is 16. The highest number of reported fires - 25 took place in 2010, and the least - 7 in 2008. The data has a dropping trend.
 When looking into fire subcategories, the most reports belonged to: Structure Fires (44.9%), and Other (18.9%).