Averages for the 2020 tax year for zip code 45229, filed in 2021:
Average Adjusted Gross Income (AGI) in 2020: $47,271 (Individual Income Tax Returns)
Here:
$47,271
State:
$67,288
Salary/wage: $38,902 (reported on 84.4% of returns)
Here:
$38,902
State:
$55,628
(% of AGI for various income ranges: 1067.6% for AGIs below $25k, 3424.4% for AGIs $25k-50k, 6946.3% for AGIs $50k-75k, 9885.7% for AGIs $75k-100k, 20058.1% for AGIs $100k-200k, 74763.3% for AGIs over 200k)
Taxable interest for individuals: $951 (reported on 14.1% of returns)
This zip code:
$951
Ohio:
$1,518
(% of AGI for various income ranges: 2.8% for AGIs below $25k, 3.9% for AGIs $25k-50k, 28.3% for AGIs $50k-75k, 27.9% for AGIs $75k-100k, 100.0% for AGIs $100k-200k, 548.3% for AGIs over 200k)
Ordinary dividends: $7,585 (reported on 11.3% of returns)
Here:
$7,585
State:
$7,167
(% of AGI for various income ranges: 5.6% for AGIs below $25k, 13.2% for AGIs $25k-50k, 44.0% for AGIs $50k-75k, 263.6% for AGIs $75k-100k, 605.6% for AGIs $100k-200k, 4788.3% for AGIs over 200k)
Net capital gain/loss in AGI: +$14,284 (reported on 9.5% of returns)
Here:
+$14,284
State:
+$18,919
(% of AGI for various income ranges: 2.9% for AGIs below $25k, 15.4% for AGIs $25k-50k, 69.7% for AGIs $50k-75k, 283.6% for AGIs $75k-100k, 833.8% for AGIs $100k-200k, 8490.0% for AGIs over 200k)
Profit/loss from business: +$10,228 (reported on 15.4% of returns)
Here:
+$10,228
State:
+$13,744
(% of AGI for various income ranges: 95.0% for AGIs below $25k, 71.2% for AGIs $25k-50k, 391.3% for AGIs $50k-75k, 469.3% for AGIs $75k-100k, 740.0% for AGIs $100k-200k, 4175.0% for AGIs over 200k)
Taxable individual retirement arrangement distribution: $21,067 (reported on 4.5% of returns)
45229:
$21,067
Ohio:
$18,876
(% of AGI for various income ranges: 6.7% for AGIs below $25k, 37.5% for AGIs $25k-50k, 147.7% for AGIs $50k-75k, 612.9% for AGIs $75k-100k, 1091.2% for AGIs $100k-200k, 2336.7% for AGIs over 200k)
Self-employed (Keogh) retirement plans: $18,150 (reported on 0.4% of returns)
45229:
$18,150
Ohio:
$24,898
(% of AGI for various income ranges: 121.0% for AGIs $50k-75k)
Total itemized deductions: $29,913 (reported on 5.6% of returns)
Here:
$29,913
State:
$33,869
(% of AGI for various income ranges: 51.9% for AGIs $25k-50k, 263.3% for AGIs $50k-75k, 860.7% for AGIs $75k-100k, 1515.0% for AGIs $100k-200k, 6536.7% for AGIs over 200k)
Charity contributions: $13,446 (reported on 4.5% of returns)
Here:
$13,446
State:
$14,577
(% of AGI for various income ranges: 100.7% for AGIs $50k-75k, 195.7% for AGIs $75k-100k, 413.1% for AGIs $100k-200k, 3316.7% for AGIs over 200k)
Taxes paid: $7,600 (reported on 5.6% of returns)
45229:
$7,600
State:
$7,681
(% of AGI for various income ranges: 10.7% for AGIs $25k-50k, 71.7% for AGIs $50k-75k, 278.6% for AGIs $75k-100k, 471.9% for AGIs $100k-200k, 1316.7% for AGIs over 200k)
Earned income credit: $2,508 (reported on 34.5% of returns)
Here:
$2,508
State:
$2,304
(% of AGI for various income ranges: 158.6% for AGIs below $25k, 95.0% for AGIs $25k-50k)
Percentage of individuals using paid preparers for their 2020 taxes: 92.4%
Here:
92%
State:
94%
(% for various income ranges: 93.3% for AGIs below $25k, 93.2% for AGIs $25k-50k, 89.4% for AGIs $50k-75k, 88.0% for AGIs $75k-100k, 90.9% for AGIs $100k-200k, 88.9% for AGIs over 200k)
Averages for the 2012 tax year for zip code 45229, filed in 2013:
Average Adjusted Gross Income (AGI) in 2012: $39,703 (Individual Income Tax Returns)
Here:
$39,703
State:
$54,926
Salary/wage: $33,397 (reported on 83.0% of returns)
Here:
$33,397
State:
$45,869
(% of AGI for various income ranges: 76.0% for AGIs below $25k, 80.9% for AGIs $25k-50k, 71.4% for AGIs $50k-75k, 61.6% for AGIs $75k-100k, 66.2% for AGIs $100k-200k, 62.1% for AGIs over 200k)
Taxable interest for individuals: $966 (reported on 15.6% of returns)
This zip code:
$966
Ohio:
$1,297
(% of AGI for various income ranges: 0.2% for AGIs below $25k, 0.3% for AGIs $25k-50k, 0.2% for AGIs $50k-75k, 0.2% for AGIs $75k-100k, 0.4% for AGIs $100k-200k, 0.7% for AGIs over 200k)
Ordinary dividends: $5,009 (reported on 13.0% of returns)
Here:
$5,009
State:
$5,821
(% of AGI for various income ranges: 0.9% for AGIs below $25k, 0.7% for AGIs $25k-50k, 1.5% for AGIs $50k-75k, 1.7% for AGIs $75k-100k, 2.0% for AGIs $100k-200k, 2.6% for AGIs over 200k)
Net capital gain/loss in AGI: +$7,730 (reported on 8.5% of returns)
Here:
+$7,730
State:
+$11,232
(% of AGI for various income ranges: 0.2% for AGIs below $25k, 0.2% for AGIs $25k-50k, 0.3% for AGIs $50k-75k, 0.8% for AGIs $75k-100k, 2.6% for AGIs $100k-200k, 3.9% for AGIs over 200k)
Profit/loss from business: +$11,478 (reported on 16.8% of returns)
Here:
+$11,478
State:
+$12,773
(% of AGI for various income ranges: 12.3% for AGIs below $25k, 1.9% for AGIs $25k-50k, 2.3% for AGIs $50k-75k, 3.1% for AGIs $75k-100k, 5.2% for AGIs $100k-200k, 3.2% for AGIs over 200k)
Taxable individual retirement arrangement distribution: $19,725 (reported on 5.5% of returns)
45229:
$19,725
Ohio:
$14,511
(% of AGI for various income ranges: 0.8% for AGIs below $25k, 1.1% for AGIs $25k-50k, 2.4% for AGIs $50k-75k, 4.4% for AGIs $75k-100k, 4.9% for AGIs $100k-200k, 3.5% for AGIs over 200k)
Self-employment retirement plans: $15,833 (reported on 0.6% of returns)
45229:
$15,833
Ohio:
$20,257
(% of AGI for various income ranges: 1.3% for AGIs $100k-200k)
Total itemized deductions: $23,261 (19% of AGI, reported on 19.4% of returns)
Here:
$23,261
State:
$21,278
Here:
19.5% of AGI
State:
18.8% of AGI
(% of AGI for various income ranges: 3.5% for AGIs below $25k, 6.3% for AGIs $25k-50k, 14.6% for AGIs $50k-75k, 15.3% for AGIs $75k-100k, 16.9% for AGIs $100k-200k, 13.9% for AGIs over 200k)
Charity contributions: $5,433 (reported on 16.4% of returns)
Here:
$5,433
State:
$3,943
(% of AGI for various income ranges: 0.3% for AGIs below $25k, 1.2% for AGIs $25k-50k, 2.9% for AGIs $50k-75k, 3.3% for AGIs $75k-100k, 2.8% for AGIs $100k-200k, 3.3% for AGIs over 200k)
Taxes paid: $10,125 (reported on 19.2% of returns)
45229:
$10,125
State:
$9,568
(% of AGI for various income ranges: 0.8% for AGIs below $25k, 1.8% for AGIs $25k-50k, 4.9% for AGIs $50k-75k, 5.7% for AGIs $75k-100k, 7.7% for AGIs $100k-200k, 7.8% for AGIs over 200k)
Earned income credit: $2,627 (reported on 40.5% of returns)
Here:
$2,627
State:
$2,285
(% of AGI for various income ranges: 13.3% for AGIs below $25k, 1.4% for AGIs $25k-50k)
Percentage of individuals using paid preparers for their 2012 taxes: 41.1%
Here:
41%
State:
51%
(% for various income ranges: 36.7% for AGIs below $25k, 41.9% for AGIs $25k-50k, 51.4% for AGIs $50k-75k, 47.4% for AGIs $75k-100k, 55.6% for AGIs $100k-200k, 69.2% for AGIs over 200k)
Averages for the 2004 tax year for zip code 45229, filed in 2005:
Average Adjusted Gross Income (AGI) in 2004: $32,315 (Individual Income Tax Returns)
Here:
$32,315
State:
$44,480
Salary/wage: $28,467 (reported on 88.2% of returns)
Here:
$28,467
State:
$39,198
(% of AGI for various income ranges: 94.8% for AGIs below $10k, 84.1% for AGIs $10k-25k, 86.0% for AGIs $25k-50k, 75.4% for AGIs $50k-75k, 75.6% for AGIs $75k-100k, 68.7% for AGIs over 100k)
Taxable interest for individuals: $1,225 (reported on 21.4% of returns)
This zip code:
$1,225
Ohio:
$1,532
(% of AGI for various income ranges: 0.8% for AGIs below $10k, 0.4% for AGIs $10k-25k, 0.2% for AGIs $25k-50k, 0.7% for AGIs $50k-75k, 0.8% for AGIs $75k-100k, 1.4% for AGIs over 100k)
Taxable dividends: $4,579 (reported on 13.1% of returns)
Here:
$4,579
State:
$3,496
(% of AGI for various income ranges: 0.9% for AGIs below $10k, 0.4% for AGIs $10k-25k, 0.6% for AGIs $25k-50k, 1.5% for AGIs $50k-75k, 1.5% for AGIs $75k-100k, 3.7% for AGIs over 100k)
Net capital gain/loss: +$7,319 (reported on 9.4% of returns)
Here:
+$7,319
State:
+$8,582
(% of AGI for various income ranges: -0.4% for AGIs below $10k, 0.1% for AGIs $10k-25k, 0.2% for AGIs $25k-50k, 0.8% for AGIs $50k-75k, 0.8% for AGIs $75k-100k, 5.4% for AGIs over 100k)
Profit/loss from business: +$10,301 (reported on 11.3% of returns)
Here:
+$10,301
State:
+$10,813
(% of AGI for various income ranges: 7.9% for AGIs below $10k, 3.4% for AGIs $10k-25k, 0.9% for AGIs $25k-50k, 3.4% for AGIs $50k-75k, 2.4% for AGIs $75k-100k, 5.1% for AGIs over 100k)
IRA payment deduction: $1,655 (reported on 1.0% of returns)
45229:
$1,655
Ohio:
$2,794
Self-employed pension: $15,705 (reported on 0.7% of returns)
Here:
$15,705
Ohio:
$13,981
Total itemized deductions: $20,921 (22% of AGI, reported on 19.9% of returns)
Here:
$20,921
State:
$17,503
Here:
22.4% of AGI
State:
20.8% of AGI
(% of AGI for various income ranges: 4.0% for AGIs below $10k, 3.6% for AGIs $10k-25k, 9.5% for AGIs $25k-50k, 18.2% for AGIs $50k-75k, 19.7% for AGIs $75k-100k, 17.3% for AGIs over 100k)
Charity contributions deductions: $4,929 (5% of AGI, reported on 17.8% of returns)
Here:
$4,929
State:
$3,087
Here:
5.0% of AGI
State:
3.4% of AGI
(% of AGI for various income ranges: 0.4% for AGIs below $10k, 0.7% for AGIs $10k-25k, 1.7% for AGIs $25k-50k, 3.8% for AGIs $50k-75k, 3.3% for AGIs $75k-100k, 4.1% for AGIs over 100k)
Total tax: $6,443 (reported on 56.9% of returns)
45229:
$6,443
State:
$6,781
(% of AGI for various income ranges: 2.0% for AGIs below $10k, 3.2% for AGIs $10k-25k, 6.8% for AGIs $25k-50k, 10.8% for AGIs $50k-75k, 11.7% for AGIs $75k-100k, 19.5% for AGIs over 100k)
Earned income credit: $2,073 (reported on 39.2% of returns)
Here:
$2,073
State:
$1,696
Percentage of individuals using paid preparers for their 2004 taxes: 59.4%
Here:
59%
State:
55%
(% for various income ranges: 57.1% for AGIs below $10k, 64.5% for AGIs $10k-25k, 54.0% for AGIs $25k-50k, 59.3% for AGIs $50k-75k, 55.0% for AGIs $75k-100k, 61.3% for AGIs over 100k)
Likely homosexual households (counted as self-reported same-sex unmarried-partner households)
Lesbian couples: 0.1% of all households
Gay men: 0.0% of all households
Household received Food Stamps/SNAP in the past 12 months: 2,112 Household did not receive Food Stamps/SNAP in the past 12 months: 4,463
Women who had a birth in the past 12 months: 43 (23 now married, 19 unmarried) Women who did not have a birth in the past 12 months: 3,046 (354 now married, 2,694 unmarried)
Housing units in zip code 45229 with a mortgage: 1,265 (368 second mortgage, 336 both second mortgage and home equity loan) Houses without a mortgage: 4
Median monthly owner costs for units with a mortgage: $1,959 Median monthly owner costs for units without a mortgage: $971
Residents with income below the poverty level in 2022:
This zip code:
39.4%
Whole state:
13.4%
Residents with income below 50% of the poverty level in 2022:
This zip code:
14.9%
Whole state:
7.0%
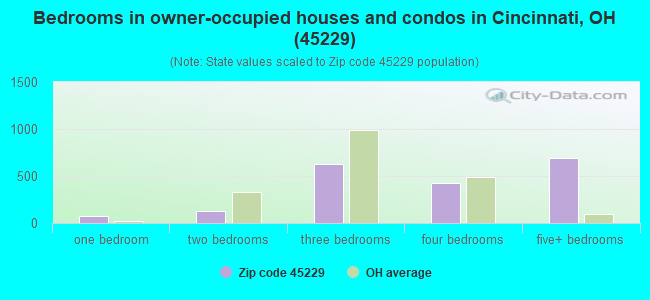
Median number of rooms in houses and condos:
Here:
8.1
State:
6.7
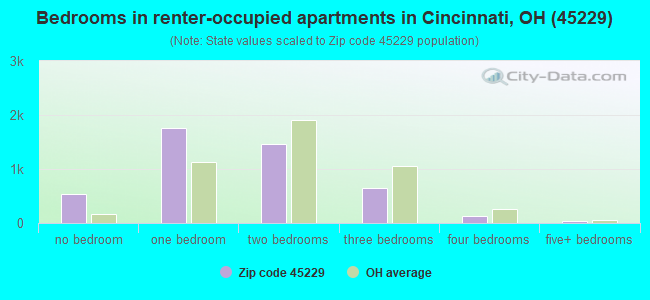
Median number of rooms in apartments:
Here:
3.8
State:
4.4
Notable locations in this zip code not listed on our city pages
Notable locations in zip code 45229: Jewish Community Center (A), Sycamore Hall (B), Schmidt Memorial Fieldhouse (C), Saint Barbara Hall (D), O'Connor Sports Center (E), Joseph Building (F), Elet Hall (G), Corbett Physical Education Building (H), Logan Hall (I), Cincinnati Fire Department Engine and Truck 32 (J), Cincinnati Fire Department Engine and Truck 9 (K), Shriners Hospital for Children (L), Number 32 Engine Company (M), Number 9 Engine Company (N), East Campus Power Plant (O), Cincinnati Home for Aged Men (P), Rescue Temple Community Center (Q), Orthodox Jewish Home for the Aged (R), Leshner Library (S). Display/hide their locations on the map
Churches in zip code 45229 include: New Friendship Baptist Church (A), Carmel Presbyterian Church (B), Southern Baptist Church (C), Immanuel Lutheran Church (D), Peace Baptist Church (E), Faith Temple Church of God (F), Christ Temple Baptist Church (G), Saint John African Methodist Episcopal Zion Church (H), Church of the Living God (I). Display/hide their locations on the map
Parks in zip code 45229 include: Stella Park (1), M L King Junior Park (2), Avon Field (3), Woodward Park (4), Seasongoer Square (5), Corcoran Field (6), Hayden Field (7), Mitchell Triangle (8), Fleischmann Gardens (9). Display/hide their locations on the map
In group quarters: 339 (-1 institutionalized population)
Size of family households: 1,516 2-persons, 534 3-persons, 179 4-persons, 251 5-persons, 51 6-persons, 88 7-or-more-persons
Size of nonfamily households: 3,251 1-person, 419 2-persons, 303 3-persons
361 married couples with children.
1,384 single-parent households (220 men, 1,164 women).
92.6% of residents of 45229 zip code speak English at home.
5.5% of residents speak Spanish at home (50% very well, 23% well, 21% not well, 6% not at all).
1.7% of residents speak other Indo-European language at home (85% very well, 15% well).
0.6% of residents speak Asian or Pacific Island language at home (100% very well).
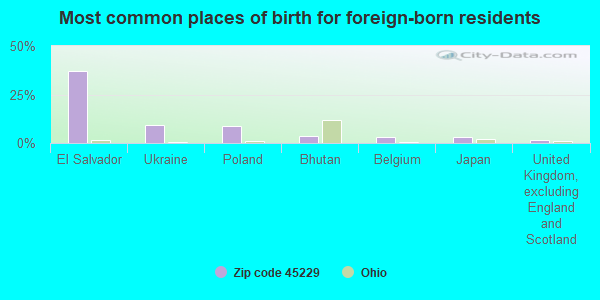
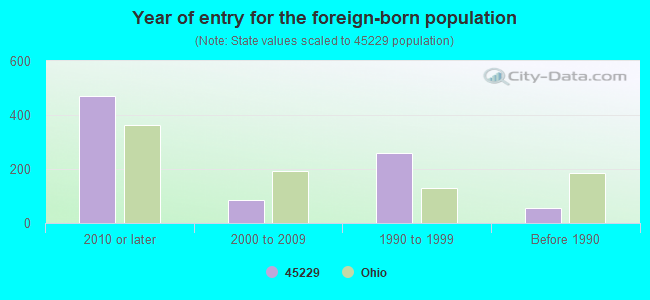
Foreign born population: 731 (5.4%) (37.5% of them are naturalized citizens)
Facilities with environmental interests located in this zip code:
BP EXPLORATION & OIL INC CINCINNATI TERMINAL * (930 TENNESSEE AVENUE in CINCINNATI, OH)
AIR SYNTHETIC MINOR (AIRS/AFS) OIL CONTROL (Facility Response Plan for oil discharge) (Integrated Compliance Information System) - ICIS-05-1979-0022, FORMAL ENFORCEMENT ACTION, ICIS-05-1996-0567, CRITERIA AND HAZARDOUS AIR POLLUTANT INVENTORY (Inventory of air pollution sources) STATE MASTER (Ohio general info) - PCS-OH0092690, National Pollutant Discharge Elimination System Permit, RCRA-OHD074723099, HAZARDOUS WASTE PROGRAM, AIR MAJOR, EPCRA, TRIS-45229BPXPL930TE, TRI REPORTER STATE MASTER (Ohio general info) - -09-5541-659-3, EPCRA STATE MASTER (Ohio general info) - EPCRA HAZARDOUS WASTE BIENNIAL REPORTER (Resource Conservation and Recovery Act (tracking hazardous waste)) Small Quantity Generators, between 100 kg and 1000 kg of hazardous waste/month (Resource Conservation and Recovery Act (tracking hazardous waste)) TRI REPORTER (Tracking of toxic chemicals releasing facilities) Business SIC classification: PETROLEUM BULK STATIONS AND TERMINALS; PETROLEUM AND PETROLEUM PRODUCTS WHOLESALERS, EXCEPT BULK STATIONS AND TERMINALS Organizations: BP PRODUCTS NORTH AMERICA, INC. (CONTACT/GENERAL)
, BP NORTH AMERICA PRODUCTS INC (CONTACT/OPERATOR)
Alternative names: B P OIL, B P OIL CO - CINCINNATI TERMINAL, B.P. OIL CO./CINTI. TERMINAL, BP OIL COMPANY, BP OIL CO NO 00417 *, BP OIL CO NO 09212 *, BP OIL CO TERMINAL, BP PRODUCTS NORTH AMERICA INCORPORATED, BP PRODUCTS NORTH AMERICA, INC, CINCINNATI TERMINAL
BOND HILL CLEANERS (4517 READING RD in CINCINNATI, OH)
AIR MINOR (AIRS/AFS) STATE MASTER (Ohio general info) - AIR MAJOR Small Quantity Generators, between 100 kg and 1000 kg of hazardous waste/month (Resource Conservation and Recovery Act (tracking hazardous waste)) - notification Business SIC classification: DRYCLEANING PLANTS, EXCEPT RUG CLEANING Organizations: GRIMES DON (CONTACT/OWNER)
Alternative names: BOND HILLS CLEANERS
ARMOR SHIELD INC (3141 READING RD in CINCINNATI, OH)
STATE MASTER (Ohio general info) - AIR MAJOR (Resource Conservation and Recovery Act (tracking hazardous waste)) Organizations: BRUCE SHARP R (CONTACT/OWNER)
CHEMCENTRAL CINCINNATI * (4619 READING RD in CINCINNATI, OH)
STATE MASTER (Ohio general info) - RCRA-OHD008926909, HAZARDOUS WASTE PROGRAM (Resource Conservation and Recovery Act (tracking hazardous waste)) Organizations: CHEMCENTRAL CORPORATION (CONTACT/OWNER)
BP OIL NO 09106 * (4600 PADDOCK RD in CINCINNATI, OH)
STATE MASTER (Ohio general info) - AIR MAJOR, RCRA-OHD987028073, HAZARDOUS WASTE PROGRAM Small Quantity Generators, between 100 kg and 1000 kg of hazardous waste/month (Resource Conservation and Recovery Act (tracking hazardous waste)) - notification Organizations: BP OIL CO (CONTACT/OWNER)
, BP OIL COMPANY (CONTACT/OWNER)
Alternative names: BP OIL CO SITE 09106
Housing units lacking complete plumbing facilities: 2.1% Housing units lacking complete kitchen facilities: 2.7%
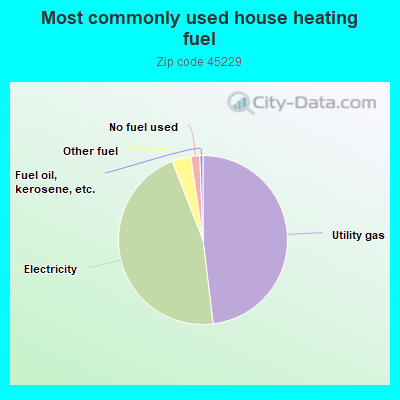
48.0%Utility gas
45.9%Electricity
3.6%Other fuel
1.7%No fuel used
0.6%Fuel oil, kerosene, etc.
Population in 1990: 19,811.
Place of birth for U.S.-born residents:
This state: 9,208
Northeast: 1,009
Midwest: 564
South: 1,688
West: 100
51% of the 45229 zip code residents lived in the same house 5 years ago. Out of people who lived in different houses, 83% lived in this county. Out of people who lived in different counties, 50% lived in Ohio.
83% of the 45229 zip code residents lived in the same house 1 year ago. Out of people who lived in different houses, 68% moved from this county. Out of people who lived in different houses, 12% moved from different county within same state. Out of people who lived in different houses, 14% moved from different state.
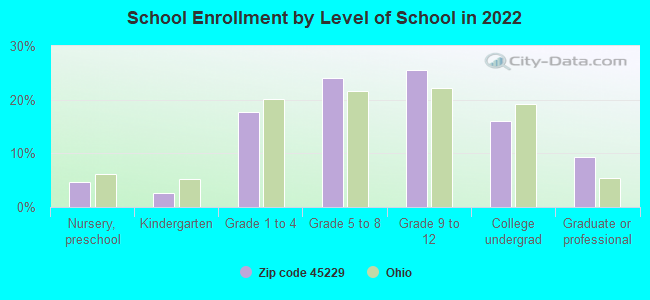
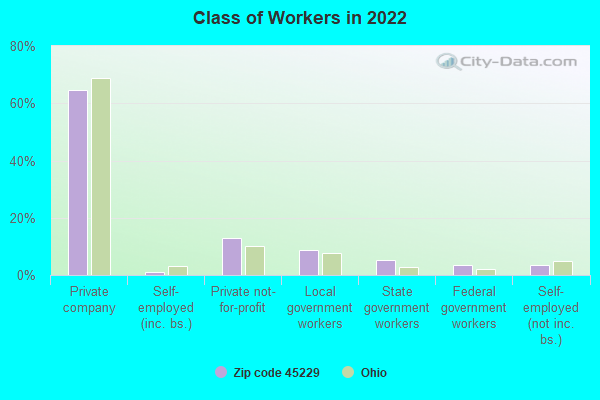
Private vs. public school enrollment:
Students in private schools in grades 1 to 8 (elementary and middle school): 98
Here:
9.7%
Ohio:
16.0%
Students in private schools in grades 9 to 12 (high school): 48
Here:
7.9%
Ohio:
13.1%
Students in private undergraduate colleges: 119
Here:
30.3%
Ohio:
22.3%
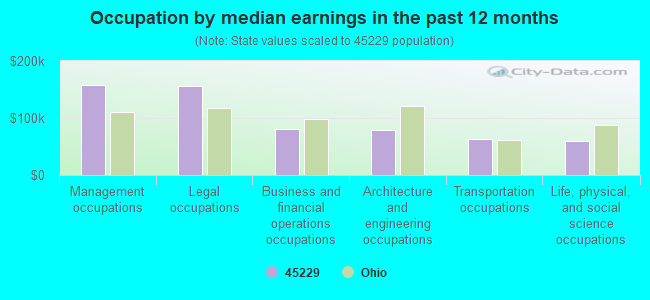
Occupation by median earnings in the past 12 months ($)
158,096Management occupations
156,576Legal occupations
80,596Business and financial operations occupations
78,601Architecture and engineering occupations
63,497Transportation occupations
59,695Life, physical, and social science occupations
Companies with federal contracts located in this zip code (CINCINNATI, OH):
BULLDOG DIRECT PROTECTIVE SYST (1245 TENNESSEE AVE; small business) : $528,359 in 5 contractsfrom 2003 to 2006
Contracts for Combat, Assault, and Tactical Vehicles, Tracked, Plate, Sheet, Strip, Foil; and Leaf, Other ADP and Telecommunications Services (includes data storage on tapes, compact disks, etc.), Other Defense -- Applied Research and Exploratory Development (R&D) by Department of Defense, Navy, Army Signed by year:2000: $0; 2001: $0; 2002: $0; 2003: $341,065; 2004: $70,758; 2005: $90,990; 2006: $25,546.
Biggest contracts:
$341,065 with Department of Defense for Combat, Assault, and Tactical Vehicles, Tracked. Signed on 2003-07-07. Completion date: 2004-07-07.
$90,990 with Navy for Plate, Sheet, Strip, Foil; and Leaf. Signed on 2005-08-19. Completion date: 2005-09-02.
$55,260 with Navy for Other ADP and Telecommunications Services (includes data storage on tapes, compact disks, etc.). Signed on 2004-09-09. Completion date: 2004-10-24.
$25,546 with Army for Plate, Sheet, Strip, Foil; and Leaf. Signed on 2006-04-26. Completion date: 2006-06-30.
LIPPMAN, WILLIAM HELLMUT (725 BETULA AVE; small business)
$45,580 with Defense Logistics Agency for Outerwear, Men's. Taking place in NJ. Signed on 2000-03-29. Completion date: 2000-12-31.
P H DUNCAN INTERNATIONAL INC (811 RIDGEWAY AVE; small business) : $38,951 in 8 contractsfrom 2005 to 2006
Contracts for Aircraft Maintenance and Repair Shop Specialized Equipment, Sets, Kits, and Outfits of Hand Tools, Hand Tools, Nonedged, Nonpowered by Navy, Air Force, Defense Logistics Agency Signed by year:2000: $0; 2001: $0; 2002: $0; 2003: $0; 2004: $0; 2005: $34,440; 2006: $4,511.
Biggest contracts:
$13,500 with Navy for Aircraft Maintenance and Repair Shop Specialized Equipment. Taking place in CT. Signed on 2005-09-15. Completion date: 2006-04-24.
$11,400, same as above.Signed on 2005-03-15. Completion date: 2005-12-30.
$4,470 with Air Force for Sets, Kits, and Outfits of Hand Tools. Signed on 2005-08-29. Completion date: 2005-10-31.
$3,748 with Air Force for Hand Tools, Nonedged, Nonpowered. Signed on 2006-05-10. Completion date: 2006-09-15.
BAUM MD, CHRISTOPHER 468464 (3333 BURNETT AVE; small business)
$150 with Food and Drug Administration for Other Administrative Support Services. Taking place in MD. Signed on 2006-03-14. Completion date: 2006-03-14.
Top industries in this zip code by the number of employees in 2005:
Health Care and Social Assistance: General Medical and Surgical Hospitals (over 1000 employees: 1 establishment, 250-499 employees: 1 establishment)
Health Care and Social Assistance: Offices of Physicians (except Mental Health Specialists) (over 1000: 1, 100-249: 1, 50-99: 2, 10-19: 1, 1-4: 11)
Accommodation and Food Services: Food Service Contractors (250-499: 1, 10-19: 1)
Health Care and Social Assistance: Nursing Care Facilities (50-99: 4, 20-49: 2)
Administrative and Support and Waste Management and Remediation Services: Temporary Help Services (100-249: 1)
Other Services (except Public Administration): Religious Organizations (20-49: 1, 10-19: 3, 5-9: 6, 1-4: 7)
Health Care and Social Assistance: Residential Mental Retardation Facilities (50-99: 1, 10-19: 1, 5-9: 1)
People in group quarters in 2010:
177 people in nursing facilities/skilled-nursing facilities
79 people in group homes intended for adults
16 people in emergency and transitional shelters (with sleeping facilities) for people experiencing homelessness
11 people in residential treatment centers for juveniles (non-correctional)
11 people in college/university student housing
9 people in other noninstitutional facilities
7 people in group homes for juveniles (non-correctional)
4 people in in-patient hospice facilities
3 people in residential treatment centers for adults
People in group quarters in 2000:
264 people in nursing homes
97 people in other noninstitutional group quarters
39 people in mental (psychiatric) hospitals or wards
37 people in homes for the mentally retarded
31 people in wards in general hospitals for patients who have no usual home elsewhere
13 people in other types of correctional institutions
12 people in religious group quarters
9 people in college dormitories (includes college quarters off campus)
5 people in homes for the mentally ill
Fatal accident statistics in 2014:
Fatal accident count: 1
Vehicles involved in fatal accidents: 2
Fatal accidents caused by drunken drivers: 0
Fatalities: 1
Persons involved in fatal accidents: 2
Pedestrians involved in fatal accidents: 0
Fatal accident statistics in 2012:
Fatal accident count: 1
Vehicles involved in fatal accidents: 2
Fatal accidents caused by drunken drivers: 0
Fatalities: 1
Persons involved in fatal accidents: 2
Pedestrians involved in fatal accidents: 0
Home Mortgage Disclosure Act Aggregated Statistics For Year 2009 (Based on 2 full and 16 partial tracts)
A) FHA, FSA/RHS & VA Home Purchase Loans
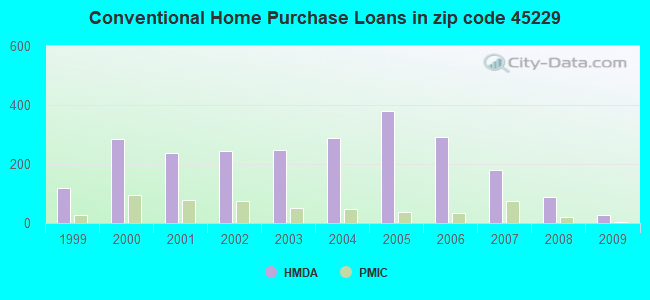
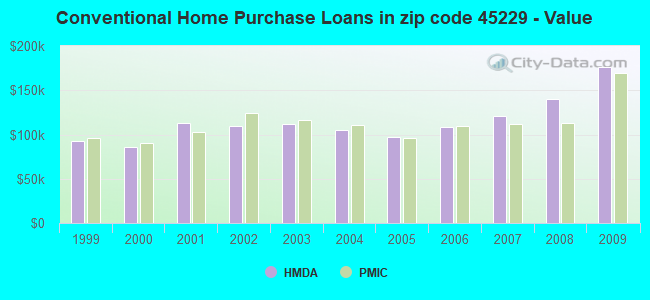
B) Conventional Home Purchase Loans
C) Refinancings
D) Home Improvement Loans
E) Loans on Dwellings For 5+ Families
F) Non-occupant Loans on < 5 Family Dwellings (A B C & D)
Number
Average Value
Number
Average Value
Number
Average Value
Number
Average Value
Number
Average Value
Number
Average Value
LOANS ORIGINATED
50
$112,580
26
$175,837
226
$152,726
24
$94,280
6
$226,668
22
$97,514
APPLICATIONS APPROVED, NOT ACCEPTED
4
$109,160
3
$105,800
17
$121,695
8
$94,179
0
$0
1
$121,080
APPLICATIONS DENIED
14
$111,349
17
$71,720
151
$129,361
40
$29,652
4
$582,318
31
$66,999
APPLICATIONS WITHDRAWN
4
$113,132
7
$34,224
62
$130,742
5
$110,078
1
$193,000
12
$71,795
FILES CLOSED FOR INCOMPLETENESS
1
$619,080
0
$0
23
$141,191
1
$31,530
0
$0
7
$57,249
Aggregated Statistics For Year 2008 (Based on 2 full and 16 partial tracts)
A) FHA, FSA/RHS & VA Home Purchase Loans
B) Conventional Home Purchase Loans
C) Refinancings
D) Home Improvement Loans
E) Loans on Dwellings For 5+ Families
F) Non-occupant Loans on < 5 Family Dwellings (A B C & D)
Number
Average Value
Number
Average Value
Number
Average Value
Number
Average Value
Number
Average Value
Number
Average Value
LOANS ORIGINATED
37
$101,790
88
$140,641
136
$152,230
31
$55,095
6
$781,177
63
$91,413
APPLICATIONS APPROVED, NOT ACCEPTED
6
$90,243
12
$108,317
33
$138,689
5
$12,680
0
$0
5
$119,312
APPLICATIONS DENIED
24
$100,656
37
$92,470
223
$114,774
80
$46,092
4
$402,142
88
$92,854
APPLICATIONS WITHDRAWN
2
$49,290
12
$118,848
51
$139,872
4
$73,790
0
$0
14
$93,971
FILES CLOSED FOR INCOMPLETENESS
3
$200,590
4
$110,682
15
$130,445
5
$58,672
1
$7,423,000
5
$102,338
Aggregated Statistics For Year 2007 (Based on 2 full and 16 partial tracts)
A) FHA, FSA/RHS & VA Home Purchase Loans
B) Conventional Home Purchase Loans
C) Refinancings
D) Home Improvement Loans
E) Loans on Dwellings For 5+ Families
F) Non-occupant Loans on < 5 Family Dwellings (A B C & D)
G) Loans On Manufactured Home Dwelling (A B C & D)
Number
Average Value
Number
Average Value
Number
Average Value
Number
Average Value
Number
Average Value
Number
Average Value
Number
Average Value
LOANS ORIGINATED
13
$99,406
181
$121,310
301
$116,642
69
$51,301
21
$463,487
147
$97,215
0
$0
APPLICATIONS APPROVED, NOT ACCEPTED
3
$75,357
38
$110,899
98
$111,887
20
$32,463
0
$0
40
$102,109
0
$0
APPLICATIONS DENIED
8
$119,605
102
$104,494
426
$117,755
114
$30,845
6
$159,328
127
$84,983
1
$20,460
APPLICATIONS WITHDRAWN
7
$88,687
28
$123,101
127
$109,354
5
$81,318
0
$0
44
$96,274
0
$0
FILES CLOSED FOR INCOMPLETENESS
0
$0
15
$87,458
52
$129,995
2
$116,875
1
$285,650
6
$87,538
0
$0
Aggregated Statistics For Year 2006 (Based on 2 full and 16 partial tracts)
A) FHA, FSA/RHS & VA Home Purchase Loans
B) Conventional Home Purchase Loans
C) Refinancings
D) Home Improvement Loans
E) Loans on Dwellings For 5+ Families
F) Non-occupant Loans on < 5 Family Dwellings (A B C & D)
G) Loans On Manufactured Home Dwelling (A B C & D)
Number
Average Value
Number
Average Value
Number
Average Value
Number
Average Value
Number
Average Value
Number
Average Value
Number
Average Value
LOANS ORIGINATED
17
$90,613
293
$108,413
425
$111,057
71
$50,478
16
$312,402
222
$92,222
0
$0
APPLICATIONS APPROVED, NOT ACCEPTED
1
$120,210
50
$91,337
140
$101,085
20
$51,248
1
$595,100
39
$76,867
3
$74,230
APPLICATIONS DENIED
10
$117,688
165
$111,624
524
$117,894
116
$40,166
16
$290,737
157
$90,046
2
$93,345
APPLICATIONS WITHDRAWN
2
$138,015
89
$96,751
183
$116,391
9
$43,328
4
$239,112
47
$86,162
0
$0
FILES CLOSED FOR INCOMPLETENESS
0
$0
13
$107,076
57
$120,157
3
$60,440
2
$398,640
19
$124,146
0
$0
Aggregated Statistics For Year 2005 (Based on 2 full and 16 partial tracts)
A) FHA, FSA/RHS & VA Home Purchase Loans
B) Conventional Home Purchase Loans
C) Refinancings
D) Home Improvement Loans
E) Loans on Dwellings For 5+ Families
F) Non-occupant Loans on < 5 Family Dwellings (A B C & D)
G) Loans On Manufactured Home Dwelling (A B C & D)
Number
Average Value
Number
Average Value
Number
Average Value
Number
Average Value
Number
Average Value
Number
Average Value
Number
Average Value
LOANS ORIGINATED
14
$99,118
381
$97,731
464
$125,502
65
$59,815
25
$424,215
285
$91,464
0
$0
APPLICATIONS APPROVED, NOT ACCEPTED
5
$114,450
77
$105,695
159
$94,347
11
$38,207
5
$243,516
67
$98,988
0
$0
APPLICATIONS DENIED
5
$123,460
207
$90,766
593
$113,137
119
$38,707
6
$134,965
164
$87,839
1
$246,890
APPLICATIONS WITHDRAWN
3
$140,783
83
$107,679
250
$109,585
35
$133,861
4
$196,068
62
$103,827
1
$193,000
FILES CLOSED FOR INCOMPLETENESS
2
$142,590
17
$78,725
67
$123,383
4
$129,000
0
$0
14
$99,983
0
$0
Aggregated Statistics For Year 2004 (Based on 2 full and 16 partial tracts)
A) FHA, FSA/RHS & VA Home Purchase Loans
B) Conventional Home Purchase Loans
C) Refinancings
D) Home Improvement Loans
E) Loans on Dwellings For 5+ Families
F) Non-occupant Loans on < 5 Family Dwellings (A B C & D)
G) Loans On Manufactured Home Dwelling (A B C & D)
Number
Average Value
Number
Average Value
Number
Average Value
Number
Average Value
Number
Average Value
Number
Average Value
Number
Average Value
LOANS ORIGINATED
26
$99,388
288
$104,782
554
$114,919
67
$40,258
14
$569,257
225
$86,431
5
$44,612
APPLICATIONS APPROVED, NOT ACCEPTED
2
$110,880
75
$91,220
188
$119,678
20
$36,571
2
$190,430
76
$85,403
1
$27,370
APPLICATIONS DENIED
14
$98,196
140
$87,004
468
$103,760
114
$34,680
3
$523,887
128
$75,787
1
$57,390
APPLICATIONS WITHDRAWN
2
$128,425
88
$83,113
235
$104,209
21
$53,270
0
$0
53
$81,856
0
$0
FILES CLOSED FOR INCOMPLETENESS
3
$116,327
11
$105,888
66
$127,015
0
$0
0
$0
11
$89,630
0
$0
Aggregated Statistics For Year 2003 (Based on 2 full and 16 partial tracts)
A) FHA, FSA/RHS & VA Home Purchase Loans
B) Conventional Home Purchase Loans
C) Refinancings
D) Home Improvement Loans
E) Loans on Dwellings For 5+ Families
F) Non-occupant Loans on < 5 Family Dwellings (A B C & D)
Number
Average Value
Number
Average Value
Number
Average Value
Number
Average Value
Number
Average Value
Number
Average Value
LOANS ORIGINATED
32
$101,287
248
$111,850
902
$121,068
63
$20,917
19
$485,323
226
$87,860
APPLICATIONS APPROVED, NOT ACCEPTED
4
$93,065
70
$111,922
164
$101,052
14
$36,482
0
$0
65
$99,903
APPLICATIONS DENIED
6
$132,623
121
$109,628
496
$103,524
115
$20,555
6
$462,043
108
$96,818
APPLICATIONS WITHDRAWN
3
$97,957
46
$128,532
241
$110,391
13
$26,496
1
$127,410
32
$93,095
FILES CLOSED FOR INCOMPLETENESS
0
$0
18
$119,199
71
$134,305
0
$0
0
$0
10
$102,072
Aggregated Statistics For Year 2002 (Based on 2 full and 16 partial tracts)
A) FHA, FSA/RHS & VA Home Purchase Loans
B) Conventional Home Purchase Loans
C) Refinancings
D) Home Improvement Loans
E) Loans on Dwellings For 5+ Families
F) Non-occupant Loans on < 5 Family Dwellings (A B C & D)
Number
Average Value
Number
Average Value
Number
Average Value
Number
Average Value
Number
Average Value
Number
Average Value
LOANS ORIGINATED
26
$99,577
243
$109,968
685
$113,194
74
$26,876
28
$574,434
203
$82,321
APPLICATIONS APPROVED, NOT ACCEPTED
11
$81,368
48
$97,098
212
$102,317
25
$35,074
3
$155,623
28
$78,368
APPLICATIONS DENIED
12
$100,036
101
$89,537
506
$95,641
128
$20,589
1
$237,710
103
$68,724
APPLICATIONS WITHDRAWN
3
$74,640
45
$102,435
264
$114,022
3
$97,750
4
$330,195
30
$79,278
FILES CLOSED FOR INCOMPLETENESS
0
$0
17
$75,005
68
$101,359
11
$49,330
0
$0
14
$76,094
Aggregated Statistics For Year 2001 (Based on 2 full and 16 partial tracts)
A) FHA, FSA/RHS & VA Home Purchase Loans
B) Conventional Home Purchase Loans
C) Refinancings
D) Home Improvement Loans
E) Loans on Dwellings For 5+ Families
F) Non-occupant Loans on < 5 Family Dwellings (A B C & D)
Number
Average Value
Number
Average Value
Number
Average Value
Number
Average Value
Number
Average Value
Number
Average Value
LOANS ORIGINATED
54
$86,081
238
$113,161
622
$120,348
101
$16,176
17
$514,902
169
$129,287
APPLICATIONS APPROVED, NOT ACCEPTED
5
$107,866
45
$112,202
193
$80,826
33
$10,898
5
$295,394
33
$67,473
APPLICATIONS DENIED
13
$85,082
114
$81,620
562
$87,252
123
$12,627
0
$0
75
$87,226
APPLICATIONS WITHDRAWN
4
$81,645
39
$80,238
296
$90,406
21
$31,811
4
$195,905
29
$64,562
FILES CLOSED FOR INCOMPLETENESS
3
$80,363
5
$85,440
48
$99,849
4
$27,840
0
$0
10
$71,751
Aggregated Statistics For Year 2000 (Based on 2 full and 16 partial tracts)
A) FHA, FSA/RHS & VA Home Purchase Loans
B) Conventional Home Purchase Loans
C) Refinancings
D) Home Improvement Loans
E) Loans on Dwellings For 5+ Families
F) Non-occupant Loans on < 5 Family Dwellings (A B C & D)
Number
Average Value
Number
Average Value
Number
Average Value
Number
Average Value
Number
Average Value
Number
Average Value
LOANS ORIGINATED
50
$93,949
284
$86,052
389
$84,095
109
$16,189
17
$462,534
134
$75,645
APPLICATIONS APPROVED, NOT ACCEPTED
10
$99,940
58
$77,544
191
$81,198
54
$21,193
0
$0
37
$78,278
APPLICATIONS DENIED
20
$81,600
173
$89,073
545
$78,120
190
$15,005
9
$470,099
115
$80,623
APPLICATIONS WITHDRAWN
6
$127,992
80
$98,190
186
$74,815
16
$21,492
3
$116,200
35
$72,443
FILES CLOSED FOR INCOMPLETENESS
5
$118,470
22
$87,260
62
$71,005
2
$10,630
0
$0
3
$74,833
Aggregated Statistics For Year 1999 (Based on 1 full and 8 partial tracts)
A) FHA, FSA/RHS & VA Home Purchase Loans
B) Conventional Home Purchase Loans
C) Refinancings
D) Home Improvement Loans
E) Loans on Dwellings For 5+ Families
F) Non-occupant Loans on < 5 Family Dwellings (A B C & D)
2002 - 2018 National Fire Incident Reporting System (NFIRS) incidents
Based on the data from the years 2002 - 2018 the average number of fires per year is 108. The highest number of fire incidents - 156 took place in 2004, and the least - 42 in 2002. The data has a rising trend.
When looking into fire subcategories, the most reports belonged to: Structure Fires (39.4%), and Outside Fires (26.1%).
Fire incident types reported to NFIRS in Zip Code 45229

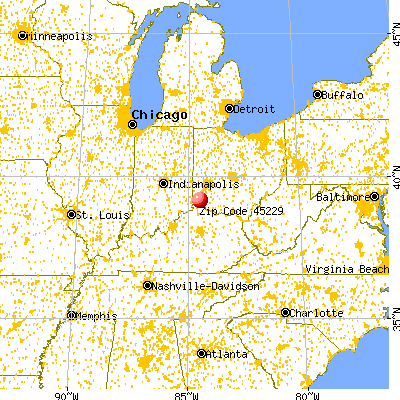


 Nearest zip codes: 45217, 45207, 45206, 45220, 45212, 45219.
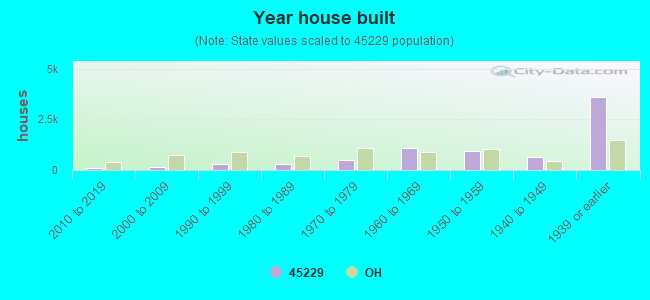


 Based on the data from the years 2002 - 2018 the average number of fires per year is 108. The highest number of fire incidents - 156 took place in 2004, and the least - 42 in 2002. The data has a rising trend.
 When looking into fire subcategories, the most reports belonged to: Structure Fires (39.4%), and Outside Fires (26.1%).