Estimated zip code population in 2022: 19,474
Zip code population in 2010: 16,526
Zip code population in 2000: 17,326
Houses and condos: 8,119
Renter-occupied apartments: 5,914
% of renters here:
85%State:
33%
March 2022 cost of living index in zip code 45219: 92.1
(less than average, U.S. average is 100)
Land area: 1.8
sq. mi.
Water area: 0.0
sq. mi.
Population density: 11,098 people per square mile (high).
OSM Map
General Map
Google Map
MSN Map
OSM Map
General Map
Google Map
MSN Map
OSM Map
General Map
Google Map
MSN Map
OSM Map
General Map
Google Map
MSN Map
Please wait while loading the map...
Real estate property taxes paid for housing units in 2022:
This zip code:
1.1% ($2,506)Ohio:
1.3% ($2,639)
Median real estate property taxes paid for housing units with mortgages in 2022: $2,613 (1.0%)
Median real estate property taxes paid for housing units with no mortgage in 2022: $1,886 (1.2%)
Profiles of local businesses
Business Search - 14 Million verified businesses
Males: 9,926 Females: 9,548
For population 25 years and over in 45219:
High school or higher: 90.9%Bachelor's degree or higher: 49.9%Graduate or professional degree: 21.5%Unemployed: 5.9%Mean travel time to work (commute): 18.4 minutes
For population 15 years and over in 45219:
Never married: 85.1%Now married: 8.6%Separated: 1.3%Widowed: 1.0%Divorced: 4.1%
Zip code 45219 compared to state average:
Median household income below state average. Median age significantly below state average. Foreign-born population percentage above state average. Renting percentage significantly above state average. Length of stay since moving in above state average. Number of rooms per house below state average. Number of college students significantly above state average. Percentage of population with a bachelor's degree or higher below state average. 13,148 67.5% White 3,186 16.4% Black 1,282 6.6% Asian 939 4.8% Two or more races 898 4.6% Hispanic or Latino 10 0.05% Some other race 6 0.03% American Indian
Data:
Median household income ($)
Median household income (% change since 2000)
Household income diversity
Ratio of average income to average house value (%)
Ratio of average income to average rent
Median household income ($) - White
Median household income ($) - Black or African American
Median household income ($) - Asian
Median household income ($) - Hispanic or Latino
Median household income ($) - American Indian and Alaska Native
Median household income ($) - Multirace
Median household income ($) - Other Race
Median household income for houses/condos with a mortgage ($)
Median household income for apartments without a mortgage ($)
Races - White alone (%)
Races - White alone (% change since 2000)
Races - Black alone (%)
Races - Black alone (% change since 2000)
Races - American Indian alone (%)
Races - American Indian alone (% change since 2000)
Races - Asian alone (%)
Races - Asian alone (% change since 2000)
Races - Hispanic (%)
Races - Hispanic (% change since 2000)
Races - Native Hawaiian and Other Pacific Islander alone (%)
Races - Native Hawaiian and Other Pacific Islander alone (% change since 2000)
Races - Two or more races (%)
Races - Two or more races (% change since 2000)
Races - Other race alone (%)
Races - Other race alone (% change since 2000)
Racial diversity
Unemployment (%)
Unemployment (% change since 2000)
Unemployment (%) - White
Unemployment (%) - Black or African American
Unemployment (%) - Asian
Unemployment (%) - Hispanic or Latino
Unemployment (%) - American Indian and Alaska Native
Unemployment (%) - Multirace
Unemployment (%) - Other Race
Population density (people per square mile)
Population - Males (%)
Population - Females (%)
Population - Males (%) - White
Population - Males (%) - Black or African American
Population - Males (%) - Asian
Population - Males (%) - Hispanic or Latino
Population - Males (%) - American Indian and Alaska Native
Population - Males (%) - Multirace
Population - Males (%) - Other Race
Population - Females (%) - White
Population - Females (%) - Black or African American
Population - Females (%) - Asian
Population - Females (%) - Hispanic or Latino
Population - Females (%) - American Indian and Alaska Native
Population - Females (%) - Multirace
Population - Females (%) - Other Race
Coronavirus confirmed cases (Apr 27, 2024)
Deaths caused by coronavirus (Apr 27, 2024)
Coronavirus confirmed cases (per 100k population) (Apr 27, 2024)
Deaths caused by coronavirus (per 100k population) (Apr 27, 2024)
Daily increase in number of cases (Apr 27, 2024)
Weekly increase in number of cases (Apr 27, 2024)
Cases doubled (in days) (Apr 27, 2024)
Hospitalized patients (Apr 18, 2022)
Negative test results (Apr 18, 2022)
Total test results (Apr 18, 2022)
COVID Vaccine doses distributed (per 100k population) (Sep 19, 2023)
COVID Vaccine doses administered (per 100k population) (Sep 19, 2023)
COVID Vaccine doses distributed (Sep 19, 2023)
COVID Vaccine doses administered (Sep 19, 2023)
Likely homosexual households (%)
Likely homosexual households (% change since 2000)
Likely homosexual households - Lesbian couples (%)
Likely homosexual households - Lesbian couples (% change since 2000)
Likely homosexual households - Gay men (%)
Likely homosexual households - Gay men (% change since 2000)
Cost of living index
Median gross rent ($)
Median contract rent ($)
Median monthly housing costs ($)
Median house or condo value ($)
Median house or condo value ($ change since 2000)
Mean house or condo value by units in structure - 1, detached ($)
Mean house or condo value by units in structure - 1, attached ($)
Mean house or condo value by units in structure - 2 ($)
Mean house or condo value by units in structure by units in structure - 3 or 4 ($)
Mean house or condo value by units in structure - 5 or more ($)
Mean house or condo value by units in structure - Boat, RV, van, etc. ($)
Mean house or condo value by units in structure - Mobile home ($)
Median house or condo value ($) - White
Median house or condo value ($) - Black or African American
Median house or condo value ($) - Asian
Median house or condo value ($) - Hispanic or Latino
Median house or condo value ($) - American Indian and Alaska Native
Median house or condo value ($) - Multirace
Median house or condo value ($) - Other Race
Median resident age
Resident age diversity
Median resident age - Males
Median resident age - Females
Median resident age - White
Median resident age - Black or African American
Median resident age - Asian
Median resident age - Hispanic or Latino
Median resident age - American Indian and Alaska Native
Median resident age - Multirace
Median resident age - Other Race
Median resident age - Males - White
Median resident age - Males - Black or African American
Median resident age - Males - Asian
Median resident age - Males - Hispanic or Latino
Median resident age - Males - American Indian and Alaska Native
Median resident age - Males - Multirace
Median resident age - Males - Other Race
Median resident age - Females - White
Median resident age - Females - Black or African American
Median resident age - Females - Asian
Median resident age - Females - Hispanic or Latino
Median resident age - Females - American Indian and Alaska Native
Median resident age - Females - Multirace
Median resident age - Females - Other Race
Commute - mean travel time to work (minutes)
Travel time to work - Less than 5 minutes (%)
Travel time to work - Less than 5 minutes (% change since 2000)
Travel time to work - 5 to 9 minutes (%)
Travel time to work - 5 to 9 minutes (% change since 2000)
Travel time to work - 10 to 19 minutes (%)
Travel time to work - 10 to 19 minutes (% change since 2000)
Travel time to work - 20 to 29 minutes (%)
Travel time to work - 20 to 29 minutes (% change since 2000)
Travel time to work - 30 to 39 minutes (%)
Travel time to work - 30 to 39 minutes (% change since 2000)
Travel time to work - 40 to 59 minutes (%)
Travel time to work - 40 to 59 minutes (% change since 2000)
Travel time to work - 60 to 89 minutes (%)
Travel time to work - 60 to 89 minutes (% change since 2000)
Travel time to work - 90 or more minutes (%)
Travel time to work - 90 or more minutes (% change since 2000)
Marital status - Never married (%)
Marital status - Now married (%)
Marital status - Separated (%)
Marital status - Widowed (%)
Marital status - Divorced (%)
Median family income ($)
Median family income (% change since 2000)
Median non-family income ($)
Median non-family income (% change since 2000)
Median per capita income ($)
Median per capita income (% change since 2000)
Median family income ($) - White
Median family income ($) - Black or African American
Median family income ($) - Asian
Median family income ($) - Hispanic or Latino
Median family income ($) - American Indian and Alaska Native
Median family income ($) - Multirace
Median family income ($) - Other Race
Median year house/condo built
Median year apartment built
Year house built - Built 2005 or later (%)
Year house built - Built 2000 to 2004 (%)
Year house built - Built 1990 to 1999 (%)
Year house built - Built 1980 to 1989 (%)
Year house built - Built 1970 to 1979 (%)
Year house built - Built 1960 to 1969 (%)
Year house built - Built 1950 to 1959 (%)
Year house built - Built 1940 to 1949 (%)
Year house built - Built 1939 or earlier (%)
Average household size
Household density (households per square mile)
Average household size - White
Average household size - Black or African American
Average household size - Asian
Average household size - Hispanic or Latino
Average household size - American Indian and Alaska Native
Average household size - Multirace
Average household size - Other Race
Occupied housing units (%)
Vacant housing units (%)
Owner occupied housing units (%)
Renter occupied housing units (%)
Vacancy status - For rent (%)
Vacancy status - For sale only (%)
Vacancy status - Rented or sold, not occupied (%)
Vacancy status - For seasonal, recreational, or occasional use (%)
Vacancy status - For migrant workers (%)
Vacancy status - Other vacant (%)
Residents with income below the poverty level (%)
Residents with income below 50% of the poverty level (%)
Children below poverty level (%)
Poor families by family type - Married-couple family (%)
Poor families by family type - Male, no wife present (%)
Poor families by family type - Female, no husband present (%)
Poverty status for native-born residents (%)
Poverty status for foreign-born residents (%)
Poverty among high school graduates not in families (%)
Poverty among people who did not graduate high school not in families (%)
Residents with income below the poverty level (%) - White
Residents with income below the poverty level (%) - Black or African American
Residents with income below the poverty level (%) - Asian
Residents with income below the poverty level (%) - Hispanic or Latino
Residents with income below the poverty level (%) - American Indian and Alaska Native
Residents with income below the poverty level (%) - Multirace
Residents with income below the poverty level (%) - Other Race
Air pollution - Air Quality Index (AQI)
Air pollution - CO
Air pollution - NO2
Air pollution - SO2
Air pollution - Ozone
Air pollution - PM10
Air pollution - PM25
Air pollution - Pb
Crime - Murders per 100,000 population
Crime - Rapes per 100,000 population
Crime - Robberies per 100,000 population
Crime - Assaults per 100,000 population
Crime - Burglaries per 100,000 population
Crime - Thefts per 100,000 population
Crime - Auto thefts per 100,000 population
Crime - Arson per 100,000 population
Crime - City-data.com crime index
Crime - Violent crime index
Crime - Property crime index
Crime - Murders per 100,000 population (5 year average)
Crime - Rapes per 100,000 population (5 year average)
Crime - Robberies per 100,000 population (5 year average)
Crime - Assaults per 100,000 population (5 year average)
Crime - Burglaries per 100,000 population (5 year average)
Crime - Thefts per 100,000 population (5 year average)
Crime - Auto thefts per 100,000 population (5 year average)
Crime - Arson per 100,000 population (5 year average)
Crime - City-data.com crime index (5 year average)
Crime - Violent crime index (5 year average)
Crime - Property crime index (5 year average)
1996 Presidential Elections Results (%) - Democratic Party (Clinton)
1996 Presidential Elections Results (%) - Republican Party (Dole)
1996 Presidential Elections Results (%) - Other
2000 Presidential Elections Results (%) - Democratic Party (Gore)
2000 Presidential Elections Results (%) - Republican Party (Bush)
2000 Presidential Elections Results (%) - Other
2004 Presidential Elections Results (%) - Democratic Party (Kerry)
2004 Presidential Elections Results (%) - Republican Party (Bush)
2004 Presidential Elections Results (%) - Other
2008 Presidential Elections Results (%) - Democratic Party (Obama)
2008 Presidential Elections Results (%) - Republican Party (McCain)
2008 Presidential Elections Results (%) - Other
2012 Presidential Elections Results (%) - Democratic Party (Obama)
2012 Presidential Elections Results (%) - Republican Party (Romney)
2012 Presidential Elections Results (%) - Other
2016 Presidential Elections Results (%) - Democratic Party (Clinton)
2016 Presidential Elections Results (%) - Republican Party (Trump)
2016 Presidential Elections Results (%) - Other
2020 Presidential Elections Results (%) - Democratic Party (Biden)
2020 Presidential Elections Results (%) - Republican Party (Trump)
2020 Presidential Elections Results (%) - Other
Ancestries Reported - Arab (%)
Ancestries Reported - Czech (%)
Ancestries Reported - Danish (%)
Ancestries Reported - Dutch (%)
Ancestries Reported - English (%)
Ancestries Reported - French (%)
Ancestries Reported - French Canadian (%)
Ancestries Reported - German (%)
Ancestries Reported - Greek (%)
Ancestries Reported - Hungarian (%)
Ancestries Reported - Irish (%)
Ancestries Reported - Italian (%)
Ancestries Reported - Lithuanian (%)
Ancestries Reported - Norwegian (%)
Ancestries Reported - Polish (%)
Ancestries Reported - Portuguese (%)
Ancestries Reported - Russian (%)
Ancestries Reported - Scotch-Irish (%)
Ancestries Reported - Scottish (%)
Ancestries Reported - Slovak (%)
Ancestries Reported - Subsaharan African (%)
Ancestries Reported - Swedish (%)
Ancestries Reported - Swiss (%)
Ancestries Reported - Ukrainian (%)
Ancestries Reported - United States (%)
Ancestries Reported - Welsh (%)
Ancestries Reported - West Indian (%)
Ancestries Reported - Other (%)
Educational Attainment - No schooling completed (%)
Educational Attainment - Less than high school (%)
Educational Attainment - High school or equivalent (%)
Educational Attainment - Less than 1 year of college (%)
Educational Attainment - 1 or more years of college (%)
Educational Attainment - Associate degree (%)
Educational Attainment - Bachelor's degree (%)
Educational Attainment - Master's degree (%)
Educational Attainment - Professional school degree (%)
Educational Attainment - Doctorate degree (%)
School Enrollment - Nursery, preschool (%)
School Enrollment - Kindergarten (%)
School Enrollment - Grade 1 to 4 (%)
School Enrollment - Grade 5 to 8 (%)
School Enrollment - Grade 9 to 12 (%)
School Enrollment - College undergrad (%)
School Enrollment - Graduate or professional (%)
School Enrollment - Not enrolled in school (%)
School enrollment - Public schools (%)
School enrollment - Private schools (%)
School enrollment - Not enrolled (%)
Median number of rooms in houses and condos
Median number of rooms in apartments
Housing units lacking complete plumbing facilities (%)
Housing units lacking complete kitchen facilities (%)
Density of houses
Urban houses (%)
Rural houses (%)
Households with people 60 years and over (%)
Households with people 65 years and over (%)
Households with people 75 years and over (%)
Households with one or more nonrelatives (%)
Households with no nonrelatives (%)
Population in households (%)
Family households (%)
Nonfamily households (%)
Population in families (%)
Family households with own children (%)
Median number of bedrooms in owner occupied houses
Mean number of bedrooms in owner occupied houses
Median number of bedrooms in renter occupied houses
Mean number of bedrooms in renter occupied houses
Median number of vehichles in owner occupied houses
Mean number of vehichles in owner occupied houses
Median number of vehichles in renter occupied houses
Mean number of vehichles in renter occupied houses
Mortgage status - with mortgage (%)
Mortgage status - with second mortgage (%)
Mortgage status - with home equity loan (%)
Mortgage status - with both second mortgage and home equity loan (%)
Mortgage status - without a mortgage (%)
Average family size
Average family size - White
Average family size - Black or African American
Average family size - Asian
Average family size - Hispanic or Latino
Average family size - American Indian and Alaska Native
Average family size - Multirace
Average family size - Other Race
Geographical mobility - Same house 1 year ago (%)
Geographical mobility - Moved within same county (%)
Geographical mobility - Moved from different county within same state (%)
Geographical mobility - Moved from different state (%)
Geographical mobility - Moved from abroad (%)
Place of birth - Born in state of residence (%)
Place of birth - Born in other state (%)
Place of birth - Native, outside of US (%)
Place of birth - Foreign born (%)
Housing units in structures - 1, detached (%)
Housing units in structures - 1, attached (%)
Housing units in structures - 2 (%)
Housing units in structures - 3 or 4 (%)
Housing units in structures - 5 to 9 (%)
Housing units in structures - 10 to 19 (%)
Housing units in structures - 20 to 49 (%)
Housing units in structures - 50 or more (%)
Housing units in structures - Mobile home (%)
Housing units in structures - Boat, RV, van, etc. (%)
House/condo owner moved in on average (years ago)
Renter moved in on average (years ago)
Year householder moved into unit - Moved in 1999 to March 2000 (%)
Year householder moved into unit - Moved in 1995 to 1998 (%)
Year householder moved into unit - Moved in 1990 to 1994 (%)
Year householder moved into unit - Moved in 1980 to 1989 (%)
Year householder moved into unit - Moved in 1970 to 1979 (%)
Year householder moved into unit - Moved in 1969 or earlier (%)
Means of transportation to work - Drove car alone (%)
Means of transportation to work - Carpooled (%)
Means of transportation to work - Public transportation (%)
Means of transportation to work - Bus or trolley bus (%)
Means of transportation to work - Streetcar or trolley car (%)
Means of transportation to work - Subway or elevated (%)
Means of transportation to work - Railroad (%)
Means of transportation to work - Ferryboat (%)
Means of transportation to work - Taxicab (%)
Means of transportation to work - Motorcycle (%)
Means of transportation to work - Bicycle (%)
Means of transportation to work - Walked (%)
Means of transportation to work - Other means (%)
Working at home (%)
Industry diversity
Most Common Industries - Agriculture, forestry, fishing and hunting, and mining (%)
Most Common Industries - Agriculture, forestry, fishing and hunting (%)
Most Common Industries - Mining, quarrying, and oil and gas extraction (%)
Most Common Industries - Construction (%)
Most Common Industries - Manufacturing (%)
Most Common Industries - Wholesale trade (%)
Most Common Industries - Retail trade (%)
Most Common Industries - Transportation and warehousing, and utilities (%)
Most Common Industries - Transportation and warehousing (%)
Most Common Industries - Utilities (%)
Most Common Industries - Information (%)
Most Common Industries - Finance and insurance, and real estate and rental and leasing (%)
Most Common Industries - Finance and insurance (%)
Most Common Industries - Real estate and rental and leasing (%)
Most Common Industries - Professional, scientific, and management, and administrative and waste management services (%)
Most Common Industries - Professional, scientific, and technical services (%)
Most Common Industries - Management of companies and enterprises (%)
Most Common Industries - Administrative and support and waste management services (%)
Most Common Industries - Educational services, and health care and social assistance (%)
Most Common Industries - Educational services (%)
Most Common Industries - Health care and social assistance (%)
Most Common Industries - Arts, entertainment, and recreation, and accommodation and food services (%)
Most Common Industries - Arts, entertainment, and recreation (%)
Most Common Industries - Accommodation and food services (%)
Most Common Industries - Other services, except public administration (%)
Most Common Industries - Public administration (%)
Occupation diversity
Most Common Occupations - Management, business, science, and arts occupations (%)
Most Common Occupations - Management, business, and financial occupations (%)
Most Common Occupations - Management occupations (%)
Most Common Occupations - Business and financial operations occupations (%)
Most Common Occupations - Computer, engineering, and science occupations (%)
Most Common Occupations - Computer and mathematical occupations (%)
Most Common Occupations - Architecture and engineering occupations (%)
Most Common Occupations - Life, physical, and social science occupations (%)
Most Common Occupations - Education, legal, community service, arts, and media occupations (%)
Most Common Occupations - Community and social service occupations (%)
Most Common Occupations - Legal occupations (%)
Most Common Occupations - Education, training, and library occupations (%)
Most Common Occupations - Arts, design, entertainment, sports, and media occupations (%)
Most Common Occupations - Healthcare practitioners and technical occupations (%)
Most Common Occupations - Health diagnosing and treating practitioners and other technical occupations (%)
Most Common Occupations - Health technologists and technicians (%)
Most Common Occupations - Service occupations (%)
Most Common Occupations - Healthcare support occupations (%)
Most Common Occupations - Protective service occupations (%)
Most Common Occupations - Fire fighting and prevention, and other protective service workers including supervisors (%)
Most Common Occupations - Law enforcement workers including supervisors (%)
Most Common Occupations - Food preparation and serving related occupations (%)
Most Common Occupations - Building and grounds cleaning and maintenance occupations (%)
Most Common Occupations - Personal care and service occupations (%)
Most Common Occupations - Sales and office occupations (%)
Most Common Occupations - Sales and related occupations (%)
Most Common Occupations - Office and administrative support occupations (%)
Most Common Occupations - Natural resources, construction, and maintenance occupations (%)
Most Common Occupations - Farming, fishing, and forestry occupations (%)
Most Common Occupations - Construction and extraction occupations (%)
Most Common Occupations - Installation, maintenance, and repair occupations (%)
Most Common Occupations - Production, transportation, and material moving occupations (%)
Most Common Occupations - Production occupations (%)
Most Common Occupations - Transportation occupations (%)
Most Common Occupations - Material moving occupations (%)
People in Group quarters - Institutionalized population (%)
People in Group quarters - Correctional institutions (%)
People in Group quarters - Federal prisons and detention centers (%)
People in Group quarters - Halfway houses (%)
People in Group quarters - Local jails and other confinement facilities (including police lockups) (%)
People in Group quarters - Military disciplinary barracks (%)
People in Group quarters - State prisons (%)
People in Group quarters - Other types of correctional institutions (%)
People in Group quarters - Nursing homes (%)
People in Group quarters - Hospitals/wards, hospices, and schools for the handicapped (%)
People in Group quarters - Hospitals/wards and hospices for chronically ill (%)
People in Group quarters - Hospices or homes for chronically ill (%)
People in Group quarters - Military hospitals or wards for chronically ill (%)
People in Group quarters - Other hospitals or wards for chronically ill (%)
People in Group quarters - Hospitals or wards for drug/alcohol abuse (%)
People in Group quarters - Mental (Psychiatric) hospitals or wards (%)
People in Group quarters - Schools, hospitals, or wards for the mentally retarded (%)
People in Group quarters - Schools, hospitals, or wards for the physically handicapped (%)
People in Group quarters - Institutions for the deaf (%)
People in Group quarters - Institutions for the blind (%)
People in Group quarters - Orthopedic wards and institutions for the physically handicapped (%)
People in Group quarters - Wards in general hospitals for patients who have no usual home elsewhere (%)
People in Group quarters - Wards in military hospitals for patients who have no usual home elsewhere (%)
People in Group quarters - Juvenile institutions (%)
People in Group quarters - Long-term care (%)
People in Group quarters - Homes for abused, dependent, and neglected children (%)
People in Group quarters - Residential treatment centers for emotionally disturbed children (%)
People in Group quarters - Training schools for juvenile delinquents (%)
People in Group quarters - Short-term care, detention or diagnostic centers for delinquent children (%)
People in Group quarters - Type of juvenile institution unknown (%)
People in Group quarters - Noninstitutionalized population (%)
People in Group quarters - College dormitories (includes college quarters off campus) (%)
People in Group quarters - Military quarters (%)
People in Group quarters - On base (%)
People in Group quarters - Barracks, unaccompanied personnel housing (UPH), (Enlisted/Officer), ;and similar group living quarters for military personnel (%)
People in Group quarters - Transient quarters for temporary residents (%)
People in Group quarters - Military ships (%)
People in Group quarters - Group homes (%)
People in Group quarters - Homes or halfway houses for drug/alcohol abuse (%)
People in Group quarters - Homes for the mentally ill (%)
People in Group quarters - Homes for the mentally retarded (%)
People in Group quarters - Homes for the physically handicapped (%)
People in Group quarters - Other group homes (%)
People in Group quarters - Religious group quarters (%)
People in Group quarters - Dormitories (%)
People in Group quarters - Agriculture workers' dormitories on farms (%)
People in Group quarters - Job Corps and vocational training facilities (%)
People in Group quarters - Other workers' dormitories (%)
People in Group quarters - Crews of maritime vessels (%)
People in Group quarters - Other nonhousehold living situations (%)
People in Group quarters - Other noninstitutional group quarters (%)
Residents speaking English at home (%)
Residents speaking English at home - Born in the United States (%)
Residents speaking English at home - Native, born elsewhere (%)
Residents speaking English at home - Foreign born (%)
Residents speaking Spanish at home (%)
Residents speaking Spanish at home - Born in the United States (%)
Residents speaking Spanish at home - Native, born elsewhere (%)
Residents speaking Spanish at home - Foreign born (%)
Residents speaking other language at home (%)
Residents speaking other language at home - Born in the United States (%)
Residents speaking other language at home - Native, born elsewhere (%)
Residents speaking other language at home - Foreign born (%)
Class of Workers - Employee of private company (%)
Class of Workers - Self-employed in own incorporated business (%)
Class of Workers - Private not-for-profit wage and salary workers (%)
Class of Workers - Local government workers (%)
Class of Workers - State government workers (%)
Class of Workers - Federal government workers (%)
Class of Workers - Self-employed workers in own not incorporated business and Unpaid family workers (%)
House heating fuel used in houses and condos - Utility gas (%)
House heating fuel used in houses and condos - Bottled, tank, or LP gas (%)
House heating fuel used in houses and condos - Electricity (%)
House heating fuel used in houses and condos - Fuel oil, kerosene, etc. (%)
House heating fuel used in houses and condos - Coal or coke (%)
House heating fuel used in houses and condos - Wood (%)
House heating fuel used in houses and condos - Solar energy (%)
House heating fuel used in houses and condos - Other fuel (%)
House heating fuel used in houses and condos - No fuel used (%)
House heating fuel used in apartments - Utility gas (%)
House heating fuel used in apartments - Bottled, tank, or LP gas (%)
House heating fuel used in apartments - Electricity (%)
House heating fuel used in apartments - Fuel oil, kerosene, etc. (%)
House heating fuel used in apartments - Coal or coke (%)
House heating fuel used in apartments - Wood (%)
House heating fuel used in apartments - Solar energy (%)
House heating fuel used in apartments - Other fuel (%)
House heating fuel used in apartments - No fuel used (%)
Armed forces status - In Armed Forces (%)
Armed forces status - Civilian (%)
Armed forces status - Civilian - Veteran (%)
Armed forces status - Civilian - Nonveteran (%)
Fatal accidents locations in years 2005-2021
Fatal accidents locations in 2005
Fatal accidents locations in 2006
Fatal accidents locations in 2007
Fatal accidents locations in 2008
Fatal accidents locations in 2009
Fatal accidents locations in 2010
Fatal accidents locations in 2011
Fatal accidents locations in 2012
Fatal accidents locations in 2013
Fatal accidents locations in 2014
Fatal accidents locations in 2015
Fatal accidents locations in 2016
Fatal accidents locations in 2017
Fatal accidents locations in 2018
Fatal accidents locations in 2019
Fatal accidents locations in 2020
Fatal accidents locations in 2021
Alcohol use - People drinking some alcohol every month (%)
Alcohol use - People not drinking at all (%)
Alcohol use - Average days/month drinking alcohol
Alcohol use - Average drinks/week
Alcohol use - Average days/year people drink much
Audiometry - Average condition of hearing (%)
Audiometry - People that can hear a whisper from across a quiet room (%)
Audiometry - People that can hear normal voice from across a quiet room (%)
Audiometry - Ears ringing, roaring, buzzing (%)
Audiometry - Had a job exposure to loud noise (%)
Audiometry - Had off-work exposure to loud noise (%)
Blood Pressure & Cholesterol - Has high blood pressure (%)
Blood Pressure & Cholesterol - Checking blood pressure at home (%)
Blood Pressure & Cholesterol - Frequently checking blood cholesterol (%)
Blood Pressure & Cholesterol - Has high cholesterol level (%)
Consumer Behavior - Money monthly spent on food at supermarket/grocery store
Consumer Behavior - Money monthly spent on food at other stores
Consumer Behavior - Money monthly spent on eating out
Consumer Behavior - Money monthly spent on carryout/delivered foods
Consumer Behavior - Income spent on food at supermarket/grocery store (%)
Consumer Behavior - Income spent on food at other stores (%)
Consumer Behavior - Income spent on eating out (%)
Consumer Behavior - Income spent on carryout/delivered foods (%)
Current Health Status - General health condition (%)
Current Health Status - Blood donors (%)
Current Health Status - Has blood ever tested for HIV virus (%)
Current Health Status - Left-handed people (%)
Dermatology - People using sunscreen (%)
Diabetes - Diabetics (%)
Diabetes - Had a blood test for high blood sugar (%)
Diabetes - People taking insulin (%)
Diet Behavior & Nutrition - Diet health (%)
Diet Behavior & Nutrition - Milk product consumption (# of products/month)
Diet Behavior & Nutrition - Meals not home prepared (#/week)
Diet Behavior & Nutrition - Meals from fast food or pizza place (#/week)
Diet Behavior & Nutrition - Ready-to-eat foods (#/month)
Diet Behavior & Nutrition - Frozen meals/pizza (#/month)
Drug Use - People that ever used marijuana or hashish (%)
Drug Use - Ever used hard drugs (%)
Drug Use - Ever used any form of cocaine (%)
Drug Use - Ever used heroin (%)
Drug Use - Ever used methamphetamine (%)
Health Insurance - People covered by health insurance (%)
Kidney Conditions-Urology - Avg. # of times urinating at night
Medical Conditions - People with asthma (%)
Medical Conditions - People with anemia (%)
Medical Conditions - People with psoriasis (%)
Medical Conditions - People with overweight (%)
Medical Conditions - Elderly people having difficulties in thinking or remembering (%)
Medical Conditions - People who ever received blood transfusion (%)
Medical Conditions - People having trouble seeing even with glass/contacts (%)
Medical Conditions - People with arthritis (%)
Medical Conditions - People with gout (%)
Medical Conditions - People with congestive heart failure (%)
Medical Conditions - People with coronary heart disease (%)
Medical Conditions - People with angina pectoris (%)
Medical Conditions - People who ever had heart attack (%)
Medical Conditions - People who ever had stroke (%)
Medical Conditions - People with emphysema (%)
Medical Conditions - People with thyroid problem (%)
Medical Conditions - People with chronic bronchitis (%)
Medical Conditions - People with any liver condition (%)
Medical Conditions - People who ever had cancer or malignancy (%)
Mental Health - People who have little interest in doing things (%)
Mental Health - People feeling down, depressed, or hopeless (%)
Mental Health - People who have trouble sleeping or sleeping too much (%)
Mental Health - People feeling tired or having little energy (%)
Mental Health - People with poor appetite or overeating (%)
Mental Health - People feeling bad about themself (%)
Mental Health - People who have trouble concentrating on things (%)
Mental Health - People moving or speaking slowly or too fast (%)
Mental Health - People having thoughts they would be better off dead (%)
Oral Health - Average years since last visit a dentist
Oral Health - People embarrassed because of mouth (%)
Oral Health - People with gum disease (%)
Oral Health - General health of teeth and gums (%)
Oral Health - Average days a week using dental floss/device
Oral Health - Average days a week using mouthwash for dental problem
Oral Health - Average number of teeth
Pesticide Use - Households using pesticides to control insects (%)
Pesticide Use - Households using pesticides to kill weeds (%)
Physical Activity - People doing vigorous-intensity work activities (%)
Physical Activity - People doing moderate-intensity work activities (%)
Physical Activity - People walking or bicycling (%)
Physical Activity - People doing vigorous-intensity recreational activities (%)
Physical Activity - People doing moderate-intensity recreational activities (%)
Physical Activity - Average hours a day doing sedentary activities
Physical Activity - Average hours a day watching TV or videos
Physical Activity - Average hours a day using computer
Physical Functioning - People having limitations keeping them from working (%)
Physical Functioning - People limited in amount of work they can do (%)
Physical Functioning - People that need special equipment to walk (%)
Physical Functioning - People experiencing confusion/memory problems (%)
Physical Functioning - People requiring special healthcare equipment (%)
Prescription Medications - Average number of prescription medicines taking
Preventive Aspirin Use - Adults 40+ taking low-dose aspirin (%)
Reproductive Health - Vaginal deliveries (%)
Reproductive Health - Cesarean deliveries (%)
Reproductive Health - Deliveries resulted in a live birth (%)
Reproductive Health - Pregnancies resulted in a delivery (%)
Reproductive Health - Women breastfeeding newborns (%)
Reproductive Health - Women that had a hysterectomy (%)
Reproductive Health - Women that had both ovaries removed (%)
Reproductive Health - Women that have ever taken birth control pills (%)
Reproductive Health - Women taking birth control pills (%)
Reproductive Health - Women that have ever used Depo-Provera or injectables (%)
Reproductive Health - Women that have ever used female hormones (%)
Sexual Behavior - People 18+ that ever had sex (vaginal, anal, or oral) (%)
Sexual Behavior - Males 18+ that ever had vaginal sex with a woman (%)
Sexual Behavior - Males 18+ that ever performed oral sex on a woman (%)
Sexual Behavior - Males 18+ that ever had anal sex with a woman (%)
Sexual Behavior - Males 18+ that ever had any sex with a man (%)
Sexual Behavior - Females 18+ that ever had vaginal sex with a man (%)
Sexual Behavior - Females 18+ that ever performed oral sex on a man (%)
Sexual Behavior - Females 18+ that ever had anal sex with a man (%)
Sexual Behavior - Females 18+ that ever had any kind of sex with a woman (%)
Sexual Behavior - Average age people first had sex
Sexual Behavior - Average number of female sex partners in lifetime (males 18+)
Sexual Behavior - Average number of female vaginal sex partners in lifetime (males 18+)
Sexual Behavior - Average age people first performed oral sex on a woman (18+)
Sexual Behavior - Average number of woman performed oral sex on in lifetime (18+)
Sexual Behavior - Average number of male sex partners in lifetime (males 18+)
Sexual Behavior - Average number of male anal sex partners in lifetime (males 18+)
Sexual Behavior - Average age people first performed oral sex on a man (18+)
Sexual Behavior - Average number of male oral sex partners in lifetime (18+)
Sexual Behavior - People using protection when performing oral sex (%)
Sexual Behavior - Average number of times people have vaginal or anal sex a year
Sexual Behavior - People having sex without condom (%)
Sexual Behavior - Average number of male sex partners in lifetime (females 18+)
Sexual Behavior - Average number of male vaginal sex partners in lifetime (females 18+)
Sexual Behavior - Average number of female sex partners in lifetime (females 18+)
Sexual Behavior - Circumcised males 18+ (%)
Sleep Disorders - Average hours sleeping at night
Sleep Disorders - People that has trouble sleeping (%)
Smoking-Cigarette Use - People smoking cigarettes (%)
Taste & Smell - People 40+ having problems with smell (%)
Taste & Smell - People 40+ having problems with taste (%)
Taste & Smell - People 40+ that ever had wisdom teeth removed (%)
Taste & Smell - People 40+ that ever had tonsils teeth removed (%)
Taste & Smell - People 40+ that ever had a loss of consciousness because of a head injury (%)
Taste & Smell - People 40+ that ever had a broken nose or other serious injury to face or skull (%)
Taste & Smell - People 40+ that ever had two or more sinus infections (%)
Weight - Average height (inches)
Weight - Average weight (pounds)
Weight - Average BMI
Weight - People that are obese (%)
Weight - People that ever were obese (%)
Weight - People trying to lose weight (%)
100%
urban population.
Estimated median house/condo value in 2022: $229,487
45219:
$229,487Ohio:
$204,100
According to our research of Ohio and other state lists, there were 24 registered sex offenders living in 45219 zip code as of April 27, 2024 . The ratio of all residents to sex offenders in zip code 45219 is 771 to 1.The ratio of registered sex offenders to all residents in this zip code is lower than the state average.
Median resident age: This zip code:
21.7 yearsOhio median age:
39.9 years
Average household size: This zip code:
2.2 peopleOhio:
2.4 people
Averages for the 2020 tax year for zip code 45219, filed in 2021:
Average Adjusted Gross Income (AGI) in 2020: $35,836 (Individual Income Tax Returns) Here:
$35,836State:
$67,288
Salary/wage: $31,111 (reported on 90.9% of returns )Here:
$31,111State:
$55,628
(% of AGI for various income ranges: 1196.7% for AGIs below $25k , 3751.0% for AGIs $25k-50k , 6684.3% for AGIs $50k-75k , 9966.9% for AGIs $75k-100k , 15644.2% for AGIs $100k-200k ) Taxable interest for individuals: $334 (reported on 12.8% of returns )This zip code:
$334Ohio:
$1,518
(% of AGI for various income ranges: 1.3% for AGIs below $25k , 3.3% for AGIs $25k-50k , 12.0% for AGIs $50k-75k , 16.2% for AGIs $75k-100k , 42.5% for AGIs $100k-200k ) Ordinary dividends: $3,185 (reported on 11.5% of returns )(% of AGI for various income ranges: 5.0% for AGIs below $25k , 16.3% for AGIs $25k-50k , 135.7% for AGIs $50k-75k , 98.5% for AGIs $75k-100k , 483.3% for AGIs $100k-200k ) Net capital gain/loss in AGI: +$9,756 (reported on 11.7% of returns )Here:
+$9,756State:
+$18,919
(% of AGI for various income ranges: 5.5% for AGIs below $25k , 20.1% for AGIs $25k-50k , 120.7% for AGIs $50k-75k , 213.8% for AGIs $75k-100k , 1299.2% for AGIs $100k-200k ) Profit/loss from business: +$7,350 (reported on 13.5% of returns )Here:
+$7,350State:
+$13,744
(% of AGI for various income ranges: 56.3% for AGIs below $25k , 75.9% for AGIs $25k-50k , 260.0% for AGIs $50k-75k , 455.4% for AGIs $75k-100k , 1019.2% for AGIs $100k-200k ) Taxable individual retirement arrangement distribution: $13,592 (reported on 2.6% of returns )45219:
$13,592Ohio:
$18,876
(% of AGI for various income ranges: 10.6% for AGIs below $25k , 43.5% for AGIs $25k-50k , 236.9% for AGIs $75k-100k , 554.2% for AGIs $100k-200k ) Total itemized deductions: $24,770 (reported on 2.2% of returns )Here:
$24,770State:
$33,869
(% of AGI for various income ranges: 303.3% for AGIs $50k-75k , 1305.8% for AGIs $100k-200k ) Charity contributions: $10,586 (reported on 1.5% of returns )Here:
$10,586State:
$14,577
(% of AGI for various income ranges: 70.3% for AGIs $50k-75k , 441.7% for AGIs $100k-200k ) Taxes paid: $6,570 (reported on 2.2% of returns )(% of AGI for various income ranges: 80.7% for AGIs $50k-75k , 345.8% for AGIs $100k-200k ) Earned income credit: $1,759 (reported on 16.5% of returns )(% of AGI for various income ranges: 45.5% for AGIs below $25k , 36.2% for AGIs $25k-50k ) Percentage of individuals using paid preparers for their 2020 taxes: 94.1%(% for various income ranges: 94.5% for AGIs below $25k , 95.0% for AGIs $25k-50k , 90.2% for AGIs $50k-75k , 94.7% for AGIs $75k-100k , 90.0% for AGIs $100k-200k , 100.0% for AGIs over 200k )
Averages for the 2012 tax year for zip code 45219, filed in 2013:
Average Adjusted Gross Income (AGI) in 2012: $28,228 (Individual Income Tax Returns) Here:
$28,228State:
$54,926
Salary/wage: $25,405 (reported on 90.4% of returns )Here:
$25,405State:
$45,869
(% of AGI for various income ranges: 88.3% for AGIs below $25k , 87.2% for AGIs $25k-50k , 81.4% for AGIs $50k-75k , 83.3% for AGIs $75k-100k , 79.9% for AGIs $100k-200k , 53.8% for AGIs over 200k ) Taxable interest for individuals: $484 (reported on 14.5% of returns )This zip code:
$484Ohio:
$1,297
(% of AGI for various income ranges: 0.3% for AGIs below $25k , 0.2% for AGIs $25k-50k , 0.3% for AGIs $50k-75k , 0.2% for AGIs $75k-100k , 0.3% for AGIs $100k-200k , 0.2% for AGIs over 200k ) Ordinary dividends: $2,680 (reported on 10.5% of returns )(% of AGI for various income ranges: 0.8% for AGIs below $25k , 0.5% for AGIs $25k-50k , 1.3% for AGIs $50k-75k , 0.9% for AGIs $75k-100k , 1.5% for AGIs $100k-200k , 1.8% for AGIs over 200k ) Net capital gain/loss in AGI: +$5,213 (reported on 7.2% of returns )Here:
+$5,213State:
+$11,232
(% of AGI for various income ranges: 0.2% for AGIs below $25k , 0.3% for AGIs $25k-50k , 0.9% for AGIs $50k-75k , 0.2% for AGIs $75k-100k , 1.4% for AGIs $100k-200k , 7.3% for AGIs over 200k ) Profit/loss from business: +$9,465 (reported on 12.6% of returns )Here:
+$9,465State:
+$12,773
(% of AGI for various income ranges: 7.0% for AGIs below $25k , 3.1% for AGIs $25k-50k , 3.8% for AGIs $50k-75k , 5.0% for AGIs $75k-100k , 4.6% for AGIs $100k-200k ) Taxable individual retirement arrangement distribution: $8,885 (reported on 3.0% of returns )(% of AGI for various income ranges: 0.7% for AGIs below $25k , 1.0% for AGIs $25k-50k , 1.5% for AGIs $50k-75k , 3.0% for AGIs $75k-100k ) Total itemized deductions: $16,570 (19% of AGI, reported on 11.7% of returns )Here:
$16,570State:
$21,278
Here:
19.3% of AGIState:
18.8% of AGI
(% of AGI for various income ranges: 2.8% for AGIs below $25k , 4.2% for AGIs $25k-50k , 8.6% for AGIs $50k-75k , 11.3% for AGIs $75k-100k , 11.8% for AGIs $100k-200k , 11.5% for AGIs over 200k ) Charity contributions: $3,387 (reported on 8.9% of returns )(% of AGI for various income ranges: 0.2% for AGIs below $25k , 0.6% for AGIs $25k-50k , 1.2% for AGIs $50k-75k , 1.8% for AGIs $75k-100k , 2.5% for AGIs $100k-200k , 1.7% for AGIs over 200k ) Taxes paid: $7,122 (reported on 11.4% of returns )(% of AGI for various income ranges: 0.5% for AGIs below $25k , 1.3% for AGIs $25k-50k , 3.4% for AGIs $50k-75k , 4.7% for AGIs $75k-100k , 5.8% for AGIs $100k-200k , 7.0% for AGIs over 200k ) Earned income credit: $2,202 (reported on 24.7% of returns )(% of AGI for various income ranges: 6.3% for AGIs below $25k , 0.9% for AGIs $25k-50k ) Percentage of individuals using paid preparers for their 2012 taxes: 34.3%(% for various income ranges: 31.4% for AGIs below $25k , 34.8% for AGIs $25k-50k , 41.9% for AGIs $50k-75k , 50.0% for AGIs $75k-100k , 50.0% for AGIs $100k-200k , 75.0% for AGIs over 200k )
Averages for the 2004 tax year for zip code 45219, filed in 2005:
Average Adjusted Gross Income (AGI) in 2004: $21,761 (Individual Income Tax Returns) Here:
$21,761State:
$44,480
Salary/wage: $21,048 (reported on 91.6% of returns )Here:
$21,048State:
$39,198
(% of AGI for various income ranges: 102.0% for AGIs below $10k , 90.5% for AGIs $10k-25k , 91.5% for AGIs $25k-50k , 85.0% for AGIs $50k-75k , 89.8% for AGIs $75k-100k , 65.4% for AGIs over 100k ) Taxable interest for individuals: $534 (reported on 18.1% of returns )This zip code:
$534Ohio:
$1,532
(% of AGI for various income ranges: 0.5% for AGIs below $10k , 0.3% for AGIs $10k-25k , 0.4% for AGIs $25k-50k , 0.7% for AGIs $50k-75k , 0.5% for AGIs $75k-100k , 0.7% for AGIs over 100k ) Taxable dividends: $1,620 (reported on 10.3% of returns )(% of AGI for various income ranges: 1.0% for AGIs below $10k , 0.4% for AGIs $10k-25k , 0.6% for AGIs $25k-50k , 1.0% for AGIs $50k-75k , 0.8% for AGIs $75k-100k , 2.0% for AGIs over 100k ) Net capital gain/loss: +$2,626 (reported on 7.1% of returns )Here:
+$2,626State:
+$8,582
(% of AGI for various income ranges: 0.6% for AGIs below $10k , 0.3% for AGIs $10k-25k , 0.5% for AGIs $25k-50k , 1.2% for AGIs $50k-75k , -0.2% for AGIs $75k-100k , 4.5% for AGIs over 100k ) Profit/loss from business: +$6,241 (reported on 9.7% of returns )Here:
+$6,241State:
+$10,813
(% of AGI for various income ranges: 3.2% for AGIs below $10k , 3.2% for AGIs $10k-25k , 1.8% for AGIs $25k-50k , 3.0% for AGIs $50k-75k , -0.3% for AGIs $75k-100k , 6.9% for AGIs over 100k ) IRA payment deduction: $1,788 (reported on 1.2% of returns )Self-employed pension: $5,400 (reported on 0.2% of returns )Total itemized deductions: $10,669 (26% of AGI, reported on 17.9% of returns )Here:
$10,669State:
$17,503
Here:
25.8% of AGIState:
20.8% of AGI
(% of AGI for various income ranges: 8.2% for AGIs below $10k , 5.6% for AGIs $10k-25k , 7.2% for AGIs $25k-50k , 13.4% for AGIs $50k-75k , 15.1% for AGIs $75k-100k , 13.4% for AGIs over 100k ) Charity contributions deductions: $2,540 (4% of AGI, reported on 9.5% of returns )Here:
4.4% of AGIState:
3.4% of AGI
(% of AGI for various income ranges: 0.2% for AGIs below $10k , 0.4% for AGIs $10k-25k , 1.0% for AGIs $25k-50k , 2.1% for AGIs $50k-75k , 2.5% for AGIs $75k-100k , 1.9% for AGIs over 100k ) Total tax: $2,733 (reported on 64.0% of returns )(% of AGI for various income ranges: 1.8% for AGIs below $10k , 4.3% for AGIs $10k-25k , 8.0% for AGIs $25k-50k , 11.0% for AGIs $50k-75k , 12.6% for AGIs $75k-100k , 17.4% for AGIs over 100k ) Earned income credit: $1,820 (reported on 24.6% of returns )Percentage of individuals using paid preparers for their 2004 taxes: 40.7%(% for various income ranges: 35.1% for AGIs below $10k , 42.7% for AGIs $10k-25k , 44.3% for AGIs $25k-50k , 44.9% for AGIs $50k-75k , 36.7% for AGIs $75k-100k , 53.6% for AGIs over 100k )
Estimated median household income in 2022: This zip code:
$34,327Ohio:
$65,720
Nearest zip codes: 45202 ,
45220 ,
45214 ,
45206 ,
45203 ,
45229 .
Cincinnati Zip Code Map
Percentage of family households: This zip code:
14.0%Ohio:
43.3%
Percentage of households with unmarried partners: This zip code:
5.4%Ohio:
44.6%
Likely homosexual households (counted as self-reported same-sex unmarried-partner households)
Lesbian couples: 0.4% of all households Gay men: 0.2% of all households
Household received Food Stamps/SNAP in the past 12 months: 348Household did not receive Food Stamps/SNAP in the past 12 months: 6,676
Women who had a birth in the past 12 months: 90 (92 now married , 0 unmarried) Women who did not have a birth in the past 12 months: 7,875 (473 now married , 7,411 unmarried)
Housing units in zip code 45219 with a mortgage: 653 (51
second mortgage , 49
both second mortgage and home equity loan )
Median monthly owner costs for units with a mortgage: $1,301
Median monthly owner costs for units without a mortgage: $497
Residents with income below the poverty level in 2022:
This zip code:
47.6%Whole state:
13.4%
Residents with income below 50% of the poverty level in 2022:
This zip code:
18.7%Whole state:
7.0%
Median number of rooms in houses and condos: Median number of rooms in apartments: Notable locations in this zip code not listed on our city pages
Click to draw/clear zip code borders Notable locations in zip code 45219: (A) , Zimmer Hall (B) , Wilson Auditorium (C) , Tanner Hall (D) , Tangeman University Center (E) , Swift Hall (F) , Siddall Hall (G) , Scioto Hall (H) , Dieterle Center (I) , Sawyer Hall (J) , Rhodes Hall (K) , Procter Hall (L) , Patricia Corbett Pavilion (M) , Myrl H Shoemaker Center (N) , Myers Alumni Center (O) , Morgens Hall (P) , Memorial Hall (Q) , McMicken Hall (R) , Lindner Hall (S) , Laws Auditorium (T) . Display/hide their locations on the map
Shopping Center: (1) . Display/hide its location on the map
Churches in zip code 45219 include: (A) , Peoples Tabernacle Baptist Church (B) , First Wesleyan Church (C) , Deliverance Temple Church (D) , New Unity Baptist Church (E) , Saint Mark Missionary Baptist Church (F) , First Baptist Church of Mount Auburn (G) , Lutheran Church of the Cross (H) , Korean United Methodist Church (I) . Display/hide their locations on the map
Parks in zip code 45219 include: (1) , William Howard Taft National Historic Site (2) , Burnett Woods (3) , Bellevue Hill Park (4) , Pecks Cliff Park (5) , Hopkins Park (6) , William H Taft Historical Site (7) , Mecklenburgs Garden (8) , Over-the-Rhine Historic District (9) . Display/hide their locations on the map
Tourist attraction (not listed on the city page) :
Year house built (houses)
0 2020 or later1,410 2010 to 2019702 2000 to 2009219 1990 to 1999502 1980 to 1989533 1970 to 1979523 1960 to 1969465 1950 to 1959221 1940 to 19493,695 1939 or earlier
Zip code 45219 household income distribution in 2022 1,177 Less than $10,000390 $10,000 to $14,999519 $15,000 to $19,999547 $20,000 to $24,999516 $25,000 to $29,999444 $30,000 to $34,999417 $35,000 to $39,999528 $40,000 to $44,999332 $45,000 to $49,999346 $50,000 to $59,999466 $60,000 to $74,999622 $75,000 to $99,999313 $100,000 to $124,999143 $125,000 to $149,999179 $150,000 to $199,999167 $200,000 or moreEstimate of home value of owner-occupied houses/condos in 2022 in zip code 45219 4 $15,000 to $19,99934 $50,000 to $59,9995 $60,000 to $69,99941 $70,000 to $79,99934 $80,000 to $89,99933 $90,000 to $99,99979 $100,000 to $124,99945 $125,000 to $149,99979 $150,000 to $174,99972 $175,000 to $199,999188 $200,000 to $249,999146 $250,000 to $299,999151 $300,000 to $399,99995 $400,000 to $499,99921 $500,000 to $749,999Rent paid by renters in 2022 in zip code 45219 13 $200 to $24910 $250 to $2994 $300 to $34968 $350 to $399204 $400 to $44936 $450 to $499447 $500 to $54989 $550 to $599340 $600 to $649236 $650 to $699291 $700 to $749325 $750 to $799638 $800 to $899361 $900 to $999831 $1,000 to $1,249788 $1,250 to $1,499707 $1,500 to $1,999401 $2,000 to $2,499117 $2,500 to $2,99930 $3,000 to $3,49944 $3,500 or more146 No cash rent
Median gross rent in 2022: $1,122.
Median price asked for vacant for-sale houses and condos in 2022: $233,049.
Estimated median house (or condo) value in 2022 for: White Non-Hispanic householders: $269,712Black or African American householders: $187,525Two or more races householders: $209,808Hispanic or Latino householders: $94,052Estimated median house or condo value in 2022: $229,487
45219:
$229,487Ohio:
$204,100
Lower value quartile - upper value quartile: $129,750 - $320,061
Mean price in 2022: Detached houses: $295,443Here:
$295,443State:
$254,366
Townhouses or other attached units: $173,427Here:
$173,427State:
$225,733
In 2-unit structures: $314,748Here:
$314,748State:
$144,384
In 3-to-4-unit structures: $2,246,460Here:
$2,246,460State:
$203,002
In 5-or-more-unit structures: $79,404Here:
$79,404State:
$211,593
Housing units in structures:
One, detached: 1,834One, attached: 523Two: 9693 or 4: 1,1245 to 9: 76310 to 19: 57120 to 49: 69350 or more: 1,698Unemployment : 5.9%
Means of transportation to work in zip code 45219 60.0% 6,306 Drove a car alone6.4% 678 Carpooled3.9% 414 Bus or trolley bus0.1% 9 Streetcar or trolley car1.1% 115 Taxi0.6% 62 Bicycle14.6% 1,537 Walked0.4% 45 Other means12.4% 1,305 Worked at homeTravel time to work (commute) in zip code 45219 434 Less than 5 minutes1,344 5 to 9 minutes1,983 10 to 14 minutes1,618 15 to 19 minutes1,068 20 to 24 minutes895 25 to 29 minutes1,142 30 to 34 minutes87 35 to 39 minutes172 40 to 44 minutes246 45 to 59 minutes87 60 to 89 minutes111 90 or more minutes
Neighborhoods in zip code 45219: Percentage of zip code residents living and working in this county: 77.5%
Household type by relationship:
Households: 19,474
Male householders: 3,471 (1,403 living alone ), Female householders: 3,570 (1,535 living alone )580 spouses (551 opposite-sex spouses ), 736 unmarried partners , (677 opposite-sex unmarried partners ), 1,008 children (917 natural , 54 adopted , 39 stepchildren ), 109 grandchildren , 132 brothers or sisters , 61 parents , 0 foster children , 118 other relatives , 5,593 non-relatives In group quarters: 3,662 (-1 institutionalized population )
Size of family households: 646 2-persons , 296 3-persons , 166 4-persons , 94 5-persons , 11 6-persons , 6 7-or-more-persons
Size of nonfamily households: 2,937 1-person , 1,485 2-persons , 599 3-persons , 567 4-persons , 392 5-persons , 140 6-persons , 51 7-or-more-persons
374 married couples with children. single-parent households (109 men , 430 women ).
88.0% of residents of 45219 zip code speak English at home. of residents speak Spanish at home (52% very well, 15% well, 26% not well, 7% not at all ).of residents speak other Indo-European language at home (85% very well, 15% well ).of residents speak Asian or Pacific Island language at home (56% very well, 24% well, 20% not well ).of residents speak other language at home (68% very well, 2% well, 18% not well, 12% not at all ).
Foreign born population: 1,828 (9.4%)
(33.6%
of them are naturalized citizens )
This zip code:
9.4%Whole state:
5.0%
14% Bhutan 11% El Salvador 6% Haiti 4% Mexico 4% Turkey 4% China, excluding Hong Kong and Taiwan 4% Malaysia 19% German 6% English 6% Irish 5% Italian 4% European 3% American 2% Polish
Year of entry for the foreign-born population
1,505 2010 or later 328 2000 to 2009 165 1990 to 1999 198 Before 1990
There are
354 Internal Medicine Specialists 114 Nurse Practitioners 107 Psychiatry & Neurology Specialists 106 Nurse Anesthetists 84 Anesthesiologists 73 Physician Assistants 807 Other Medical Specialists in Zip Code 45219.
Facilities with environmental interests located in this zip code:
BP OIL CO SITE 09065 (126 W MCMILLAN in CINCINNATI, OH)
(Resource Conservation and Recovery Act (tracking hazardous waste)) Organizations: BP OIL COMPANY (CONTACT/OWNER)
Housing units lacking complete plumbing facilities: 1.6%
Housing units lacking complete kitchen facilities: 1.8%
49.1% Utility gas 47.3% Electricity 2.4% Bottled, tank, or LP gas 0.8% No fuel used
Population in 1990: 21,619.
Place of birth for U.S.-born residents:
This state: 12,355Northeast: 826Midwest: 1,387South: 2,463West: 365
29% of the 45219 zip code residents lived in the same house 5 years ago.
Out of people who lived in different houses, 53% lived in this county.
Out of people who lived in different counties, 50% lived in Ohio.
67% of the 45219 zip code residents lived in the same house 1 year ago.
Out of people who lived in different houses, 35% moved from this county.
Out of people who lived in different houses, 17% moved from different county within same state.
Out of people who lived in different houses, 39% moved from different state.
Out of people who lived in different houses, 6% moved from abroad.
Private vs. public school enrollment:
Students in private schools in grades 1 to 8 (elementary and middle school): 84
Students in private schools in grades 9 to 12 (high school): 65
Students in private undergraduate colleges: 588
Occupation by median earnings in the past 12 months ($)
73,678 Health diagnosing and treating practitioners and other technical occupations 50,405 Installation, maintenance, and repair occupations 50,330 Business and financial operations occupations 38,027 Management occupations 35,414 Community and social service occupations 32,268 Construction and extraction occupations
Companies with federal contracts located in this zip code (CINCINNATI, OH):
STERLING MEDICALCORPORATION (411 OAK STREET SUITE 200) in 5 contracts from 2003 to 2004
Contracts for General Health Care Services, Radiology Services by Department of Veterans Affairs, ArmySigned by year: 2000: $0; 2001: $0; 2002: $0; 2003: $1,617,541; 2004: -$197,848; 2005: $0; 2006: $0.
Biggest contracts: with Department of Veterans Affairs for General Health Care Services. Taking place in NC. Signed on 2003-10-02. Effective on 2003-11-01. Completion date: 2004-09-30.
with Army for Radiology Services. Taking place in WA. Signed on 2003-10-16. Completion date: 2003-09-30.
, same as above. Signed on 2003-03-26. Completion date: 2003-09-30.
with Department of Veterans Affairs for General Health Care Services. Taking place in NC. Signed on 2003-10-02. Effective on 2003-11-01. Completion date: 2004-09-30.
SILOAM BIOSCIENCES LLC (3130 HIGHLAND AVENUE; small business) in 3 contracts from 2004 to 2006
$361,408 with Army for Other Medical -- Basic Research (R&D). Taking place in CA. Signed on 2006-01-26. Completion date: 2005-07-13.
, same as above. Signed on 2004-12-08. Completion date: 2005-07-13.
, same as above. Signed on 2006-01-26. Completion date: 2005-07-13.
IMPACT SERVICES, INC (3000 VERNON PLACE; small business) in 2 contracts in 2005
$49,285 with Army for Maintenance, Repair or Alteration of Real Property -- Miscellaneous Buildings. Taking place in KY. Signed on 2005-06-28. Completion date: 2005-01-26.
, same as above. Signed on 2005-09-30. Completion date: 2005-01-26.
EXECUTIVE BUILDING LIMITED PAR (400 OAK ST; small business) in 3 contracts from 2003 to 2005
$12,000 with Air Force for Lease or Rental of Facilities -- Conference Space and Facilities. Signed on 2005-09-19. Completion date: 2005-10-08.
with Bureau of Alcohol, Tobacco, Firearms and Explosives for Lease or Rental of Facilities -- Other Non-Building Facilities. Signed on 2003-10-27. Effective on 2003-10-01. Completion date: 2004-09-30.
, same as above. Signed on 2004-03-22. Effective on 2004-03-02. Completion date: 2004-09-30.
PATRICIA NORTH (621 CLEMMER AVE APT 13; small business)
$2,628 with Army for Musical Instruments. Signed on 2003-04-25. Completion date: 2003-05-27.
Top industries in this zip code by the number of employees in 2005:
Health Care and Social Assistance: General Medical and Surgical Hospitals (over 1000 employees: 2 establishments, 500-999 employees: 1 establishment)Health Care and Social Assistance: Offices of Physicians (except Mental Health Specialists) (500-999: 1, 250-499: 1, 100-249: 1, 50-99: 6, 20-49: 13, 10-19: 10, 5-9: 28, 1-4: 33)Accommodation and Food Services: Full-Service Restaurants (50-99: 3, 20-49: 6, 10-19: 4, 5-9: 1, 1-4: 3)Accommodation and Food Services: Limited-Service Restaurants (20-49: 7, 10-19: 5, 5-9: 3, 1-4: 10)Accommodation and Food Services: Hotels (except Casino Hotels) and Motels (100-249: 1, 50-99: 1)Information: Radio Stations (100-249: 1, 20-49: 1, 10-19: 1, 5-9: 2, 1-4: 3)Health Care and Social Assistance: Kidney Dialysis Centers (100-249: 1, 20-49: 1)Educational Services: Professional and Management Development Training (100-249: 1, 10-19: 1)
People in group quarters in 2010:
2,768 people in college/university student housing
113 people in nursing facilities/skilled-nursing facilities
79 people in correctional facilities intended for juveniles
75 people in residential treatment centers for adults
62 people in group homes intended for adults
17 people in emergency and transitional shelters (with sleeping facilities) for people experiencing homelessness
14 people in residential treatment centers for juveniles (non-correctional)
12 people in other noninstitutional facilities
People in group quarters in 2000:
1,936 people in college dormitories (includes college quarters off campus)
169 people in short-term care, detention or diagnostic centers for delinquent children
140 people in nursing homes
106 people in other types of correctional institutions
63 people in homes or halfway houses for drug/alcohol abuse
52 people in mental (psychiatric) hospitals or wards
40 people in halfway houses
37 people in other nonhousehold living situations
23 people in other noninstitutional group quarters
15 people in training schools for juvenile delinquents
5 people in homes for the mentally ill
Fatal accident statistics in 2014:
Fatal accident count: 1Vehicles involved in fatal accidents: 3Fatal accidents caused by drunken drivers: 1Fatalities: 1Persons involved in fatal accidents: 3Pedestrians involved in fatal accidents: 0
Fatal accident statistics in 2010:
Fatal accident count: 1Vehicles involved in fatal accidents: 2Fatal accidents caused by drunken drivers: 0Fatalities: 1Persons involved in fatal accidents: 3Pedestrians involved in fatal accidents: 0
Home Mortgage Disclosure Act Aggregated Statistics For Year 2009(Based on 6 full and 12 partial tracts) A) FHA, FSA/RHS & VA B) Conventional C) Refinancings D) Home Improvement Loans E) Loans on Dwellings For 5+ Families F) Non-occupant Loans on Number Average Value Number Average Value Number Average Value Number Average Value Number Average Value Number Average Value
LOANS ORIGINATED 45 $118,628 67 $97,909 150 $128,082 8 $22,411 5 $404,676 71 $92,775 APPLICATIONS APPROVED, NOT ACCEPTED 4 $56,388 13 $63,931 18 $147,385 6 $25,788 2 $380,280 16 $45,725 APPLICATIONS DENIED 13 $143,957 17 $108,694 116 $115,358 35 $34,816 0 $0 45 $93,256 APPLICATIONS WITHDRAWN 7 $73,219 3 $172,397 39 $119,131 4 $44,338 0 $0 9 $104,129 FILES CLOSED FOR INCOMPLETENESS 4 $102,148 1 $40,000 13 $134,400 0 $0 0 $0 0 $0
Aggregated Statistics For Year 2008(Based on 6 full and 12 partial tracts) A) FHA, FSA/RHS & VA B) Conventional C) Refinancings D) Home Improvement Loans E) Loans on Dwellings For 5+ Families F) Non-occupant Loans on G) Loans On Manufactured Number Average Value Number Average Value Number Average Value Number Average Value Number Average Value Number Average Value Number Average Value
LOANS ORIGINATED 25 $95,509 115 $123,104 110 $111,028 10 $121,526 10 $661,816 117 $107,188 0 $0 APPLICATIONS APPROVED, NOT ACCEPTED 2 $322,450 16 $152,016 15 $112,110 0 $0 2 $348,425 11 $138,199 0 $0 APPLICATIONS DENIED 28 $101,890 31 $106,323 127 $117,077 63 $41,413 3 $274,707 79 $93,697 1 $18,000 APPLICATIONS WITHDRAWN 7 $126,166 18 $138,643 50 $113,469 2 $34,845 0 $0 22 $97,015 0 $0 FILES CLOSED FOR INCOMPLETENESS 0 $0 2 $60,910 14 $84,456 1 $59,520 1 $1,050,000 6 $97,390 0 $0
Aggregated Statistics For Year 2007(Based on 6 full and 12 partial tracts) A) FHA, FSA/RHS & VA B) Conventional C) Refinancings D) Home Improvement Loans E) Loans on Dwellings For 5+ Families F) Non-occupant Loans on G) Loans On Manufactured Number Average Value Number Average Value Number Average Value Number Average Value Number Average Value Number Average Value Number Average Value
LOANS ORIGINATED 21 $91,518 215 $109,415 210 $105,251 15 $77,533 6 $762,402 204 $110,255 0 $0 APPLICATIONS APPROVED, NOT ACCEPTED 4 $52,410 47 $103,543 46 $121,610 8 $39,140 2 $64,490 47 $101,698 2 $16,730 APPLICATIONS DENIED 6 $87,563 68 $95,236 217 $114,741 62 $31,098 6 $261,662 118 $94,278 3 $7,917 APPLICATIONS WITHDRAWN 0 $0 34 $114,796 52 $111,183 6 $33,713 2 $807,900 35 $103,995 0 $0 FILES CLOSED FOR INCOMPLETENESS 0 $0 15 $112,474 15 $95,861 1 $11,660 2 $234,940 15 $99,255 0 $0
Aggregated Statistics For Year 2006(Based on 6 full and 12 partial tracts) A) FHA, FSA/RHS & VA B) Conventional C) Refinancings D) Home Improvement Loans E) Loans on Dwellings For 5+ Families F) Non-occupant Loans on Number Average Value Number Average Value Number Average Value Number Average Value Number Average Value Number Average Value
LOANS ORIGINATED 21 $108,019 333 $116,391 283 $111,882 40 $46,024 21 $606,936 263 $95,816 APPLICATIONS APPROVED, NOT ACCEPTED 3 $123,990 43 $79,980 77 $89,654 12 $41,832 0 $0 37 $90,983 APPLICATIONS DENIED 2 $85,720 134 $102,068 246 $110,220 58 $25,868 5 $565,644 135 $99,706 APPLICATIONS WITHDRAWN 1 $86,520 50 $103,901 105 $99,782 7 $76,689 0 $0 63 $95,185 FILES CLOSED FOR INCOMPLETENESS 0 $0 16 $95,967 29 $92,640 0 $0 0 $0 12 $88,838
Aggregated Statistics For Year 2005(Based on 6 full and 12 partial tracts) A) FHA, FSA/RHS & VA B) Conventional C) Refinancings D) Home Improvement Loans E) Loans on Dwellings For 5+ Families F) Non-occupant Loans on G) Loans On Manufactured Number Average Value Number Average Value Number Average Value Number Average Value Number Average Value Number Average Value Number Average Value
LOANS ORIGINATED 19 $103,061 382 $110,516 329 $113,358 37 $26,481 29 $489,717 336 $101,814 0 $0 APPLICATIONS APPROVED, NOT ACCEPTED 2 $77,045 44 $93,050 42 $96,818 16 $54,909 3 $318,727 33 $82,832 0 $0 APPLICATIONS DENIED 8 $103,219 147 $104,101 288 $103,574 58 $31,988 2 $159,280 162 $104,274 1 $24,610 APPLICATIONS WITHDRAWN 7 $127,764 55 $97,859 133 $110,905 12 $81,857 3 $220,743 59 $112,587 1 $114,000 FILES CLOSED FOR INCOMPLETENESS 1 $181,060 24 $105,041 21 $139,023 2 $36,415 0 $0 21 $138,401 0 $0
Aggregated Statistics For Year 2004(Based on 6 full and 12 partial tracts) A) FHA, FSA/RHS & VA B) Conventional C) Refinancings D) Home Improvement Loans E) Loans on Dwellings For 5+ Families F) Non-occupant Loans on G) Loans On Manufactured Number Average Value Number Average Value Number Average Value Number Average Value Number Average Value Number Average Value Number Average Value
LOANS ORIGINATED 22 $124,237 381 $107,996 423 $101,350 51 $68,060 22 $414,565 396 $98,056 1 $47,000 APPLICATIONS APPROVED, NOT ACCEPTED 2 $80,635 46 $87,703 86 $107,109 12 $36,184 0 $0 53 $94,278 0 $0 APPLICATIONS DENIED 5 $170,198 119 $135,008 231 $94,918 35 $42,375 6 $380,933 145 $112,948 2 $48,495 APPLICATIONS WITHDRAWN 7 $96,543 52 $101,945 119 $88,370 5 $29,428 3 $1,465,260 43 $92,380 0 $0 FILES CLOSED FOR INCOMPLETENESS 2 $82,675 24 $111,537 28 $105,126 1 $5,660 0 $0 16 $105,906 0 $0
Aggregated Statistics For Year 2003(Based on 6 full and 12 partial tracts) A) FHA, FSA/RHS & VA B) Conventional C) Refinancings D) Home Improvement Loans E) Loans on Dwellings For 5+ Families F) Non-occupant Loans on Number Average Value Number Average Value Number Average Value Number Average Value Number Average Value Number Average Value
LOANS ORIGINATED 23 $112,494 298 $101,897 577 $92,091 39 $19,264 17 $618,811 350 $91,774 APPLICATIONS APPROVED, NOT ACCEPTED 6 $93,997 48 $84,515 122 $88,318 13 $19,995 3 $2,593,720 72 $87,302 APPLICATIONS DENIED 8 $98,660 71 $94,757 282 $88,411 55 $28,831 1 $68,000 96 $91,204 APPLICATIONS WITHDRAWN 3 $111,840 36 $99,237 124 $90,679 2 $5,975 3 $206,947 55 $86,744 FILES CLOSED FOR INCOMPLETENESS 5 $112,618 12 $94,138 46 $95,807 4 $74,655 0 $0 10 $94,624
Aggregated Statistics For Year 2002(Based on 6 full and 12 partial tracts) A) FHA, FSA/RHS & VA B) Conventional C) Refinancings D) Home Improvement Loans E) Loans on Dwellings For 5+ Families F) Non-occupant Loans on Number Average Value Number Average Value Number Average Value Number Average Value Number Average Value Number Average Value
LOANS ORIGINATED 27 $98,938 247 $95,706 476 $88,839 33 $22,546 32 $361,282 320 $88,987 APPLICATIONS APPROVED, NOT ACCEPTED 7 $80,761 54 $101,270 127 $82,157 5 $34,984 0 $0 42 $87,761 APPLICATIONS DENIED 6 $139,775 95 $92,256 220 $77,854 67 $20,749 0 $0 70 $85,911 APPLICATIONS WITHDRAWN 2 $77,555 45 $112,328 138 $77,986 7 $13,993 0 $0 41 $104,320 FILES CLOSED FOR INCOMPLETENESS 10 $122,221 21 $105,553 27 $97,834 1 $44,100 0 $0 14 $81,481
Aggregated Statistics For Year 2001(Based on 6 full and 12 partial tracts) A) FHA, FSA/RHS & VA B) Conventional C) Refinancings D) Home Improvement Loans E) Loans on Dwellings For 5+ Families F) Non-occupant Loans on Number Average Value Number Average Value Number Average Value Number Average Value Number Average Value Number Average Value
LOANS ORIGINATED 45 $102,998 255 $86,520 396 $87,238 54 $21,059 22 $520,401 241 $86,688 APPLICATIONS APPROVED, NOT ACCEPTED 1 $169,000 21 $71,889 70 $80,724 14 $31,536 2 $74,345 16 $65,836 APPLICATIONS DENIED 4 $69,685 90 $66,526 305 $70,243 67 $11,174 2 $457,705 67 $69,328 APPLICATIONS WITHDRAWN 4 $79,598 40 $98,719 131 $81,577 8 $7,942 2 $567,755 21 $103,268 FILES CLOSED FOR INCOMPLETENESS 3 $90,290 6 $74,845 23 $84,263 0 $0 1 $696,000 8 $85,148
Aggregated Statistics For Year 2000(Based on 6 full and 12 partial tracts) A) FHA, FSA/RHS & VA B) Conventional C) Refinancings D) Home Improvement Loans E) Loans on Dwellings For 5+ Families F) Non-occupant Loans on Number Average Value Number Average Value Number Average Value Number Average Value Number Average Value Number Average Value
LOANS ORIGINATED 44 $85,915 203 $79,153 201 $77,373 51 $19,181 20 $355,816 156 $83,201 APPLICATIONS APPROVED, NOT ACCEPTED 3 $85,400 17 $67,898 84 $91,868 18 $7,907 0 $0 9 $122,458 APPLICATIONS DENIED 5 $69,946 92 $59,917 213 $72,439 75 $18,486 3 $200,743 74 $66,263 APPLICATIONS WITHDRAWN 8 $81,921 34 $79,273 90 $64,065 7 $32,319 2 $179,805 18 $76,629 FILES CLOSED FOR INCOMPLETENESS 0 $0 4 $54,610 34 $71,307 0 $0 0 $0 1 $98,750
Aggregated Statistics For Year 1999(Based on 4 full and 6 partial tracts) A) FHA, FSA/RHS & VA B) Conventional C) Refinancings D) Home Improvement Loans E) Loans on Dwellings For 5+ Families F) Non-occupant Loans on Number Average Value Number Average Value Number Average Value Number Average Value Number Average Value Number Average Value
LOANS ORIGINATED 17 $86,625 114 $73,491 168 $74,936 28 $15,991 10 $395,473 121 $75,323 APPLICATIONS APPROVED, NOT ACCEPTED 2 $85,260 29 $52,207 71 $64,598 10 $19,816 0 $0 15 $66,975 APPLICATIONS DENIED 3 $67,960 62 $63,328 142 $85,899 59 $11,120 0 $0 46 $74,093 APPLICATIONS WITHDRAWN 7 $83,470 20 $80,254 70 $74,550 2 $20,505 1 $117,660 13 $59,361 FILES CLOSED FOR INCOMPLETENESS 0 $0 1 $46,500 22 $74,194 0 $0 0 $0 4 $69,720
Private Mortgage Insurance Companies Aggregated Statistics For Year 2009(Based on 3 full and 6 partial tracts) A) Conventional B) Refinancings Number Average Value Number Average Value
LOANS ORIGINATED 3 $184,967 4 $98,265 APPLICATIONS APPROVED, NOT ACCEPTED 4 $205,815 2 $97,560 APPLICATIONS DENIED 0 $0 0 $0 APPLICATIONS WITHDRAWN 0 $0 0 $0 FILES CLOSED FOR INCOMPLETENESS 0 $0 0 $0
Aggregated Statistics For Year 2008(Based on 6 full and 12 partial tracts) A) Conventional B) Refinancings C) Non-occupant Loans on Number Average Value Number Average Value Number Average Value
LOANS ORIGINATED 33 $113,976 14 $104,513 24 $112,883 APPLICATIONS APPROVED, NOT ACCEPTED 22 $108,295 7 $109,560 11 $107,140 APPLICATIONS DENIED 6 $90,207 1 $72,000 4 $63,750 APPLICATIONS WITHDRAWN 1 $95,000 0 $0 0 $0 FILES CLOSED FOR INCOMPLETENESS 2 $71,655 2 $228,130 2 $228,130
Aggregated Statistics For Year 2007(Based on 6 full and 12 partial tracts) A) Conventional B) Refinancings C) Non-occupant Loans on Number Average Value Number Average Value Number Average Value
LOANS ORIGINATED 84 $115,914 18 $126,848 37 $120,429 APPLICATIONS APPROVED, NOT ACCEPTED 14 $120,525 3 $151,317 6 $148,155 APPLICATIONS DENIED 2 $71,655 2 $170,305 2 $170,305 APPLICATIONS WITHDRAWN 5 $88,876 6 $81,198 3 $104,293 FILES CLOSED FOR INCOMPLETENESS 0 $0 0 $0 0 $0
Aggregated Statistics For Year 2006(Based on 6 full and 10 partial tracts) A) Conventional B) Refinancings C) Non-occupant Loans on Number Average Value Number Average Value Number Average Value
LOANS ORIGINATED 36 $112,760 14 $115,705 14 $105,291 APPLICATIONS APPROVED, NOT ACCEPTED 5 $101,976 4 $112,728 5 $110,530 APPLICATIONS DENIED 0 $0 1 $156,100 1 $109,770 APPLICATIONS WITHDRAWN 3 $101,323 2 $127,425 2 $84,615 FILES CLOSED FOR INCOMPLETENESS 0 $0 0 $0 0 $0
Aggregated Statistics For Year 2005(Based on 6 full and 12 partial tracts) A) Conventional B) Refinancings C) Non-occupant Loans on Number Average Value Number Average Value Number Average Value
LOANS ORIGINATED 49 $96,300 26 $135,457 31 $101,902 APPLICATIONS APPROVED, NOT ACCEPTED 8 $94,142 9 $102,864 10 $103,303 APPLICATIONS DENIED 4 $95,882 4 $119,575 8 $107,729 APPLICATIONS WITHDRAWN 0 $0 1 $136,160 1 $113,000 FILES CLOSED FOR INCOMPLETENESS 0 $0 1 $55,690 0 $0
Aggregated Statistics For Year 2004(Based on 6 full and 12 partial tracts) A) Conventional B) Refinancings C) Non-occupant Loans on Number Average Value Number Average Value Number Average Value
LOANS ORIGINATED 69 $108,328 30 $108,421 61 $106,283 APPLICATIONS APPROVED, NOT ACCEPTED 14 $95,648 4 $88,268 7 $50,716 APPLICATIONS DENIED 3 $38,527 1 $104,000 2 $65,500 APPLICATIONS WITHDRAWN 6 $102,510 5 $81,578 7 $97,357 FILES CLOSED FOR INCOMPLETENESS 2 $145,105 3 $127,003 2 $155,505
Aggregated Statistics For Year 2003(Based on 6 full and 12 partial tracts) A) Conventional B) Refinancings C) Non-occupant Loans on Number Average Value Number Average Value Number Average Value
LOANS ORIGINATED 81 $103,674 37 $121,845 32 $94,477 APPLICATIONS APPROVED, NOT ACCEPTED 26 $87,905 29 $85,583 18 $86,347 APPLICATIONS DENIED 1 $154,000 1 $172,670 0 $0 APPLICATIONS WITHDRAWN 3 $98,303 4 $81,862 3 $78,503 FILES CLOSED FOR INCOMPLETENESS 0 $0 0 $0 0 $0
Aggregated Statistics For Year 2002(Based on 6 full and 12 partial tracts) A) Conventional B) Refinancings C) Non-occupant Loans on Number Average Value Number Average Value Number Average Value
LOANS ORIGINATED 65 $102,001 32 $101,540 29 $82,549 APPLICATIONS APPROVED, NOT ACCEPTED 14 $94,084 12 $97,818 16 $84,384 APPLICATIONS DENIED 2 $141,520 0 $0 2 $141,520 APPLICATIONS WITHDRAWN 5 $96,312 5 $90,110 3 $61,497 FILES CLOSED FOR INCOMPLETENESS 3 $167,667 0 $0 0 $0
Aggregated Statistics For Year 2001(Based on 6 full and 12 partial tracts) A) Conventional B) Refinancings C) Non-occupant Loans on Number Average Value Number Average Value Number Average Value
LOANS ORIGINATED 87 $92,454 36 $100,838 43 $82,467 APPLICATIONS APPROVED, NOT ACCEPTED 18 $95,931 11 $90,401 6 $84,670 APPLICATIONS DENIED 4 $121,608 4 $93,032 3 $90,377 APPLICATIONS WITHDRAWN 2 $72,655 3 $55,360 0 $0 FILES CLOSED FOR INCOMPLETENESS 6 $93,612 0 $0 2 $117,335
Aggregated Statistics For Year 2000(Based on 6 full and 12 partial tracts) A) Conventional B) Refinancings C) Non-occupant Loans on Number Average Value Number Average Value Number Average Value
LOANS ORIGINATED 60 $83,290 19 $80,585 29 $77,727 APPLICATIONS APPROVED, NOT ACCEPTED 10 $80,144 0 $0 1 $94,000 APPLICATIONS DENIED 2 $97,435 2 $63,935 2 $63,935 APPLICATIONS WITHDRAWN 1 $71,720 1 $76,000 1 $50,600 FILES CLOSED FOR INCOMPLETENESS 2 $165,255 0 $0 0 $0
Aggregated Statistics For Year 1999(Based on 4 full and 5 partial tracts) A) Conventional B) Refinancings C) Non-occupant Loans on Number Average Value Number Average Value Number Average Value
LOANS ORIGINATED 35 $76,729 9 $77,916 16 $61,998 APPLICATIONS APPROVED, NOT ACCEPTED 3 $83,350 0 $0 2 $50,025 APPLICATIONS DENIED 4 $85,360 0 $0 0 $0 APPLICATIONS WITHDRAWN 0 $0 0 $0 0 $0 FILES CLOSED FOR INCOMPLETENESS 1 $228,910 0 $0 0 $0
2002 - 2018 National Fire Incident Reporting System (NFIRS) incidents See full 2006 National Fire Incident Reporting System statistics for zip code 45219, Ohio
Most common first names in zip code 45219 among deceased individuals Name Count Lived (average)
William 162 74.6 years John 140 72.5 years Mary 131 77.6 years James 116 68.7 years Charles 102 72.0 years Robert 100 67.7 years George 80 75.7 years Joseph 53 72.2 years Edward 46 72.9 years Frank 46 75.1 years
Most common last names in zip code 45219 among deceased individuals Last name Count Lived (average)
Williams 72 71.7 years Smith 60 69.7 years Johnson 57 72.5 years Brown 49 73.8 years Jones 40 72.9 years Jackson 39 74.3 years Thomas 37 68.5 years Davis 31 71.7 years Harris 31 71.5 years Walker 26 69.7 years
Businesses in zip code 45219
Name Count Name Count
Arby's 1 Panera Bread 1 Blockbuster 1 Papa John's Pizza 1 Buffalo Wild Wings 1 Pizza Hut 1 CVS 1 Quiznos 1 Chipotle 2 Starbucks 3 Cricket Wireless 1 Subway 1 FedEx 4 T-Mobile 1 Foot Locker 1 Taco Bell 1 GameStop 1 UPS 3 Kroger 1 Urban Outfitters 1 Marriott 1 Walgreens 1 Nike 2
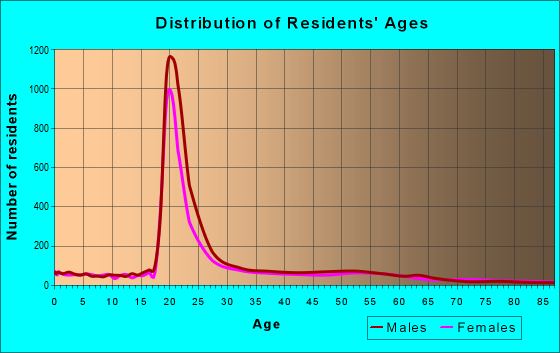
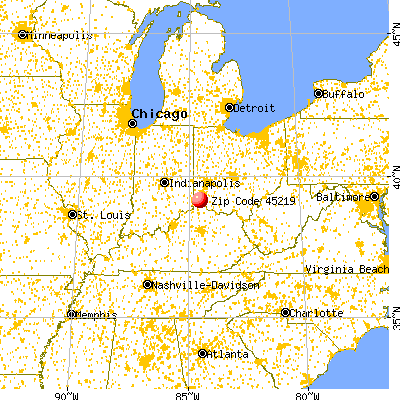


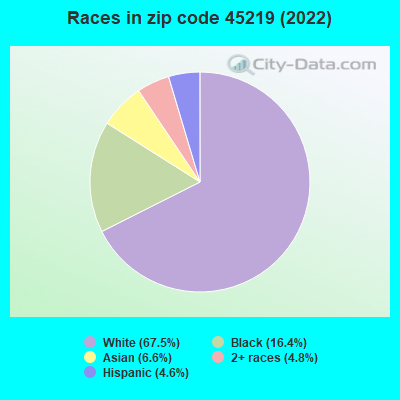


 Nearest zip codes: 45202, 45220, 45214, 45206, 45203, 45229.
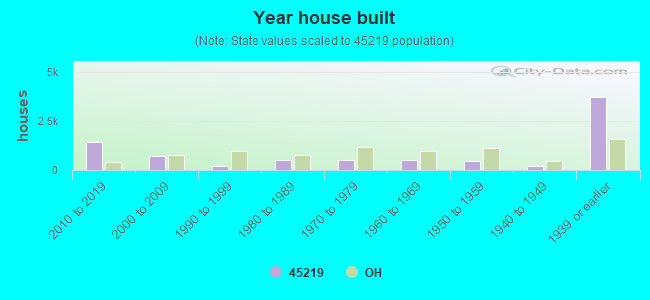

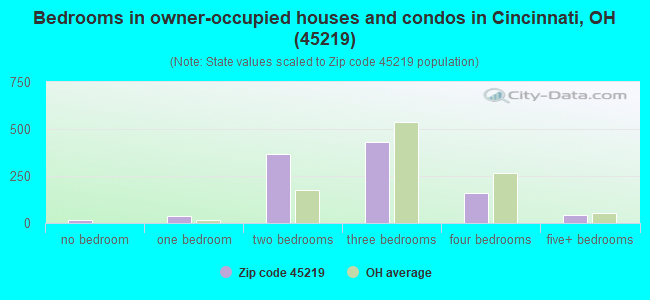
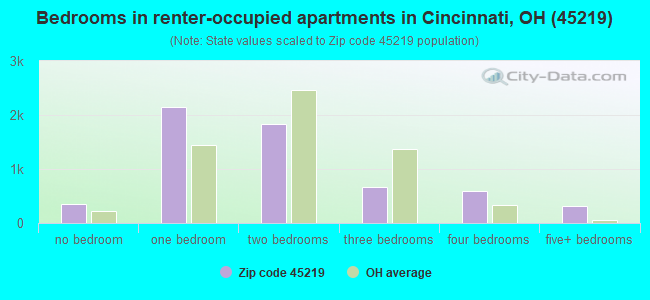
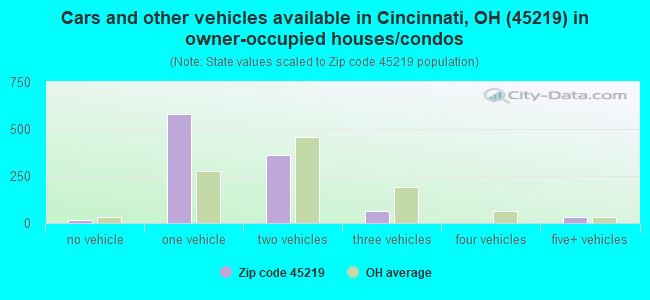
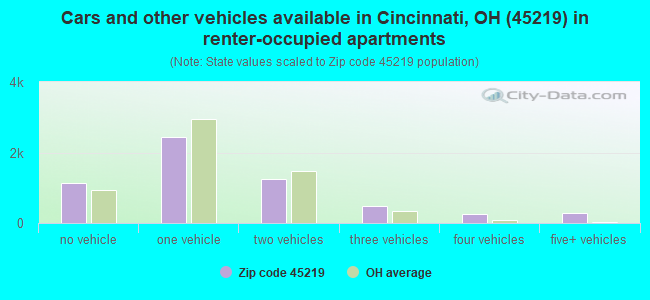


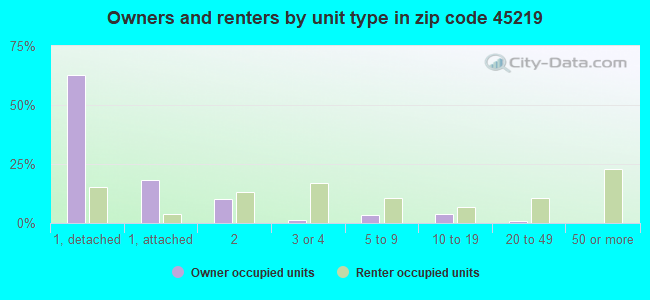
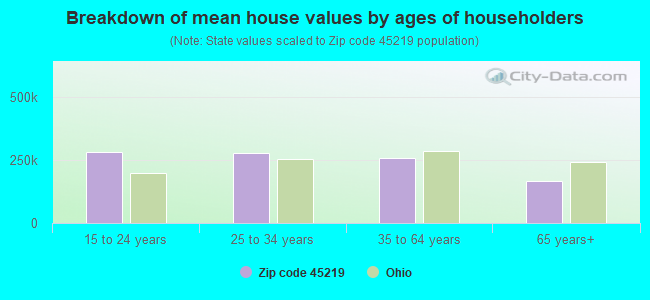


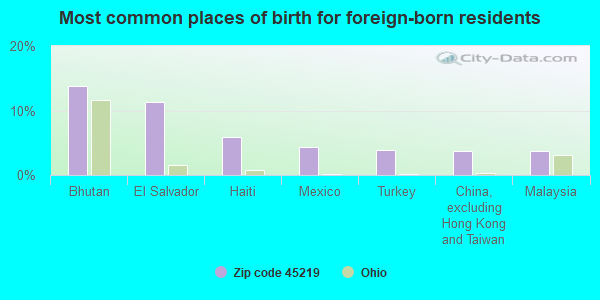
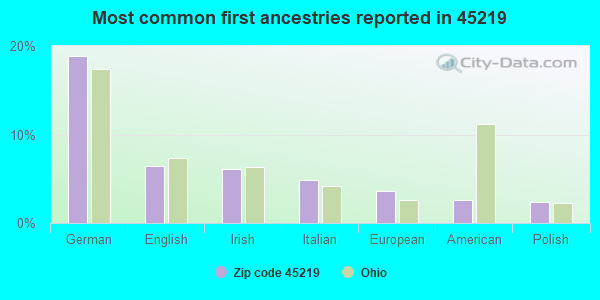
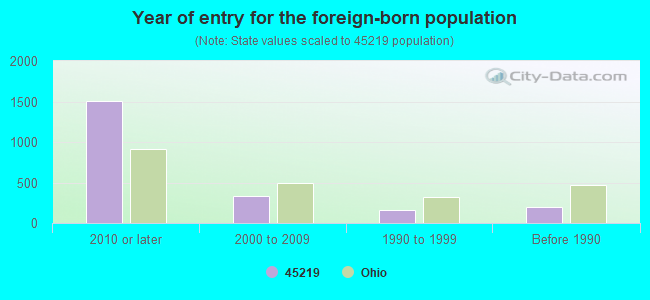


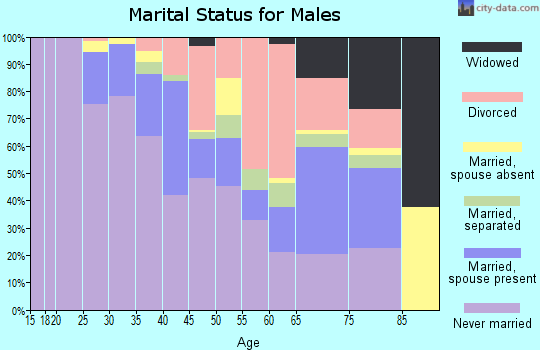
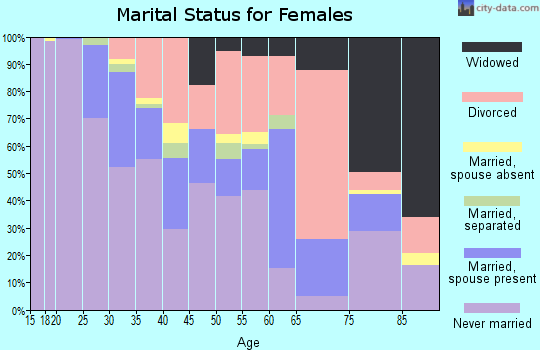
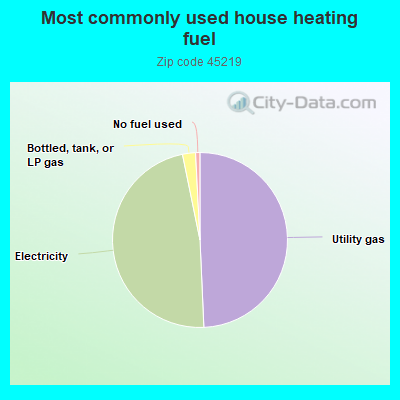
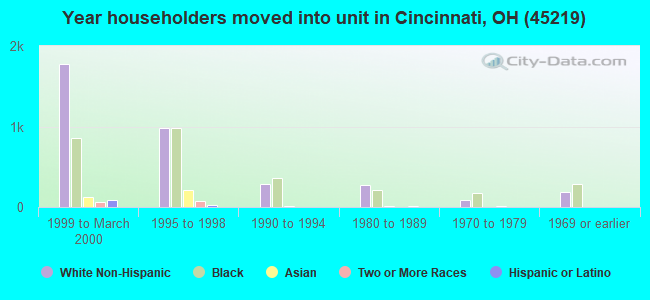
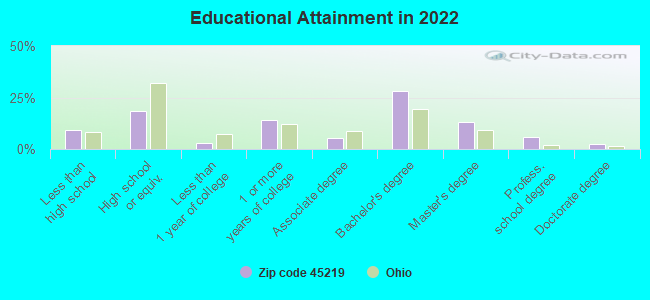
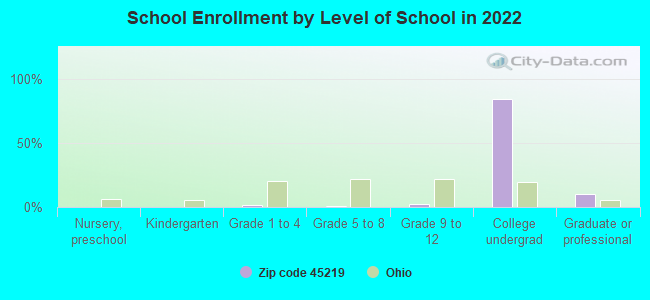
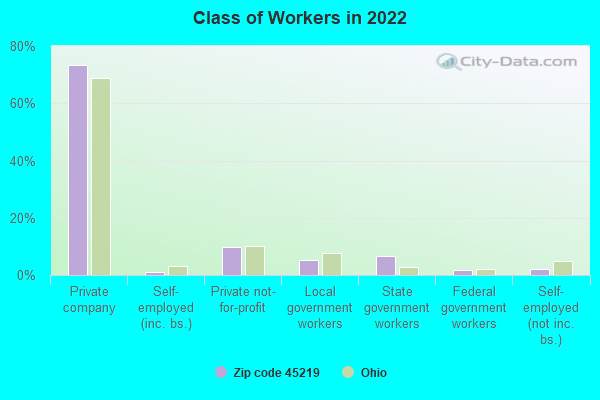
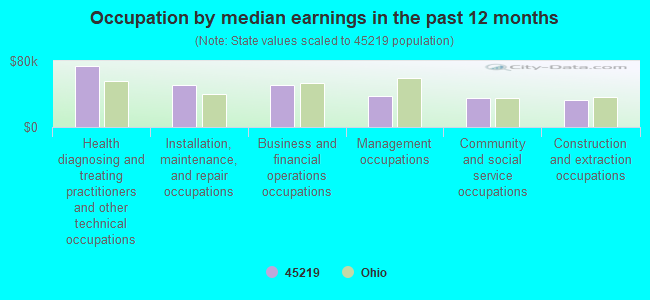
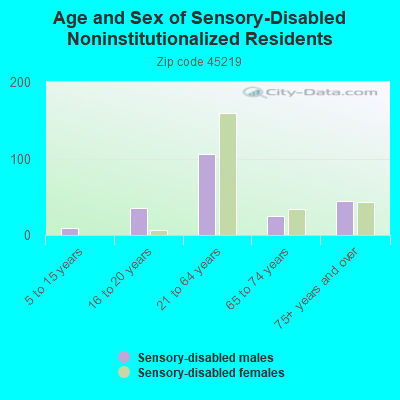
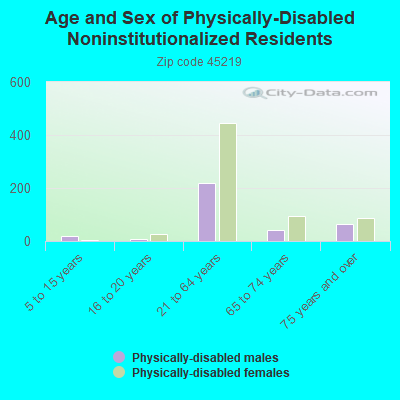
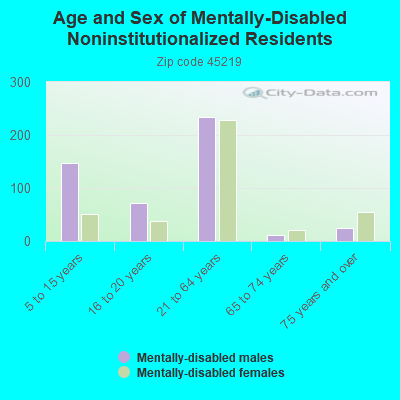
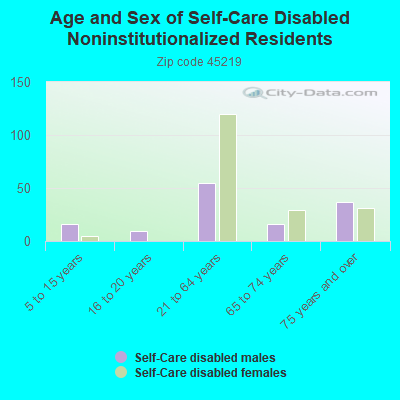
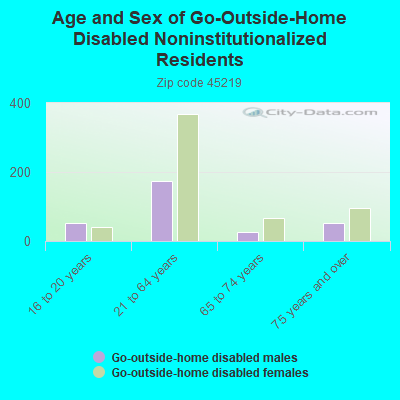
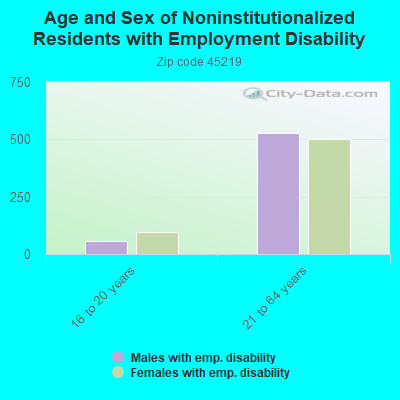
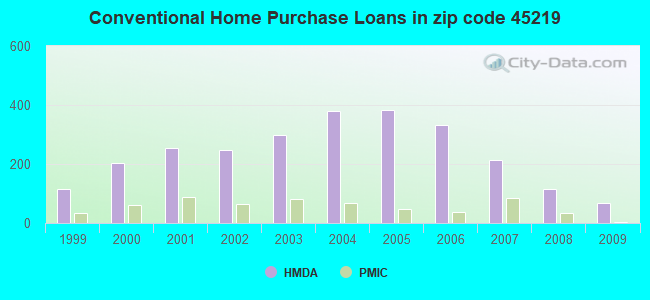
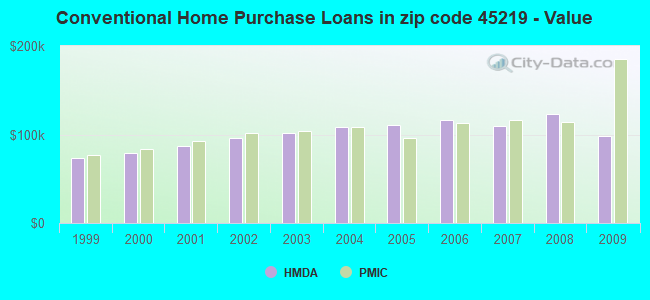
 Based on the data from the years 2002 - 2018 the average number of fires per year is 95. The highest number of fire incidents - 188 took place in 2007, and the least - 29 in 2002. The data has a rising trend.
 When looking into fire subcategories, the most reports belonged to: Outside Fires (33.4%), and Structure Fires (30.5%).