Estimated zip code population in 2022: 8,950 Zip code population in 2010: 8,738 Zip code population in 2000: 11,213
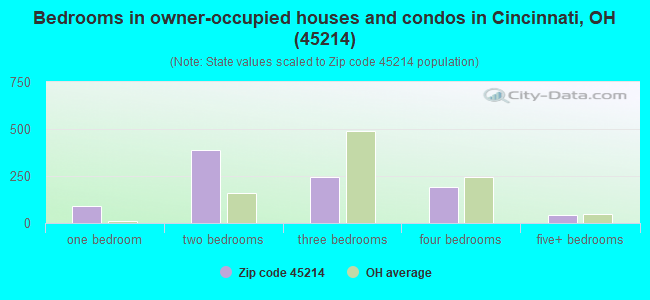
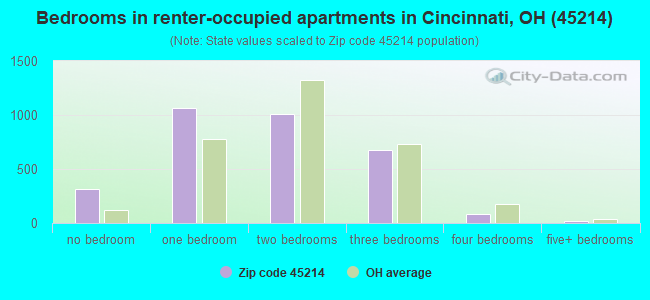
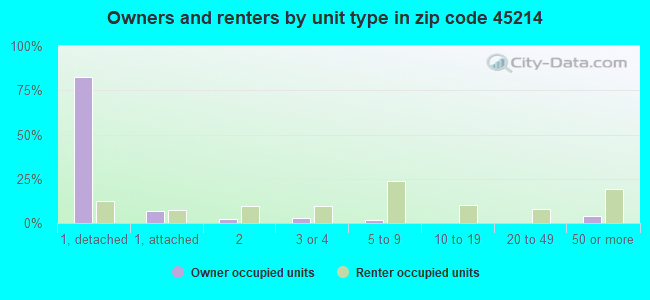
Houses and condos: 5,172 Renter-occupied apartments: 3,156
% of renters here:
77%
State:
33%
March 2022 cost of living index in zip code 45214: 88.2 (less than average, U.S. average is 100)
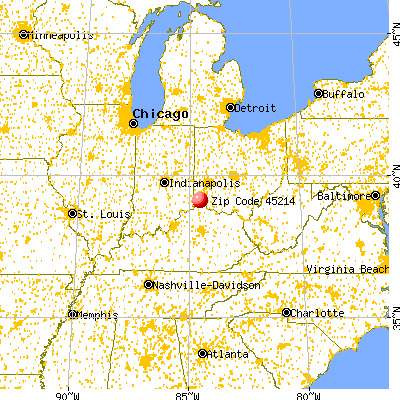
Land area: 2.3 sq. mi. Water area: 0.0 sq. mi.
Population density: 3,934 people per square mile
(average).
OSM Map
General Map
Google Map
MSN Map
OSM Map
General Map
Google Map
MSN Map
OSM Map
General Map
Google Map
MSN Map
OSM Map
General Map
Google Map
MSN Map
Please wait while loading the map...
Real estate property taxes paid for housing units in 2022:
This zip code:
1.6% ($1,514)
Ohio:
1.3% ($2,639)
Median real estate property taxes paid for housing units with mortgages in 2022: $1,941 (1.8%) Median real estate property taxes paid for housing units with no mortgage in 2022: $1,308 (1.6%)
Averages for the 2020 tax year for zip code 45214, filed in 2021:
Average Adjusted Gross Income (AGI) in 2020: $29,270 (Individual Income Tax Returns)
Here:
$29,270
State:
$67,288
Salary/wage: $26,277 (reported on 89.3% of returns)
Here:
$26,277
State:
$55,628
(% of AGI for various income ranges: 1098.7% for AGIs below $25k, 3463.0% for AGIs $25k-50k, 6712.2% for AGIs $50k-75k, 10066.0% for AGIs $75k-100k, 32056.0% for AGIs $100k-200k)
Taxable interest for individuals: $305 (reported on 6.3% of returns)
This zip code:
$305
Ohio:
$1,518
(% of AGI for various income ranges: 0.2% for AGIs below $25k, 1.5% for AGIs $25k-50k, 4.4% for AGIs $50k-75k, 84.0% for AGIs $100k-200k)
Ordinary dividends: $2,179 (reported on 4.0% of returns)
Here:
$2,179
State:
$7,167
(% of AGI for various income ranges: 1.8% for AGIs below $25k, 2.9% for AGIs $25k-50k, 21.1% for AGIs $50k-75k, 424.0% for AGIs $100k-200k)
Net capital gain/loss in AGI: +$2,562 (reported on 3.7% of returns)
Here:
+$2,562
State:
+$18,919
(% of AGI for various income ranges: 0.1% for AGIs below $25k, 33.3% for AGIs $50k-75k, 550.0% for AGIs $100k-200k)
Profit/loss from business: +$9,686 (reported on 12.1% of returns)
Here:
+$9,686
State:
+$13,744
(% of AGI for various income ranges: 108.1% for AGIs below $25k, 81.9% for AGIs $25k-50k, 416.1% for AGIs $50k-75k, 1480.0% for AGIs $100k-200k)
Taxable individual retirement arrangement distribution: $5,050 (reported on 1.7% of returns)
45214:
$5,050
Ohio:
$18,876
(% of AGI for various income ranges: 6.3% for AGIs below $25k, 23.0% for AGIs $25k-50k)
Total itemized deductions: $20,167 (reported on 1.7% of returns)
Here:
$20,167
State:
$33,869
(% of AGI for various income ranges: 260.0% for AGIs $50k-75k, 1484.0% for AGIs $100k-200k)
Charity contributions: $6,467 (reported on 0.9% of returns)
Here:
$6,467
State:
$14,577
(% of AGI for various income ranges: 388.0% for AGIs $100k-200k)
Taxes paid: $7,333 (reported on 1.7% of returns)
45214:
$7,333
State:
$7,681
(% of AGI for various income ranges: 86.7% for AGIs $50k-75k, 568.0% for AGIs $100k-200k)
Earned income credit: $2,797 (reported on 44.7% of returns)
Here:
$2,797
State:
$2,304
(% of AGI for various income ranges: 194.7% for AGIs below $25k, 110.5% for AGIs $25k-50k)
Percentage of individuals using paid preparers for their 2020 taxes: 94.2%
Here:
94%
State:
94%
(% for various income ranges: 94.6% for AGIs below $25k, 94.1% for AGIs $25k-50k, 92.0% for AGIs $50k-75k, 85.7% for AGIs $75k-100k, 100.0% for AGIs $100k-200k, 100.0% for AGIs over 200k)
Averages for the 2012 tax year for zip code 45214, filed in 2013:
Average Adjusted Gross Income (AGI) in 2012: $24,529 (Individual Income Tax Returns)
Here:
$24,529
State:
$54,926
Salary/wage: $23,299 (reported on 88.4% of returns)
Here:
$23,299
State:
$45,869
(% of AGI for various income ranges: 82.5% for AGIs below $25k, 90.8% for AGIs $25k-50k, 81.6% for AGIs $50k-75k, 71.6% for AGIs $75k-100k, 80.5% for AGIs $100k-200k, 82.0% for AGIs over 200k)
Taxable interest for individuals: $579 (reported on 7.5% of returns)
This zip code:
$579
Ohio:
$1,297
(% of AGI for various income ranges: 0.2% for AGIs below $25k, 1.0% for AGIs $75k-100k, 0.2% for AGIs $100k-200k)
Ordinary dividends: $1,413 (reported on 4.7% of returns)
Here:
$1,413
State:
$5,821
(% of AGI for various income ranges: 0.1% for AGIs below $25k, 0.1% for AGIs $25k-50k, 0.4% for AGIs $50k-75k, 1.7% for AGIs $100k-200k)
Profit/loss from business: +$9,079 (reported on 13.5% of returns)
Here:
+$9,079
State:
+$12,773
(% of AGI for various income ranges: 11.5% for AGIs below $25k, 0.9% for AGIs $25k-50k, 5.9% for AGIs $50k-75k)
Taxable individual retirement arrangement distribution: $6,260 (reported on 1.6% of returns)
45214:
$6,260
Ohio:
$14,511
(% of AGI for various income ranges: 0.3% for AGIs below $25k, 1.0% for AGIs $25k-50k)
Total itemized deductions: $17,548 (20% of AGI, reported on 7.2% of returns)
Here:
$17,548
State:
$21,278
Here:
19.8% of AGI
State:
18.8% of AGI
(% of AGI for various income ranges: 1.8% for AGIs below $25k, 3.2% for AGIs $25k-50k, 8.2% for AGIs $50k-75k, 8.0% for AGIs $75k-100k, 12.5% for AGIs $100k-200k, 11.8% for AGIs over 200k)
Charity contributions: $3,000 (reported on 4.4% of returns)
Here:
$3,000
State:
$3,943
(% of AGI for various income ranges: 0.6% for AGIs $25k-50k, 2.0% for AGIs $50k-75k, 1.6% for AGIs $100k-200k)
Taxes paid: $6,452 (reported on 7.2% of returns)
45214:
$6,452
State:
$9,568
(% of AGI for various income ranges: 0.3% for AGIs below $25k, 0.8% for AGIs $25k-50k, 2.3% for AGIs $50k-75k, 3.2% for AGIs $75k-100k, 5.7% for AGIs $100k-200k, 6.6% for AGIs over 200k)
Earned income credit: $2,786 (reported on 50.8% of returns)
Here:
$2,786
State:
$2,285
(% of AGI for various income ranges: 14.7% for AGIs below $25k, 1.8% for AGIs $25k-50k)
Percentage of individuals using paid preparers for their 2012 taxes: 39.5%
Here:
39%
State:
51%
(% for various income ranges: 38.2% for AGIs below $25k, 40.3% for AGIs $25k-50k, 35.7% for AGIs $50k-75k, 50.0% for AGIs $75k-100k, 60.0% for AGIs $100k-200k, 100.0% for AGIs over 200k)
Averages for the 2004 tax year for zip code 45214, filed in 2005:
Average Adjusted Gross Income (AGI) in 2004: $20,325 (Individual Income Tax Returns)
Here:
$20,325
State:
$44,480
Salary/wage: $18,786 (reported on 92.3% of returns)
Here:
$18,786
State:
$39,198
(% of AGI for various income ranges: 94.0% for AGIs below $10k, 91.1% for AGIs $10k-25k, 92.1% for AGIs $25k-50k, 82.3% for AGIs $50k-75k, 74.9% for AGIs $75k-100k, 39.6% for AGIs over 100k)
Taxable interest for individuals: $559 (reported on 10.5% of returns)
This zip code:
$559
Ohio:
$1,532
(% of AGI for various income ranges: 0.5% for AGIs below $10k, 0.3% for AGIs $10k-25k, 0.2% for AGIs $25k-50k, 0.8% for AGIs $50k-75k, 0.1% for AGIs $75k-100k, 0.1% for AGIs over 100k)
Taxable dividends: $804 (reported on 5.7% of returns)
Here:
$804
State:
$3,496
(% of AGI for various income ranges: 0.4% for AGIs below $10k, 0.1% for AGIs $10k-25k, 0.3% for AGIs $25k-50k, 0.2% for AGIs $50k-75k, 0.2% for AGIs $75k-100k, 0.2% for AGIs over 100k)
Net capital gain/loss: +$296 (reported on 2.6% of returns)
Here:
+$296
State:
+$8,582
(% of AGI for various income ranges: -0.1% for AGIs below $10k, -0.0% for AGIs $10k-25k, -0.0% for AGIs $25k-50k, 0.6% for AGIs $50k-75k, -0.2% for AGIs $75k-100k)
Profit/loss from business: +$5,653 (reported on 8.6% of returns)
Here:
+$5,653
State:
+$10,813
(% of AGI for various income ranges: 6.1% for AGIs below $10k, 2.7% for AGIs $10k-25k, 1.6% for AGIs $25k-50k, 4.2% for AGIs $50k-75k)
IRA payment deduction: $704 (reported on 0.9% of returns)
45214:
$704
Ohio:
$2,794
Total itemized deductions: $13,056 (23% of AGI, reported on 8.5% of returns)
Here:
$13,056
State:
$17,503
Here:
22.6% of AGI
State:
20.8% of AGI
(% of AGI for various income ranges: 1.8% for AGIs $10k-25k, 5.2% for AGIs $25k-50k, 10.1% for AGIs $50k-75k, 13.5% for AGIs $75k-100k, 14.2% for AGIs over 100k)
Charity contributions deductions: $2,363 (4% of AGI, reported on 6.1% of returns)
Here:
$2,363
State:
$3,087
Here:
4.4% of AGI
State:
3.4% of AGI
(% of AGI for various income ranges: 0.3% for AGIs $10k-25k, 0.9% for AGIs $25k-50k, 1.3% for AGIs $50k-75k, 1.5% for AGIs $75k-100k, 0.8% for AGIs over 100k)
Total tax: $2,995 (reported on 48.2% of returns)
45214:
$2,995
State:
$6,781
(% of AGI for various income ranges: 1.5% for AGIs below $10k, 2.7% for AGIs $10k-25k, 6.4% for AGIs $25k-50k, 10.8% for AGIs $50k-75k, 14.6% for AGIs $75k-100k, 22.0% for AGIs over 100k)
Earned income credit: $2,076 (reported on 50.0% of returns)
Here:
$2,076
State:
$1,696
Percentage of individuals using paid preparers for their 2004 taxes: 60.1%
Here:
60%
State:
55%
(% for various income ranges: 57.1% for AGIs below $10k, 65.3% for AGIs $10k-25k, 55.8% for AGIs $25k-50k, 54.3% for AGIs $50k-75k, 51.2% for AGIs $75k-100k, 75.0% for AGIs over 100k)
Likely homosexual households (counted as self-reported same-sex unmarried-partner households)
Lesbian couples: 0.2% of all households
Gay men: 0.0% of all households
Household received Food Stamps/SNAP in the past 12 months: 2,052 Household did not receive Food Stamps/SNAP in the past 12 months: 2,141
Women who had a birth in the past 12 months: 139 (26 now married, 109 unmarried) Women who did not have a birth in the past 12 months: 1,949 (336 now married, 1,614 unmarried)
Housing units in zip code 45214 with a mortgage: 434 (14 second mortgage, 13 both second mortgage and home equity loan) Median monthly owner costs for units with a mortgage: $1,030 Median monthly owner costs for units without a mortgage: $320
Residents with income below the poverty level in 2022:
This zip code:
51.3%
Whole state:
13.4%
Residents with income below 50% of the poverty level in 2022:
This zip code:
31.2%
Whole state:
7.0%
Median number of rooms in houses and condos:
Here:
5.7
State:
6.7
Median number of rooms in apartments:
Here:
3.7
State:
4.4
Notable locations in this zip code not listed on our city pages
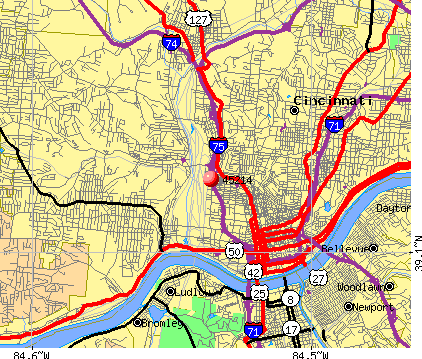
Notable locations in zip code 45214: Queensgate North Industrial Park (A), District 1 Police Station (B), Cincinnati Fire Department Engine and Truck 29 (C), Center for Chemical Addictions Treatment (D), Crosley Telecommunications Center (E), Number 29 Engine House (F). Display/hide their locations on the map
Churches in zip code 45214 include: Mount Tabor Baptist Church (A), Beams of Heaven Baptist Church (B), Provident Baptist Church (C), Saint Mark Christian Fellowship Church of God in Christ (D), York Street United Methodist Church (E), Bethesda Baptist Church (F), Maranatha Seventh Day Adventist Church (G), Mount Olive Baptist Church (H), Freeman Avenue United Church of Christ (I). Display/hide their locations on the map
Parks in zip code 45214 include: Laurel Recreation Area (1), Mohawk Park (2), McMicken-Klotter Playground (3), Hanna Playground (4), Sands Playground (5), Laurel Homes Historic District (6), Dayton Street Historic District (7), Laurel Playground (8), Dyer Park (9). Display/hide their locations on the map
Tourist attraction (not listed on the city page) : Hauck House Museum (Cultural Attractions- Events- & Facilities; 812 Dayton Street).
246 married couples with children.
2,057 single-parent households (112 men, 1,945 women).
96.0% of residents of 45214 zip code speak English at home.
1.5% of residents speak Spanish at home (100% very well).
1.5% of residents speak other Indo-European language at home (100% very well).
0.2% of residents speak Asian or Pacific Island language at home (100% very well).
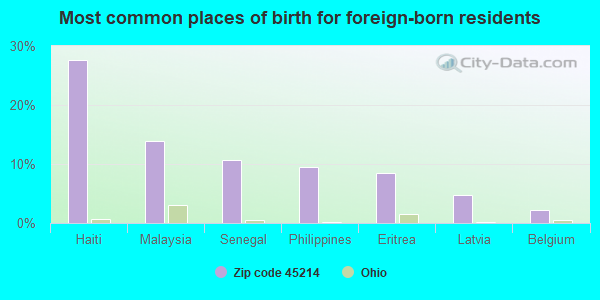
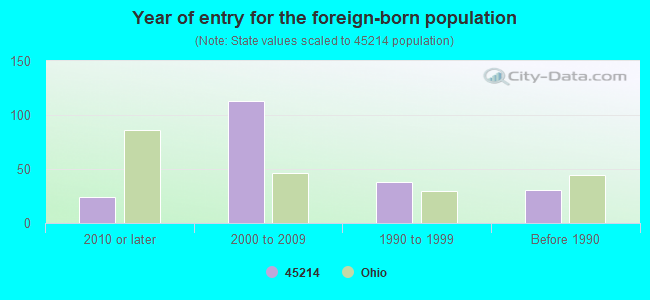
Foreign born population: 188 (2.1%) (71.0% of them are naturalized citizens)
Facilities with environmental interests located in this zip code:
ANDREW JERGENS CO (2535 SPRING GROVE AVENUE in CINCINNATI, OH)
AIR MAJOR (AIRS/AFS) (Integrated Compliance Information System) - ICIS-HQ-1995-0016, FORMAL ENFORCEMENT ACTION COMPLIANCE ACTIVITY (Tracking inspections of insecticide, fungicide, and rodenticide, and toxic substances) CRITERIA AND HAZARDOUS AIR POLLUTANT INVENTORY (Inventory of air pollution sources) STATE MASTER (Ohio general info) - AIR MAJOR, EPCRA, TRIS-45214THNDR2535S, TRI REPORTER, RCRA-OHD004251617, HAZARDOUS WASTE PROGRAM HAZARDOUS WASTE BIENNIAL REPORTER (Resource Conservation and Recovery Act (tracking hazardous waste)) Small Quantity Generators, between 100 kg and 1000 kg of hazardous waste/month (Resource Conservation and Recovery Act (tracking hazardous waste)) - notification TRI REPORTER (Tracking of toxic chemicals releasing facilities) Business SIC classification: SOAP AND OTHER DETERGENTS, EXCEPT SPECIALTY CLEANERS; PERFUMES, COSMETICS, AND OTHER TOILET PREPARATIONS Business NAICS classification: SOAP AND OTHER DETERGENT MANUFACTURING. Organizations: ANDREW JERGENS COMPANY (CONTACT/OWNER)
, KAO BRANDS CO (CONTACT/OWNER)
Alternative names: ANDREWS JERGENS COMPANY, JERGENS COMPANY, ANDREW, JERGENS ANDREW CO, KAO BRANDS CO
BP OIL NO 09020 * (1550 QUEEN CITY AVE in CINCINNATI, OH)
STATE MASTER (Ohio general info) - AIR MAJOR, RCRA-OHD987028602, HAZARDOUS WASTE PROGRAM STATE MASTER (Ohio general info) - -31-5541-1038-R, EPCRA Conditionally Exempt Small Quantity Generators, less than 100 kg/month of hazardous waste (Resource Conservation and Recovery Act (tracking hazardous waste)) - notification Organizations: BP OIL CO (CONTACT/OWNER)
, BP OIL COMPANY (CONTACT/OWNER)
Alternative names: BP OIL CO SITE 09020, BP OIL SITE 309020 *
BP OIL NO 09138 * (2139 SPRING GROVE AVE in CINCINNATI, OH)
STATE MASTER (Ohio general info) - AIR MAJOR, RCRA-OHD987028222, HAZARDOUS WASTE PROGRAM STATE MASTER (Ohio general info) - -315541-1038-AA, EPCRA Conditionally Exempt Small Quantity Generators, less than 100 kg/month of hazardous waste (Resource Conservation and Recovery Act (tracking hazardous waste)) - notification Organizations: BP OIL CO (CONTACT/OWNER)
, BP OIL COMPANY (CONTACT/OWNER)
Alternative names: BP OIL CO SITE 09138, BP OIL SITE NO 09138 *
BARRETT PAVING MATERIALS INC GRAND AVE * (2201 GRAND AVENUE in CINCINNATI, OH)
AIR MINOR (AIRS/AFS) STATE MASTER (Ohio general info) - AIR MAJOR USED OIL PROGRAM (Resource Conservation and Recovery Act (tracking hazardous waste)) Business SIC classification: ASPHALT PAVING MIXTURES AND BLOCKS Alternative names: BARRETT PAVING MATERIALS INCORPORATED, BARRETT PAVING MATERIALS INC PLT 57
ALPHA CO (1685 WESTWOOD AVE in CINCINNATI, OH)
STATE MASTER (Ohio general info) - RCRA-OHD987036357, HAZARDOUS WASTE PROGRAM Small Quantity Generators, between 100 kg and 1000 kg of hazardous waste/month (Resource Conservation and Recovery Act (tracking hazardous waste)) - notification TRANSPORTER (Resource Conservation and Recovery Act (tracking hazardous waste)) - notification Organizations: ROETHER WAYNE (CONTACT/OWNER)
, WAYNE ROETHER (CONTACT/OWNER)
AMANO CINCINNATI INC (1733 CENTRAL AVE in CINCINNATI, OH)
AIR MINOR (AIRS/AFS) STATE MASTER (Ohio general info) - AIR MAJOR Business SIC classification: OFFICE MACHINES
BERMAN PRINTING CO (1635 WESTERN AVE in CINCINNATI, OH)
STATE MASTER (Ohio general info) - RCRA-OHD987014602, HAZARDOUS WASTE PROGRAM Small Quantity Generators, between 100 kg and 1000 kg of hazardous waste/month (Resource Conservation and Recovery Act (tracking hazardous waste)) - notification
AUTO SUN PRODUCTS CO (529 POPLAR ST in CINCINNATI, OH)
AIR MINOR (AIRS/AFS) (Resource Conservation and Recovery Act (tracking hazardous waste)) Business SIC classification: METAL STAMPINGS Organizations: THE AUTO SUN PRODUCTS COMPANY INC (CONTACT/OWNER)
ADT 80 (1630 DALTON AVENUE in CINCINNATI, OH)
(Integrated Compliance Information System) - ICIS-HQ-2002-6000, FORMAL ENFORCEMENT ACTION
Housing units lacking complete plumbing facilities: 5.0% Housing units lacking complete kitchen facilities: 5.2%
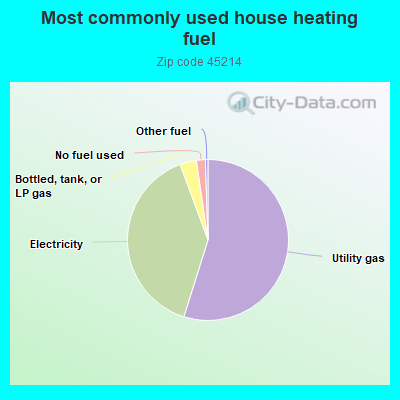
54.8%Utility gas
39.5%Electricity
3.3%Bottled, tank, or LP gas
1.8%No fuel used
0.5%Other fuel
Population in 1990: 12,013.
Place of birth for U.S.-born residents:
This state: 6,907
Northeast: 249
Midwest: 367
South: 958
West: 234
47% of the 45214 zip code residents lived in the same house 5 years ago. Out of people who lived in different houses, 83% lived in this county. Out of people who lived in different counties, 50% lived in Ohio.
86% of the 45214 zip code residents lived in the same house 1 year ago. Out of people who lived in different houses, 68% moved from this county. Out of people who lived in different houses, 15% moved from different county within same state. Out of people who lived in different houses, 12% moved from different state.
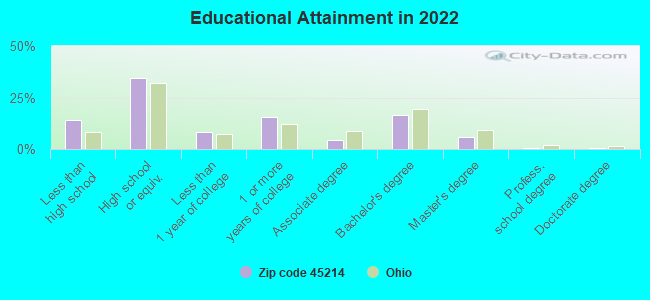
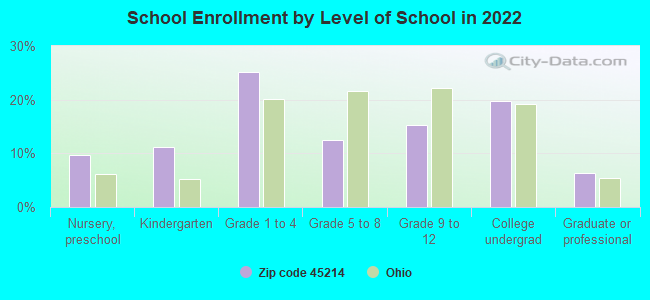
Private vs. public school enrollment:
Students in private schools in grades 1 to 8 (elementary and middle school): 373
Here:
40.8%
Ohio:
16.0%
Students in private schools in grades 9 to 12 (high school): 14
Here:
3.9%
Ohio:
13.1%
Students in private undergraduate colleges: 25
Here:
5.3%
Ohio:
22.3%
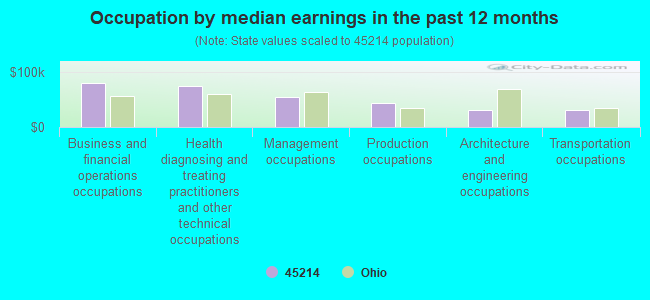
Occupation by median earnings in the past 12 months ($)
80,399Business and financial operations occupations
75,259Health diagnosing and treating practitioners and other technical occupations
54,489Management occupations
44,546Production occupations
31,844Architecture and engineering occupations
31,478Transportation occupations
Companies with federal contracts located in this zip code (CINCINNATI, OH):
THE ANDREW JERGENS CO (2535 SPRING GROVEAVE) : $3,612,302 in 11 contractsfrom 1999 to 2005
Contracts for Food Items For Resale, Non-Food Items For Resale by Defense Commissary Agency, Department of Defense Signed by year:2000: $30,622; 2001: $111,405; 2002: $94,753; 2003: $0; 2004: $968,493; 2005: $2,375,980; 2006: $0.
Biggest contracts:
$968,493 with Defense Commissary Agency for Food Items For Resale. Signed on 2004-10-01. Completion date: 2005-02-28.
$862,944, same as above.Signed on 2005-04-01. Completion date: 2005-08-31.
$620,510, same as above.Signed on 2005-10-01. Completion date: 2005-12-31.
$450,572, same as above.Signed on 2005-01-01. Completion date: 2005-03-31.
CINCINNATI MACHINES, INC (2629 SPRING GROVE AVE; small business)
$64,500 with Air Force for Miscellaneous Maintenance and Repair Shop Specialized Equipment. Signed on 2002-08-08. Completion date: 2002-08-19.
LOUD & CLEAR INC (242 W MC MICKEN AVE; small business)
$45,896 with Army for Lease or Rental of Equipment -- Miscellaneous. Signed on 2003-04-23. Completion date: 2003-04-23.
UNIVERSITY OF CINCINNATI (INC) (1223 CENTRAL PKWY)
$33,000 with Air Force for Defense Electronics and Communication Equipment -- Applied Research and Exploratory Development (R&D). Signed on 2000-01-11. Completion date: 2001-04-30.
QUALITY MFG COMPANY INC (1551 QUEEN CITY AVE; small business) : $22,331 in 3 contractsfrom 2004 to 2006
$10,755 with Navy for Aircraft Maintenance and Repair Shop Specialized Equipment. Taking place in WI. Signed on 2005-03-30. Completion date: 2005-07-08.
$9,070 with Defense Logistics Agency for Miscellaneous Power Transmission Equipment. Signed on 2004-12-31. Completion date: 2005-02-28.
$2,506 with Air Force for Hand Tools, Nonedged, Nonpowered. Signed on 2006-04-17. Completion date: 2006-08-31.
PROCESS CONSTRUCTION, INC. (2128 STATE AVE.; small business) : $9,741 in 2 contractsin 2000
$9,741 with Air Force for Maintenance, Repair or Alteration of Real Property -- Other Administrative Facilities and Service Buildings. Signed on 2000-03-27. Completion date: 2000-03-27.
$0, same as above.Signed on 2000-03-27. Completion date: 2000-03-27.
Top industries in this zip code by the number of employees in 2005:
Administrative and Support and Waste Management and Remediation Services: Carpet and Upholstery Cleaning Services (500-999 employees: 1 establishment)
2002 - 2018 National Fire Incident Reporting System (NFIRS) incidents
Based on the data from the years 2002 - 2018 the average number of fire incidents per year is 96. The highest number of reported fires - 144 took place in 2007, and the least - 44 in 2002. The data has a rising trend.
When looking into fire subcategories, the most reports belonged to: Outside Fires (34.4%), and Structure Fires (31.0%).
Fire incident types reported to NFIRS in Zip Code 45214


 Nearest zip codes: 45203, 45204, 45219, 41016, 45202, 45225.


 Based on the data from the years 2002 - 2018 the average number of fire incidents per year is 96. The highest number of reported fires - 144 took place in 2007, and the least - 44 in 2002. The data has a rising trend.
 When looking into fire subcategories, the most reports belonged to: Outside Fires (34.4%), and Structure Fires (31.0%).