Estimated zip code population in 2022: 16,008 Zip code population in 2010: 14,891 Zip code population in 2000: 15,969
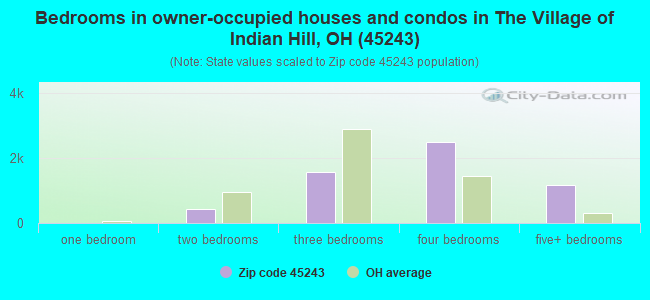
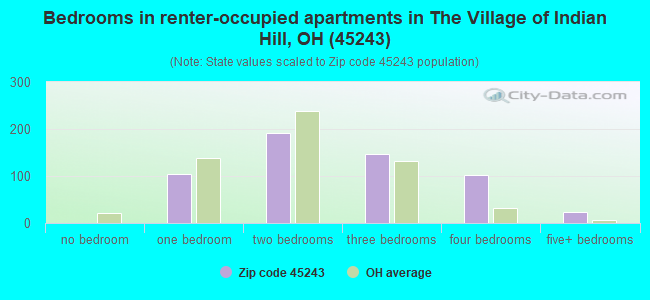
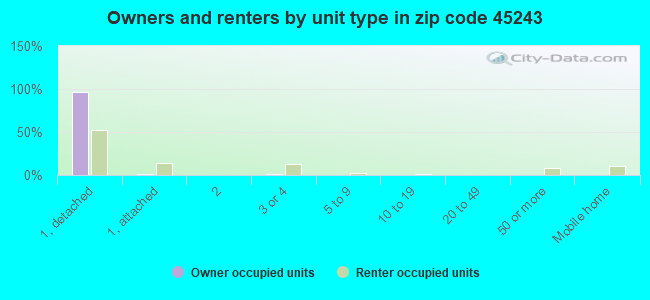
Houses and condos: 6,385 Renter-occupied apartments: 573
% of renters here:
9%
State:
33%
March 2022 cost of living index in zip code 45243: 92.3 (less than average, U.S. average is 100)
Land area: 19.4 sq. mi. Water area: 0.1 sq. mi.
Population density: 824 people per square mile
(low).
OSM Map
General Map
Google Map
MSN Map
OSM Map
General Map
Google Map
MSN Map
OSM Map
General Map
Google Map
MSN Map
OSM Map
General Map
Google Map
MSN Map
Please wait while loading the map...
Real estate property taxes paid for housing units in 2022:
This zip code:
1.4% ($8,902)
Ohio:
1.3% ($2,639)
Median real estate property taxes paid for housing units with mortgages in 2022: $9,494 (1.3%) Median real estate property taxes paid for housing units with no mortgage in 2022: $7,241 (1.5%)
Business Search- 14 Million verified businesses
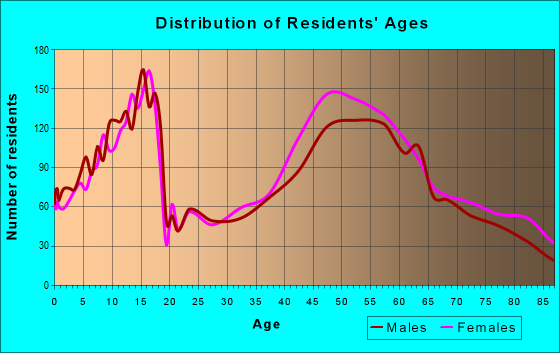
Males: 8,028
(50.2%)
Females: 7,980
(49.8%)
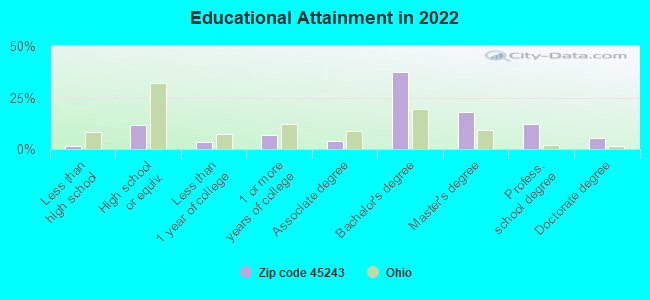
For population 25 years and over in 45243:
High school or higher: 101.8%
Bachelor's degree or higher: 75.5%
Graduate or professional degree: 37.1%
Unemployed: 1.7%
Mean travel time to work (commute): 23.1 minutes
For population 15 years and over in 45243:
Never married: 16.3%
Now married: 73.1%
Separated: 0.7%
Widowed: 4.1%
Divorced: 5.7%
Zip code 45243 compared to state average:
Median household income significantly above state average.
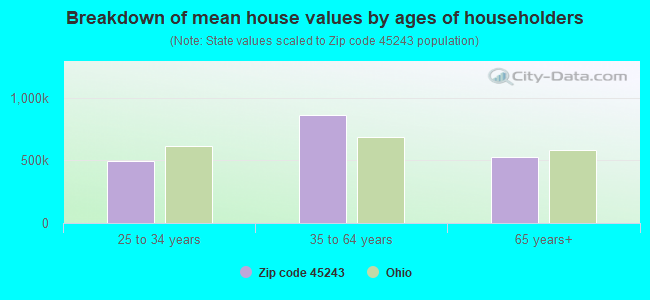
Median house value significantly above state average.
Unemployed percentage below state average.
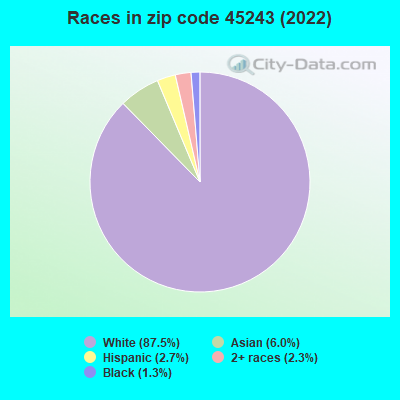
Black race population percentage significantly below state average.
Median age above state average.
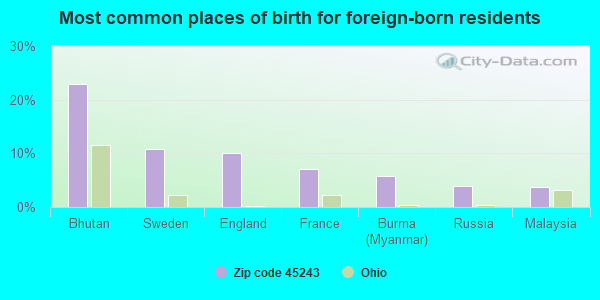
Foreign-born population percentage above state average.
Renting percentage significantly below state average.
Length of stay since moving in above state average.
Number of rooms per house above state average.
Percentage of population with a bachelor's degree or higher significantly above state average.
Estimated median house/condo value in 2022: $655,503
45243:
$655,503
Ohio:
$204,100
According to our research of Ohio and other state lists, there were 4 registered sex offenders living in 45243 zip code as of April 27, 2024. The ratio of all residents to sex offenders in zip code 45243 is 3,803 to 1. The ratio of registered sex offenders to all residents in this zip code is much lower than the state average.
Median resident age:
This zip code:
44.8 years
Ohio median age:
39.9 years
Average household size:
This zip code:
2.5 people
Ohio:
2.4 people
Averages for the 2020 tax year for zip code 45243, filed in 2021:
Average Adjusted Gross Income (AGI) in 2020: $392,691 (Individual Income Tax Returns)
Here:
$392,691
State:
$67,288
Salary/wage: $215,288 (reported on 76.3% of returns)
Here:
$215,288
State:
$55,628
(% of AGI for various income ranges: 1300.6% for AGIs below $25k, 3842.6% for AGIs $25k-50k, 6730.5% for AGIs $50k-75k, 9270.6% for AGIs $75k-100k, 20480.3% for AGIs $100k-200k, 184245.0% for AGIs over 200k)
Taxable interest for individuals: $12,878 (reported on 57.6% of returns)
This zip code:
$12,878
Ohio:
$1,518
(% of AGI for various income ranges: 37.1% for AGIs below $25k, 67.4% for AGIs $25k-50k, 85.0% for AGIs $50k-75k, 135.6% for AGIs $75k-100k, 316.2% for AGIs $100k-200k, 9613.9% for AGIs over 200k)
Ordinary dividends: $65,006 (reported on 59.5% of returns)
Here:
$65,006
State:
$7,167
(% of AGI for various income ranges: 242.5% for AGIs below $25k, 401.9% for AGIs $25k-50k, 623.9% for AGIs $50k-75k, 911.7% for AGIs $75k-100k, 1840.1% for AGIs $100k-200k, 49464.8% for AGIs over 200k)
Net capital gain/loss in AGI: +$156,825 (reported on 51.6% of returns)
Here:
+$156,825
State:
+$18,919
(% of AGI for various income ranges: 99.2% for AGIs below $25k, 312.8% for AGIs $25k-50k, 355.5% for AGIs $50k-75k, 573.3% for AGIs $75k-100k, 1526.5% for AGIs $100k-200k, 109278.3% for AGIs over 200k)
Profit/loss from business: +$40,451 (reported on 20.3% of returns)
Here:
+$40,451
State:
+$13,744
(% of AGI for various income ranges: 141.9% for AGIs below $25k, 296.9% for AGIs $25k-50k, 290.5% for AGIs $50k-75k, 621.9% for AGIs $75k-100k, 1318.5% for AGIs $100k-200k, 8523.0% for AGIs over 200k)
Taxable individual retirement arrangement distribution: $49,656 (reported on 15.2% of returns)
45243:
$49,656
Ohio:
$18,876
(% of AGI for various income ranges: 104.0% for AGIs below $25k, 281.9% for AGIs $25k-50k, 448.7% for AGIs $50k-75k, 766.7% for AGIs $75k-100k, 1686.1% for AGIs $100k-200k, 6987.4% for AGIs over 200k)
Self-employed (Keogh) retirement plans: $34,743 (reported on 3.7% of returns)
45243:
$34,743
Ohio:
$24,898
(% of AGI for various income ranges: 196.1% for AGIs $100k-200k, 1540.0% for AGIs over 200k)
Total itemized deductions: $66,049 (reported on 28.4% of returns)
Here:
$66,049
State:
$33,869
(% of AGI for various income ranges: 140.3% for AGIs below $25k, 373.0% for AGIs $25k-50k, 516.3% for AGIs $50k-75k, 860.8% for AGIs $75k-100k, 1852.4% for AGIs $100k-200k, 22085.6% for AGIs over 200k)
Charity contributions: $41,556 (reported on 24.7% of returns)
Here:
$41,556
State:
$14,577
(% of AGI for various income ranges: 10.1% for AGIs below $25k, 40.6% for AGIs $25k-50k, 50.0% for AGIs $50k-75k, 143.3% for AGIs $75k-100k, 370.6% for AGIs $100k-200k, 13558.0% for AGIs over 200k)
Taxes paid: $9,180 (reported on 28.1% of returns)
45243:
$9,180
State:
$7,681
(% of AGI for various income ranges: 34.6% for AGIs below $25k, 81.7% for AGIs $25k-50k, 136.1% for AGIs $50k-75k, 275.6% for AGIs $75k-100k, 503.5% for AGIs $100k-200k, 2508.3% for AGIs over 200k)
Earned income credit: $1,642 (reported on 3.2% of returns)
Here:
$1,642
State:
$2,304
(% of AGI for various income ranges: 36.1% for AGIs below $25k, 24.8% for AGIs $25k-50k)
Percentage of individuals using paid preparers for their 2020 taxes: 91.5%
Here:
91%
State:
94%
(% for various income ranges: 88.7% for AGIs below $25k, 90.7% for AGIs $25k-50k, 90.8% for AGIs $50k-75k, 89.2% for AGIs $75k-100k, 92.3% for AGIs $100k-200k, 93.9% for AGIs over 200k)
Averages for the 2012 tax year for zip code 45243, filed in 2013:
Average Adjusted Gross Income (AGI) in 2012: $272,790 (Individual Income Tax Returns)
Here:
$272,790
State:
$54,926
Salary/wage: $148,497 (reported on 76.9% of returns)
Here:
$148,497
State:
$45,869
(% of AGI for various income ranges: 64.5% for AGIs below $25k, 68.8% for AGIs $25k-50k, 63.3% for AGIs $50k-75k, 67.6% for AGIs $75k-100k, 64.7% for AGIs $100k-200k, 37.0% for AGIs over 200k)
Taxable interest for individuals: $9,064 (reported on 56.2% of returns)
This zip code:
$9,064
Ohio:
$1,297
(% of AGI for various income ranges: 2.1% for AGIs below $25k, 1.1% for AGIs $25k-50k, 1.0% for AGIs $50k-75k, 1.2% for AGIs $75k-100k, 1.3% for AGIs $100k-200k, 2.0% for AGIs over 200k)
Ordinary dividends: $48,731 (reported on 57.1% of returns)
Here:
$48,731
State:
$5,821
(% of AGI for various income ranges: 10.9% for AGIs below $25k, 5.5% for AGIs $25k-50k, 5.9% for AGIs $50k-75k, 5.2% for AGIs $75k-100k, 6.4% for AGIs $100k-200k, 11.0% for AGIs over 200k)
Net capital gain/loss in AGI: +$107,363 (reported on 46.3% of returns)
Here:
+$107,363
State:
+$11,232
(% of AGI for various income ranges: 4.8% for AGIs below $25k, 1.9% for AGIs $25k-50k, 1.5% for AGIs $50k-75k, 2.1% for AGIs $75k-100k, 3.7% for AGIs $100k-200k, 21.4% for AGIs over 200k)
Profit/loss from business: +$43,914 (reported on 19.4% of returns)
Here:
+$43,914
State:
+$12,773
(% of AGI for various income ranges: 6.8% for AGIs below $25k, 5.9% for AGIs $25k-50k, 6.4% for AGIs $50k-75k, 5.2% for AGIs $75k-100k, 5.4% for AGIs $100k-200k, 2.6% for AGIs over 200k)
Taxable individual retirement arrangement distribution: $43,190 (reported on 17.8% of returns)
45243:
$43,190
Ohio:
$14,511
(% of AGI for various income ranges: 5.1% for AGIs below $25k, 5.1% for AGIs $25k-50k, 5.8% for AGIs $50k-75k, 5.7% for AGIs $75k-100k, 5.2% for AGIs $100k-200k, 2.3% for AGIs over 200k)
Self-employment retirement plans: $29,144 (reported on 3.3% of returns)
45243:
$29,144
Ohio:
$20,257
(% of AGI for various income ranges: 1.0% for AGIs $50k-75k, 0.4% for AGIs $100k-200k, 0.4% for AGIs over 200k)
Total itemized deductions: $66,983 (15% of AGI, reported on 58.3% of returns)
Here:
$66,983
State:
$21,278
Here:
15.0% of AGI
State:
18.8% of AGI
(% of AGI for various income ranges: 17.6% for AGIs below $25k, 14.3% for AGIs $25k-50k, 19.2% for AGIs $50k-75k, 18.4% for AGIs $75k-100k, 19.3% for AGIs $100k-200k, 13.4% for AGIs over 200k)
Charity contributions: $16,771 (reported on 51.2% of returns)
Here:
$16,771
State:
$3,943
(% of AGI for various income ranges: 1.2% for AGIs below $25k, 1.4% for AGIs $25k-50k, 1.9% for AGIs $50k-75k, 2.1% for AGIs $75k-100k, 2.6% for AGIs $100k-200k, 3.3% for AGIs over 200k)
Taxes paid: $35,540 (reported on 58.0% of returns)
45243:
$35,540
State:
$9,568
(% of AGI for various income ranges: 4.4% for AGIs below $25k, 4.7% for AGIs $25k-50k, 7.0% for AGIs $50k-75k, 8.0% for AGIs $75k-100k, 9.2% for AGIs $100k-200k, 7.5% for AGIs over 200k)
Earned income credit: $1,712 (reported on 4.3% of returns)
Here:
$1,712
State:
$2,285
(% of AGI for various income ranges: 1.9% for AGIs below $25k, 0.5% for AGIs $25k-50k)
Percentage of individuals using paid preparers for their 2012 taxes: 58.5%
Here:
59%
State:
51%
(% for various income ranges: 50.0% for AGIs below $25k, 46.2% for AGIs $25k-50k, 57.3% for AGIs $50k-75k, 52.8% for AGIs $75k-100k, 56.7% for AGIs $100k-200k, 82.2% for AGIs over 200k)
Averages for the 2004 tax year for zip code 45243, filed in 2005:
Average Adjusted Gross Income (AGI) in 2004: $206,070 (Individual Income Tax Returns)
Here:
$206,070
State:
$44,480
Salary/wage: $129,754 (reported on 73.7% of returns)
Here:
$129,754
State:
$39,198
(% of AGI for various income ranges: 58.0% for AGIs $10k-25k, 63.1% for AGIs $25k-50k, 67.2% for AGIs $50k-75k, 69.0% for AGIs $75k-100k, 43.1% for AGIs over 100k)
Taxable interest for individuals: $9,110 (reported on 68.4% of returns)
This zip code:
$9,110
Ohio:
$1,532
(% of AGI for various income ranges: 5.4% for AGIs $10k-25k, 3.1% for AGIs $25k-50k, 2.0% for AGIs $50k-75k, 2.9% for AGIs $75k-100k, 2.8% for AGIs over 100k)
Taxable dividends: $31,688 (reported on 63.0% of returns)
Here:
$31,688
State:
$3,496
(% of AGI for various income ranges: 9.5% for AGIs $10k-25k, 5.9% for AGIs $25k-50k, 5.4% for AGIs $50k-75k, 5.7% for AGIs $75k-100k, 9.8% for AGIs over 100k)
Net capital gain/loss: +$91,235 (reported on 53.3% of returns)
Here:
+$91,235
State:
+$8,582
(% of AGI for various income ranges: 3.9% for AGIs $10k-25k, 2.7% for AGIs $25k-50k, 2.4% for AGIs $50k-75k, 3.1% for AGIs $75k-100k, 25.7% for AGIs over 100k)
Profit/loss from business: +$29,541 (reported on 18.3% of returns)
Here:
+$29,541
State:
+$10,813
(% of AGI for various income ranges: 4.0% for AGIs $10k-25k, 5.1% for AGIs $25k-50k, 4.7% for AGIs $50k-75k, 3.1% for AGIs $75k-100k, 2.6% for AGIs over 100k)
IRA payment deduction: $3,737 (reported on 2.9% of returns)
45243:
$3,737
Ohio:
$2,794
(% of AGI for various income ranges: 0.4% for AGIs $10k-25k, 0.4% for AGIs $25k-50k, 0.2% for AGIs $50k-75k, 0.2% for AGIs $75k-100k, 0.0% for AGIs over 100k)
Self-employed pension: $19,714 (reported on 3.7% of returns)
Here:
$19,714
Ohio:
$13,981
(% of AGI for various income ranges: 0.2% for AGIs $25k-50k, 0.4% for AGIs $50k-75k, 0.3% for AGIs $75k-100k, 0.4% for AGIs over 100k)
Total itemized deductions: $63,805 (18% of AGI, reported on 56.6% of returns)
Here:
$63,805
State:
$17,503
Here:
18.2% of AGI
State:
20.8% of AGI
(% of AGI for various income ranges: 22.9% for AGIs $10k-25k, 17.6% for AGIs $25k-50k, 20.3% for AGIs $50k-75k, 20.8% for AGIs $75k-100k, 16.9% for AGIs over 100k)
Charity contributions deductions: $21,291 (6% of AGI, reported on 51.7% of returns)
Here:
$21,291
State:
$3,087
Here:
5.7% of AGI
State:
3.4% of AGI
(% of AGI for various income ranges: 1.8% for AGIs $10k-25k, 2.0% for AGIs $25k-50k, 2.3% for AGIs $50k-75k, 2.9% for AGIs $75k-100k, 5.6% for AGIs over 100k)
Total tax: $54,206 (reported on 81.6% of returns)
45243:
$54,206
State:
$6,781
(% of AGI for various income ranges: 4.5% for AGIs $10k-25k, 7.7% for AGIs $25k-50k, 9.3% for AGIs $50k-75k, 10.4% for AGIs $75k-100k, 22.7% for AGIs over 100k)
Earned income credit: $1,160 (reported on 3.0% of returns)
Here:
$1,160
State:
$1,696
Percentage of individuals using paid preparers for their 2004 taxes: 61.5%
Here:
61%
State:
55%
(% for various income ranges: 58.3% for AGIs below $10k, 54.9% for AGIs $10k-25k, 53.6% for AGIs $25k-50k, 56.3% for AGIs $50k-75k, 54.3% for AGIs $75k-100k, 74.6% for AGIs over 100k)
Household received Food Stamps/SNAP in the past 12 months: 36 Household did not receive Food Stamps/SNAP in the past 12 months: 6,118
Women who had a birth in the past 12 months: 137 (119 now married, 19 unmarried) Women who did not have a birth in the past 12 months: 2,550 (1,841 now married, 706 unmarried)
Housing units in zip code 45243 with a mortgage: 3,760 (428 second mortgage, 379 both second mortgage and home equity loan) Houses without a mortgage: 169
Median monthly owner costs for units with a mortgage: $3,181 Median monthly owner costs for units without a mortgage: $1,021
Residents with income below the poverty level in 2022:
This zip code:
1.9%
Whole state:
13.4%
Residents with income below 50% of the poverty level in 2022:
This zip code:
0.6%
Whole state:
7.0%
Median number of rooms in houses and condos:
Here:
8.2
State:
6.7
Median number of rooms in apartments:
Here:
4.8
State:
4.4
Notable locations in this zip code not listed on our city pages
Notable locations in zip code 45243: Camargo Country Club (A), Kenwood Country Club (B), Camp Livingston (C), Madeira and Indian Hill Joint Fire District Indian Hill Station (D), Madeira and Indian Hill Joint Fire District Madeira Station (E), Madeira Branch Library (F). Display/hide their locations on the map
Churches in zip code 45243 include: Madeira Baptist Church (A), Madeira Church of Christ (B), Saint Paul United Methodist Church (C), Madeira Presbyterian Church (D), Indian Hill Episcopal-Presbyterian Church (E), Holy Trinity Episcopal Church (F), Saint Gertrude Catholic Church (G), Armstrong Chapel United Methodist Church (H). Display/hide their locations on the map
Parks in zip code 45243 include: Camp Livingston Park (1), Steer Meadow Park (2), Bonnel Park (3), Stanley Rowe Arboretum (4), Radio Range Park (5), Rheinstrom Park (6). Display/hide their locations on the map
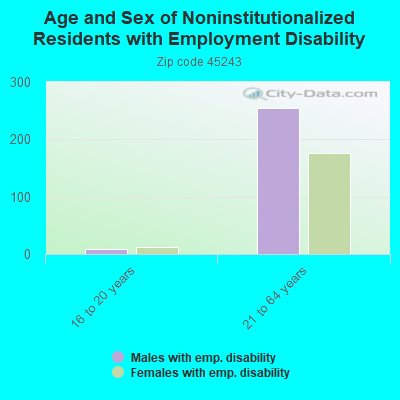
In group quarters: 277 (-1 institutionalized population)
Size of family households: 2,440 2-persons, 1,080 3-persons, 953 4-persons, 338 5-persons, 88 6-persons, 35 7-or-more-persons
Size of nonfamily households: 1,079 1-person, 111 2-persons, 13 4-persons
3,582 married couples with children.
414 single-parent households (95 men, 319 women).
89.9% of residents of 45243 zip code speak English at home.
2.1% of residents speak Spanish at home (97% very well, 3% not well).
5.7% of residents speak other Indo-European language at home (82% very well, 10% well, 9% not well).
2.4% of residents speak Asian or Pacific Island language at home (81% very well, 17% well, 2% not well).
0.1% of residents speak other language at home (100% very well).
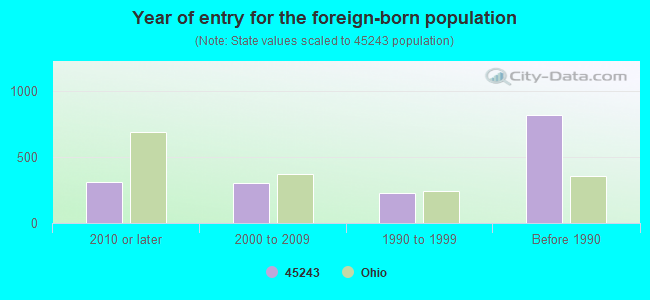
Foreign born population: 1,545 (9.7%) (84.3% of them are naturalized citizens)
This zip code:
9.7%
Whole state:
5.0%
23%Bhutan
11%Sweden
10%England
7%France
6%Burma (Myanmar)
4%Russia
4%Malaysia
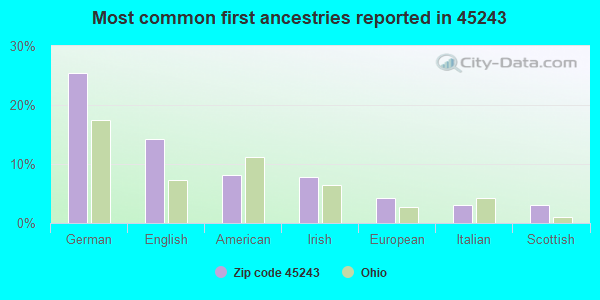
25%German
14%English
8%American
8%Irish
4%European
3%Italian
3%Scottish
Year of entry for the foreign-born population
3112010 or later
3042000 to 2009
2301990 to 1999
816Before 1990
Facilities with environmental interests located in this zip code:
BP OIL CO SITE 08868 (7700 SHAWNEE RUN in CINCINNATI, OH)
STATE MASTER (Ohio general info) - AIR MAJOR, RCRA-OHD987028081, HAZARDOUS WASTE PROGRAM Small Quantity Generators, between 100 kg and 1000 kg of hazardous waste/month (Resource Conservation and Recovery Act (tracking hazardous waste)) - notification Organizations: BP OIL COMPANY (CONTACT/OWNER)
Alternative names: SOHIO OIL CO
BORDEN FOODSERVICE (6943 MORRISON PLACE in CINCINNATI, OH)
Housing units lacking complete plumbing facilities: 0.6% Housing units lacking complete kitchen facilities: 0.6%
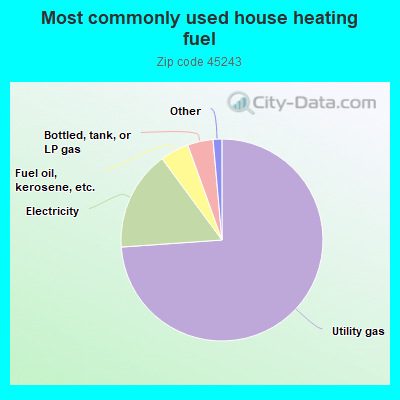
73.9%Utility gas
16.0%Electricity
4.6%Fuel oil, kerosene, etc.
4.1%Bottled, tank, or LP gas
0.6%Other fuel
0.6%No fuel used
Population in 1990: 14,999. Population change in the 1990s: +970 (+6.5%).
Place of birth for U.S.-born residents:
This state: 8,705
Northeast: 1,066
Midwest: 2,053
South: 1,705
West: 738
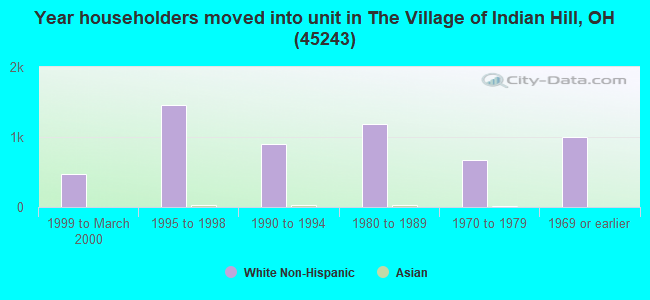
67% of the 45243 zip code residents lived in the same house 5 years ago. Out of people who lived in different houses, 70% lived in this county. Out of people who lived in different counties, 50% lived in Ohio.
93% of the 45243 zip code residents lived in the same house 1 year ago. Out of people who lived in different houses, 54% moved from this county. Out of people who lived in different houses, 9% moved from different county within same state. Out of people who lived in different houses, 37% moved from different state. Out of people who lived in different houses, 4% moved from abroad.
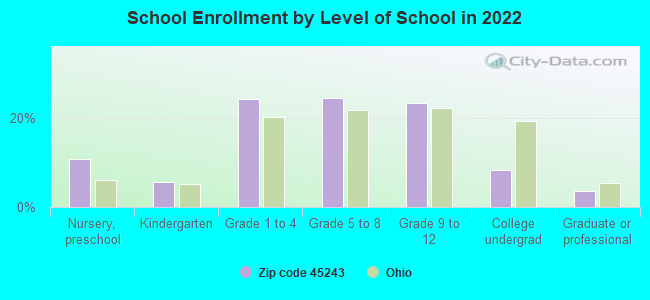
Private vs. public school enrollment:
Students in private schools in grades 1 to 8 (elementary and middle school): 340
Here:
17.6%
Ohio:
16.0%
Students in private schools in grades 9 to 12 (high school): 172
Here:
18.6%
Ohio:
13.1%
Students in private undergraduate colleges: 100
Here:
30.0%
Ohio:
22.3%
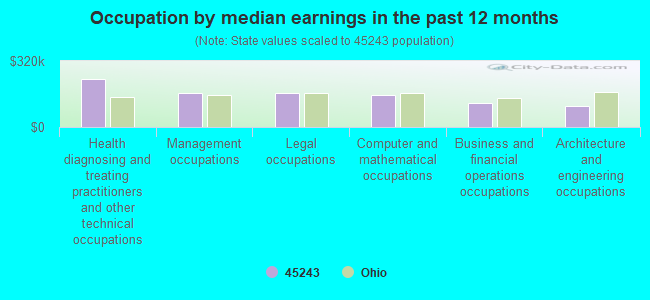
Occupation by median earnings in the past 12 months ($)
230,538Health diagnosing and treating practitioners and other technical occupations
166,580Management occupations
165,902Legal occupations
153,465Computer and mathematical occupations
116,002Business and financial operations occupations
103,061Architecture and engineering occupations
Companies with federal contracts located in this zip code:
SCHNEIDER INSTRUMENT CO (8115 CAMARGO RD in CINCINNATI, OH; small business) : $374,974 in 17 contractsfrom 2000 to 2006
Contracts for Maintenance, Repair and Rebuilding of Equipment -- Instruments and Laboratory Equipment, Electrical Hardware and Supplies by Army, U.S. Army Corps of Engineers - civil program financing only Signed by year:2000: $25,080; 2001: $25,080; 2002: $0; 2003: $47,220; 2004: $139,502; 2005: $82,792; 2006: $55,300.
Biggest contracts:
$82,792 with Army for Maintenance, Repair and Rebuilding of Equipment -- Instruments and Laboratory Equipment. Signed on 2005-03-18. Completion date: 2004-03-08.
$35,141, same as above.Signed on 2006-02-06. Completion date: 2004-03-08.
$32,224, same as above.Signed on 2004-08-23. Completion date: 2004-03-08.
$32,224 with U.S. Army Corps of Engineers - civil program financing only for Maintenance, Repair and Rebuilding of Equipment -- Instruments and Laboratory Equipment. Signed on 2004-08-23. Completion date: 2004-03-08.
A-FLAME CORPORATION (8175 KROGER FARM ROAD in CINCINNATI, OH; small business) : $67,365 in 2 contractsin 1999
$39,032 with Defense Logistics Agency for Gas Welding, Heat Cutting, and Metalizing Equipment. Signed on 1999-10-26. Completion date: 1999-12-25.
$28,333, same as above.Signed on 1999-12-10. Completion date: 2000-02-08.
LCP TECH INC (8120 INDIAN HILL ROAD in CINCINNATI, OH; small business)
$3,000 with Navy for Oils and Greases: Cutting, Lubricating, and Hydraulic. Signed on 2005-01-10. Completion date: 2005-02-09.
Top industries in this zip code by the number of employees in 2005:
Health Care and Social Assistance: Nursing Care Facilities (100-249 employees: 5 establishments, 50-99 employees: 1 establishment, 10-19 employees: 1 establishment)
Other Services (except Public Administration): Religious Organizations (50-99: 1, 20-49: 4, 10-19: 1, 1-4: 4)
Arts, Entertainment, and Recreation: Golf Courses and Country Clubs (100-249: 1, 20-49: 1)
Accommodation and Food Services: Caterers (100-249: 1, 10-19: 2)
2002 - 2018 National Fire Incident Reporting System (NFIRS) incidents
According to the data from the years 2002 - 2018 the average number of fire incidents per year is 44. The highest number of fires - 73 took place in 2014, and the least - 21 in 2017. The data has a growing trend.
When looking into fire subcategories, the most incidents belonged to: Structure Fires (66.6%), and Outside Fires (22.1%).
Fire incident types reported to NFIRS in Zip Code 45243
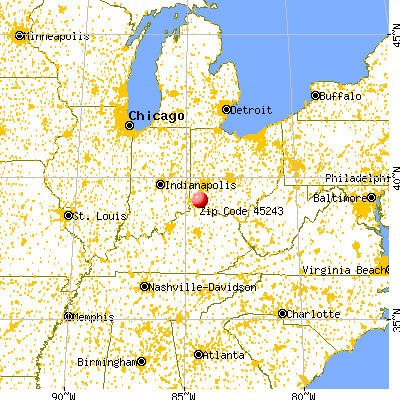


 Nearest zip codes: 45174, 45111, 45147, 45242, 45227, 45236.


 According to the data from the years 2002 - 2018 the average number of fire incidents per year is 44. The highest number of fires - 73 took place in 2014, and the least - 21 in 2017. The data has a growing trend.
 When looking into fire subcategories, the most incidents belonged to: Structure Fires (66.6%), and Outside Fires (22.1%).