Races in Lake Shore, Washington (WA) Detailed Stats
Ancestries, Foreign-born residents, place of birth
Settings
X


Recent posts about races in Lake Shore, Washington on our local forum with over 2,400,000 registered users:
 | Oregon or Washington? (6 replies) |
| North Salmon Creek area vs Hough? (9 replies) |
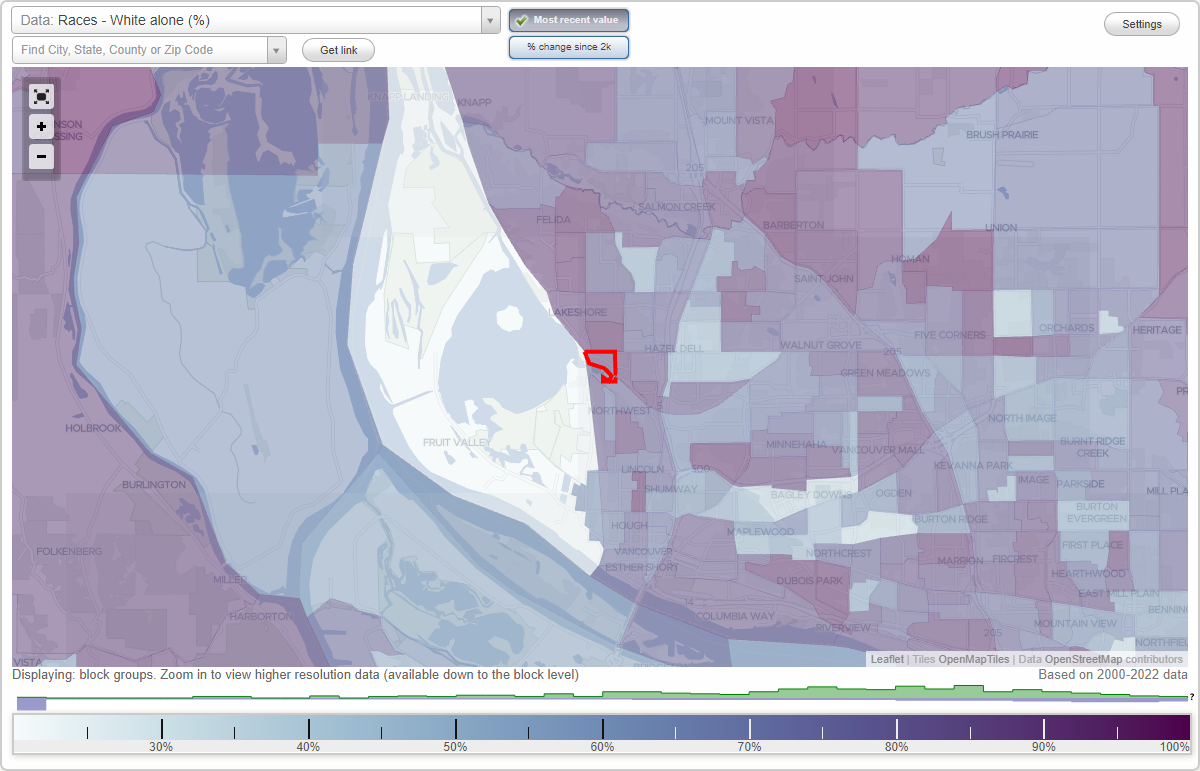
According to 2022 data, the most numerous races in Lake Shore, WA are White alone (5,768 residents), Hispanic (427 residents), and Asian alone (107 residents). 93.6% of Lake Shore residents speak English at home. 5.6% of Lake Shore, WA residents are foreign-born (2.4% born in Europe, 1.4% born in Asia, 0.7% born in Latin America, 0.7% born in North America), which is 167.3% less than the foreign-born rate of 15.0% across the entire state of Washington.
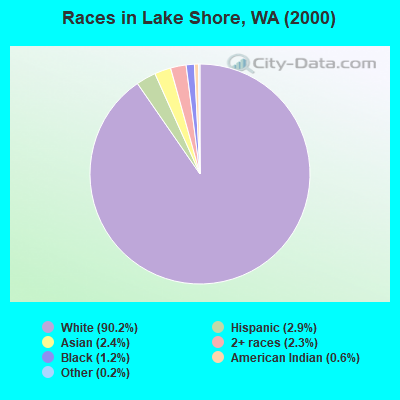
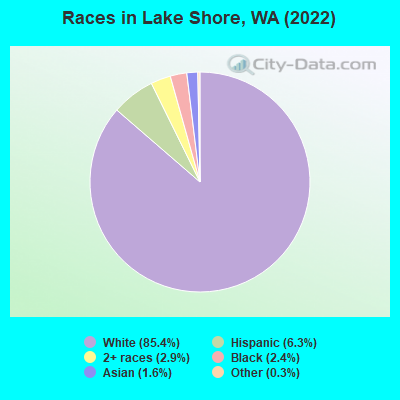
Race distribution in Lake Shore
2000
2022

- 6,01990.2%White alone
- 1942.9%Hispanic
- 1622.4%Asian alone
- 1542.3%Two or more races
- 791.2%Black alone
- 420.6%American Indian alone
- 150.2%Other race alone
- 50.07%Native Hawaiian and Other
Pacific Islander alone
-
- 5,76885.4%White alone
- 4276.3%Hispanic
- 1982.9%Two or more races
- 1592.4%Black alone
- 1071.6%Asian alone
- 170.3%Other race alone
- 30.04%American Indian alone
2000
2022
-
- 4,652,49078.9%White alone
- 441,5097.5%Hispanic
- 319,4015.4%Asian alone
- 184,6313.1%Black alone
- 175,9263.0%Two or more races
- 85,3961.4%American Indian alone
- 22,7790.4%Native Hawaiian and Other
Pacific Islander alone - 11,9890.2%Other race alone

-
- 4,941,45663.5%White alone
- 1,093,31314.0%Hispanic
- 755,8329.7%Asian alone
- 523,4486.7%Two or more races
- 299,5373.8%Black alone
- 69,0240.9%American Indian alone
- 52,2310.7%Native Hawaiian and Other
Pacific Islander alone - 50,9450.7%Other race alone

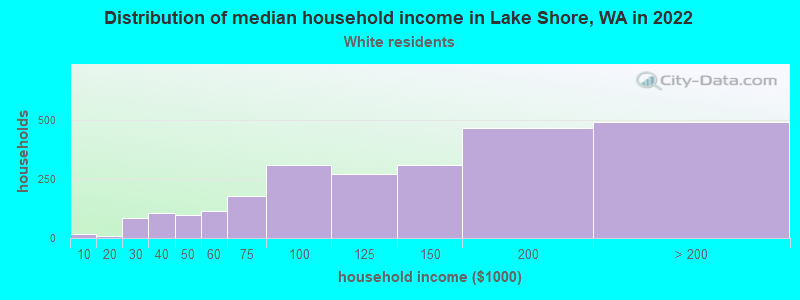
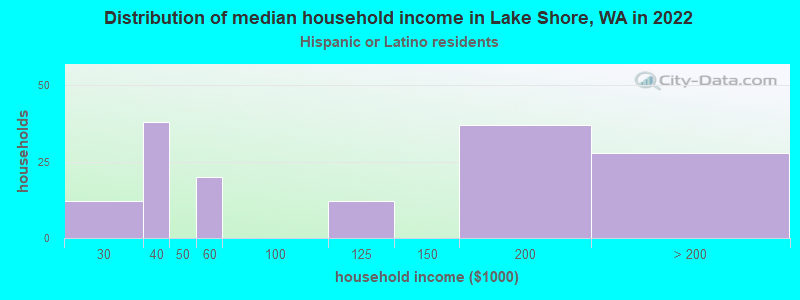
Income and house value in Lake Shore
- Median household income in 2022
- $130,115White non-Hispanic householders
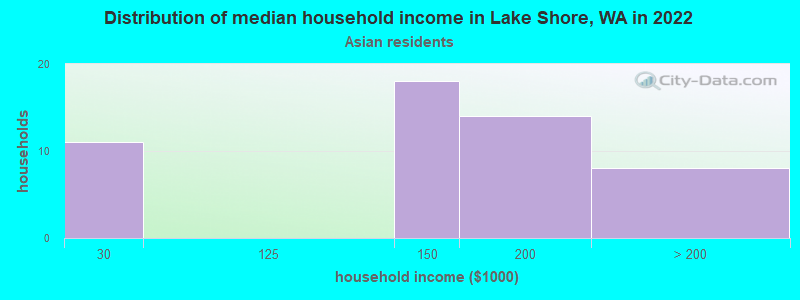
- $130,209Asian householders
- Median 2022 house value
- $551,779White Non-Hispanic householders
- $749,700Black or African American householders
- $485,100American Indian or Alaska Native householders
- $526,024Asian householders
- $396,900Some other race householders
- $524,260Two or more races householders
- $539,078Hispanic or Latino householders
Household income for White non-Hispanic householders
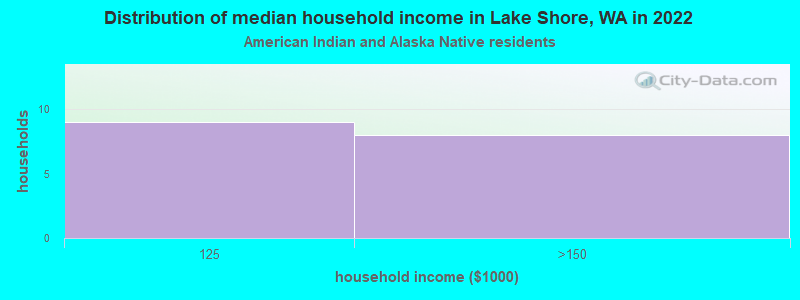
Household income for American Indian and Alaska Native householders
Household income for Asian householders
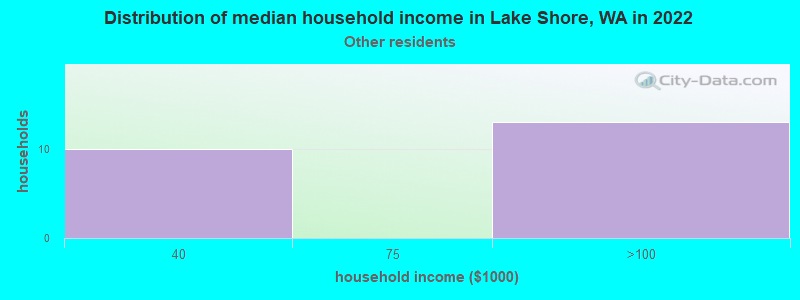
Household income for Some other race householders
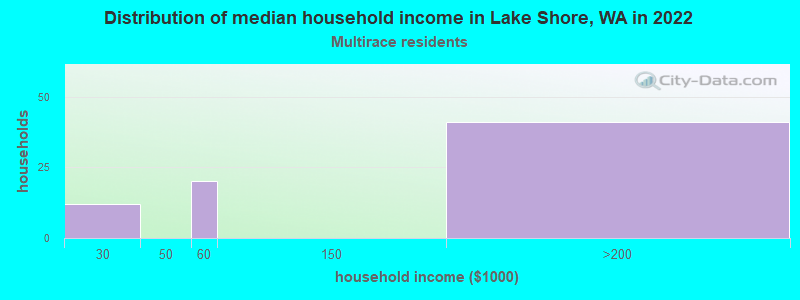
Household income for Two or more races householders
Household income for Hispanic or Latino race householders
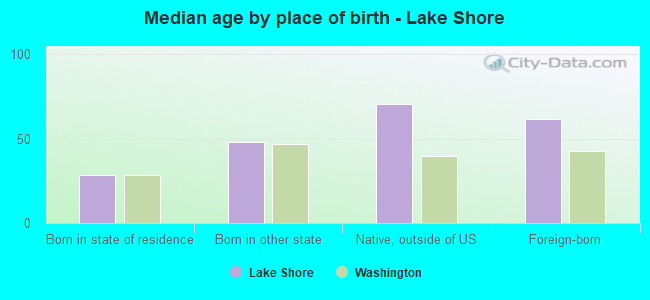
Median age by race in Lake Shore
- 48.5Median age for White residents
- 46.9Males
- 49.6Females
- 28.4Median age for Black or African American residents
- 25.5Males
- -698,955,364.9Females
- 22.4Median age for American Indian / Alaska Native residents
- -716,049,382.0Males
- 19.2Females
- 49.9Median age for Asian residents
- 52.9Males
- 42.0Females
- -779,279,278.5Median age for Native Hawaiian / Pacific Islander residents
- -779,310,344.0Males
- -928,017,717.8Females
- 10.7Median age for Other race residents
- 37.6Males
- 10.1Females
- 53.4Median age for Two or more races residents
- 26.0Males
- 53.5Females
- 48.2Median age for White alone residents
- 46.3Males
- 49.6Females
- 24.4Median age for Hispanic or Latino residents
- 32.1Males
- 22.0Females
Owner/renter occupied households by race in Lake Shore
- House owners and renters - White residents
- 2,24288.8%Owner occupied
- 28411.2%Renter occupied
- House owners and renters - American Indian / Alaska Native residents
- 538.8%Owner occupied
- 861.2%Renter occupied
- House owners and renters - Asian residents
- 53100.0%Owner occupied
- House owners and renters - Native Hawaiian / Pacific Islander residents
- 26100.0%Owner occupied
- House owners and renters - Other race residents
- 30100.0%Owner occupied
- House owners and renters - Two or more races residents
- 100100.0%Owner occupied
- House owners and renters - White alone residents
- 2,24188.3%Owner occupied
- 29711.7%Renter occupied
- House owners and renters - Hispanic or Latino residents
- 12894.1%Owner occupied
- 85.9%Renter occupied
Language usage in Lake Shore
- English speakers - Total
- 93.6% of residents of Lake Shore speak English at home.
- 1.9% of residents speak Spanish at home
- 10585.4%Speak English very well
- 1814.6%Speak English less than very well
- 4.4% of residents speak other language at home
- 13547.2%Speak English very well
- 15152.8%Speak English less than very well
- English speakers - Born in the United States
- 95.2% of residents of Lake Shore speak English at home.
- 1.8% of residents speak Spanish at home
- 6894.4%Speak English very well
- 45.6%Speak English less than very well
- 1.9% of residents speak other language at home
- 6381.8%Speak English very well
- 1418.2%Speak English less than very well
All residents speak only English at home
- English speakers - Foreign-born
- 24.1% of residents of Lake Shore speak English at home.
- 10.2% of residents speak Spanish at home
- 2569.4%Speak English very well
- 1130.6%Speak English less than very well
- 63.1% of residents speak other language at home
- 8437.8%Speak English very well
- 13862.2%Speak English less than very well
White (Caucasian) - Speak only English
| Native: | 99.1% (5,322) |
| Foreign-born: | 33.5% (74) |
White (Caucasian) - Speak another language
| Native: | 1.2% (64) |
| Foreign-born: | 68.4% (150) |
American Indian / Alaska Native - Speak another language
| Native: | 99.6% (45) |
| Foreign-born: | 100.0% (19) |
Asian - Speak only English
| Native: | 96.8% (43) |
| Foreign-born: | 18.2% (11) |
Other race - Speak another language
| Native: | 16.0% (17) |
| Foreign-born: | 100.0% (18) |
Two or more races - Speak only English
| Native: | 92.2% (303) |
| Foreign-born: | 31.4% (1) |
White alone - Speak only English
| Native: | 98.1% (5,292) |
| Foreign-born: | 31.2% (78) |
White alone - Speak another language
| Native: | 1.6% (84) |
| Foreign-born: | 69.3% (173) |
Hispanic or Latino - Speak another language
| Native: | 17.4% (63) |
| Foreign-born: | 100.0% (32) |
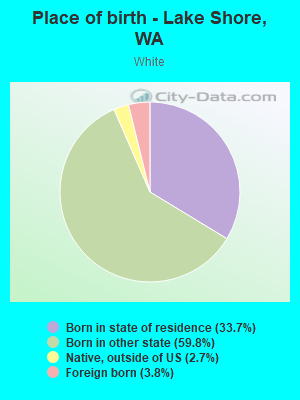
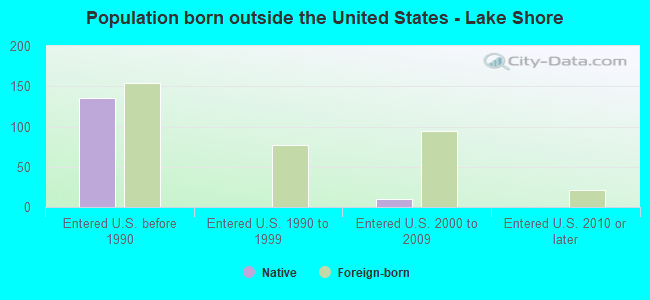
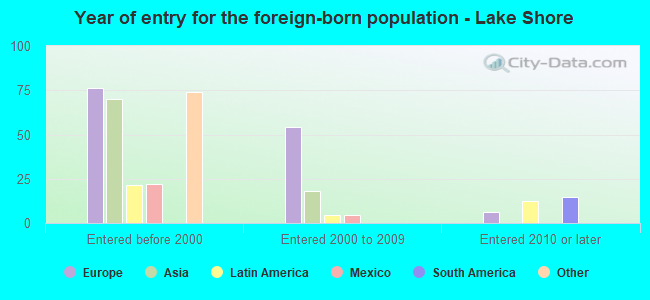
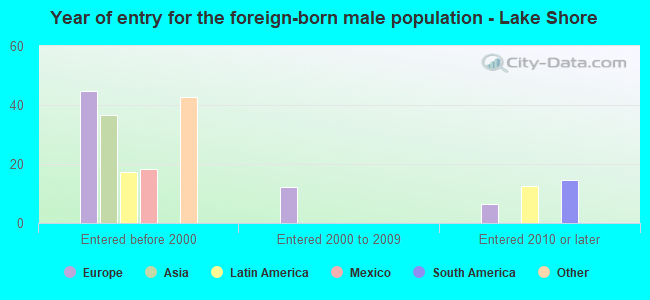
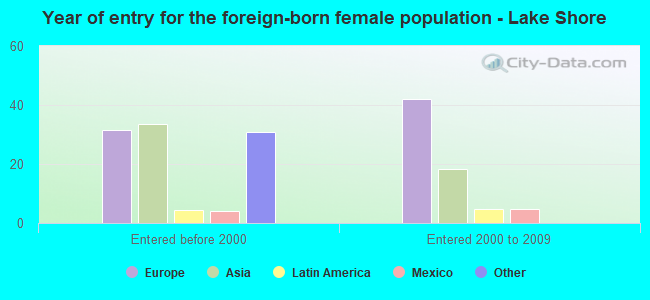
Foreign-born residents in Lake Shore
379 residents are foreign born (2.4% Europe, 1.4% Asia, 0.7% Latin America, 0.7% North America).
| This city: | 5.6% |
| Washington: | 14.9% |

Marital status for residents in Lake Shore
Marital status - White (Caucasian) population 15 years and over
- Males
- 33.8%Never married
- 55.5%Now married
- 0.1%Separated
- 3.1%Widowed
- 7.5%Divorced
- Females
- 17.8%Never married
- 63.6%Now married
- 0.4%Separated
- 8.8%Widowed
- 9.3%Divorced
Women who gave birth in the past 12 months
| Now married: | 100.0% (86) |
| Unmarried: | 0.0% (0) |
Women who did not give birth in the past 12 months
| Now married: | 57.9% (596) |
| Unmarried: | 42.1% (434) |
Marital status - Black or African American population 15 years and over
- Males
- 0.0%Never married
- 90.2%Now married
- 0.0%Separated
- 0.0%Widowed
- 9.8%Divorced
- Females
- 60.7%Never married
- 39.3%Now married
- 0.0%Separated
- 0.0%Widowed
- 0.0%Divorced
Women who did not give birth in the past 12 months
| Now married: | 39.3% (11) |
| Unmarried: | 60.7% (17) |
Marital status - American Indian / Alaska Native population 15 years and over
- Males
- 46.7%Never married
- 53.3%Now married
- 0.0%Separated
- 0.0%Widowed
- 0.0%Divorced
- Females
- 57.1%Never married
- 42.9%Now married
- 0.0%Separated
- 0.0%Widowed
- 0.0%Divorced
Women who did not give birth in the past 12 months
| Now married: | 42.9% (14) |
| Unmarried: | 57.1% (19) |
Marital status - Asian population 15 years and over
- Males
- 0.0%Never married
- 100.0%Now married
- 0.0%Separated
- 0.0%Widowed
- 0.0%Divorced
- Females
- 26.2%Never married
- 58.5%Now married
- 0.0%Separated
- 15.4%Widowed
- 0.0%Divorced
Women who did not give birth in the past 12 months
| Now married: | 61.4% (29) |
| Unmarried: | 38.6% (18) |
Marital status - Other race population 15 years and over
- Males
- 0.0%Never married
- 66.7%Now married
- 0.0%Separated
- 33.3%Widowed
- 0.0%Divorced
- Females
- 0.0%Never married
- 59.5%Now married
- 13.5%Separated
- 27.0%Widowed
- 0.0%Divorced
Women who did not give birth in the past 12 months
| Now married: | 100.0% (23) |
| Unmarried: | 0.0% (0) |
Marital status - Two or more races population 15 years and over
- Males
- 44.4%Never married
- 45.7%Now married
- 0.0%Separated
- 9.9%Widowed
- 0.0%Divorced
- Females
- 14.3%Never married
- 58.7%Now married
- 0.0%Separated
- 13.5%Widowed
- 13.5%Divorced
Women who did not give birth in the past 12 months
| Now married: | 51.4% (51) |
| Unmarried: | 48.6% (48) |
Marital status - White alone, not Hispanic / Latino population 15 years and over
- Males
- 33.8%Never married
- 55.3%Now married
- 0.1%Separated
- 3.2%Widowed
- 7.7%Divorced
- Females
- 17.7%Never married
- 63.5%Now married
- 0.4%Separated
- 8.9%Widowed
- 9.4%Divorced
Women who gave birth in the past 12 months
| Now married: | 100.0% (89) |
| Unmarried: | 0.0% (0) |
Women who did not give birth in the past 12 months
| Now married: | 57.6% (599) |
| Unmarried: | 42.4% (442) |
Marital status - Hispanic or Latino population 15 years and over
- Males
- 28.4%Never married
- 60.8%Now married
- 0.0%Separated
- 10.8%Widowed
- 0.0%Divorced
- Females
- 34.7%Never married
- 38.8%Now married
- 4.1%Separated
- 22.3%Widowed
- 0.0%Divorced
Women who did not give birth in the past 12 months
| Now married: | 52.8% (52) |
| Unmarried: | 47.2% (46) |
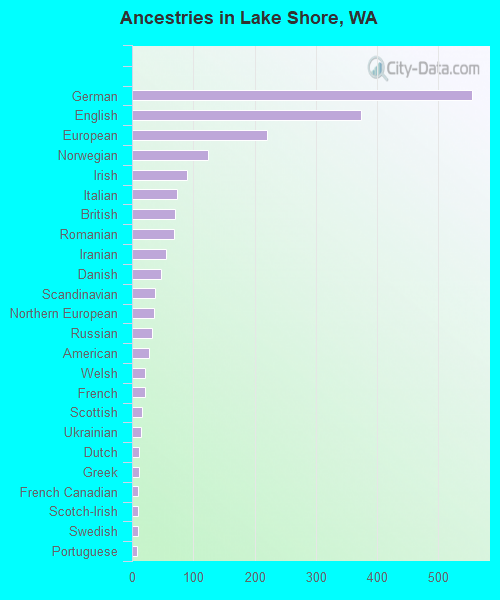
Ancestries in Lake Shore

- 55522.2%German
- 37415.0%English
- 2208.8%European
- 1245.0%Norwegian
- 893.6%Irish
- 743.0%Italian
- 702.8%British
- 692.8%Romanian
- 552.2%Iranian
- 481.9%Danish
- 371.5%Scandinavian
- 361.4%Northern European
- 331.3%Russian
- 281.1%American
- 220.9%Welsh
- 210.8%French
- 160.6%Scottish
- 140.6%Ukrainian
- 110.4%Dutch
- 110.4%Greek
- 100.4%French Canadian
- 90.4%Scotch-Irish
- 90.4%Swedish
- 80.3%Portuguese
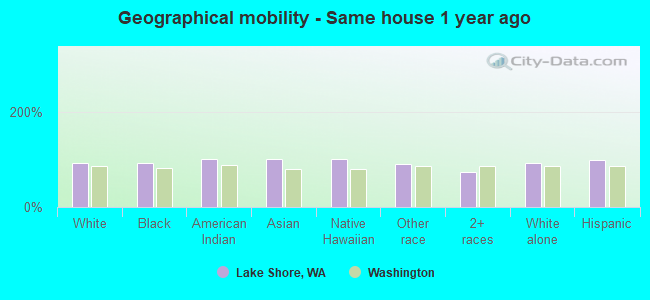
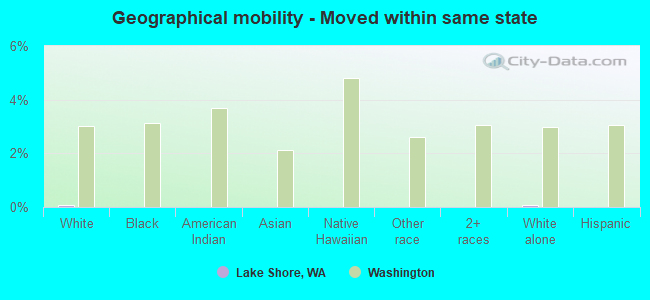
Geographical mobility in Lake Shore

- Same house 1 year ago
- 5,27893.0%White (Caucasian)
- 14792.5%Black or African American
- 64100.0%American Indian / Alaska Native
- 108100.0%Asian
- 21100.0%Native Hawaiian / Pacific Islander
- 13191.4%Other race
- 26074.2%Two or more races
- 5,32392.4%White alone, not Hispanic / Latino
- 41699.5%Hispanic or Latino
-
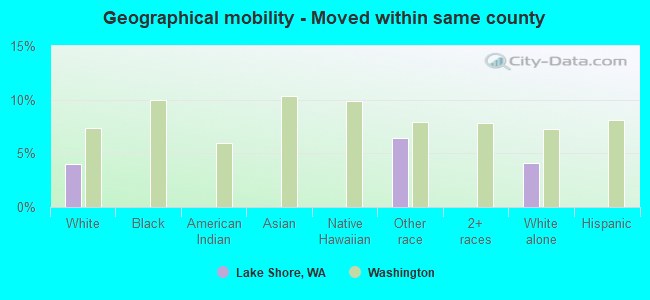
- Moved within same county
- 2264.0%White / Caucasian
- 96.4%Other race
- 2344.1%White alone, not Hispanic / Latino
-
- Moved within same state
- 50.1%White / Caucasian
- 50.1%White alone, not Hispanic / Latino
-
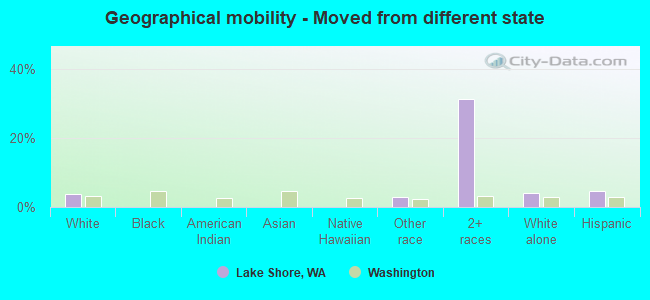
- Moved from different state
- 2143.8%White / Caucasian
- 43.0%Other race
- 10931.2%Two or more races
- 2274.0%White alone, not Hispanic / Latino
- 204.7%Hispanic or Latino
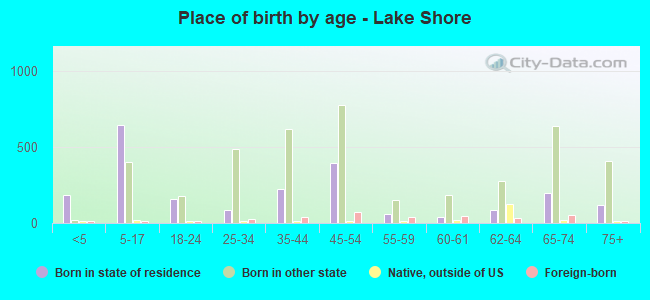
Children Nativity (place of birth) in Lake Shore
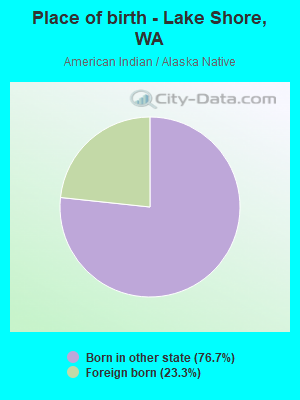
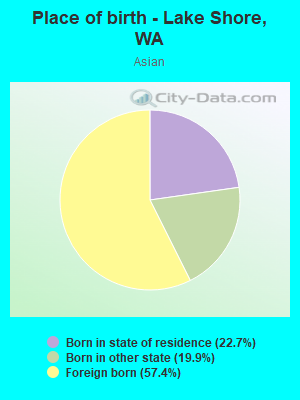
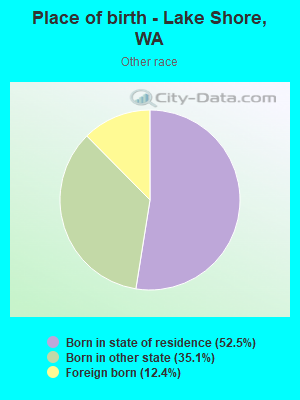
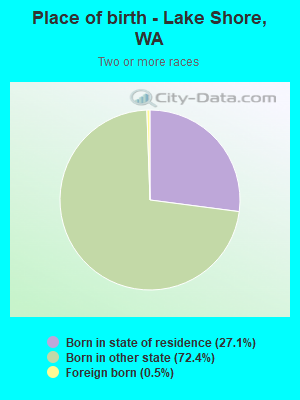
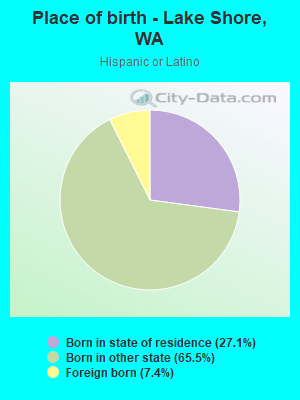
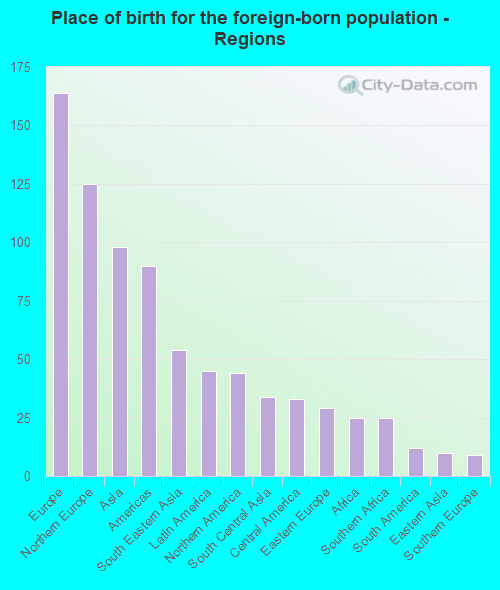
Place of birth for residents in Lake Shore
![Place of birth for the foreign-born population - Regions]()
- 164Europe
- 125Northern Europe
- 98Asia
- 90Americas
- 54South Eastern Asia
- 45Latin America
- 44Northern America
- 34South Central Asia
- 33Central America
- 29Eastern Europe
- 25Africa
- 25Southern Africa
- 12South America
- 10Eastern Asia
- 9Southern Europe
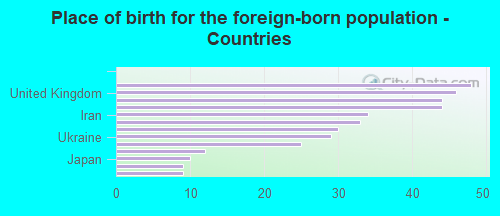
![Place of birth for the foreign-born population - Countries]()
- 48England
- 46United Kingdom
- 44Philippines
- 44Canada
- 34Iran
- 33Mexico
- 30Denmark
- 29Ukraine
- 25South Africa
- 12Brazil
- 10Japan
- 9Greece
- 9Vietnam
Grandparents responsible for own grandchildren in Lake Shore
Zip codes: 98665.