Races in Lancaster, Ohio (OH) Detailed Stats
Data:
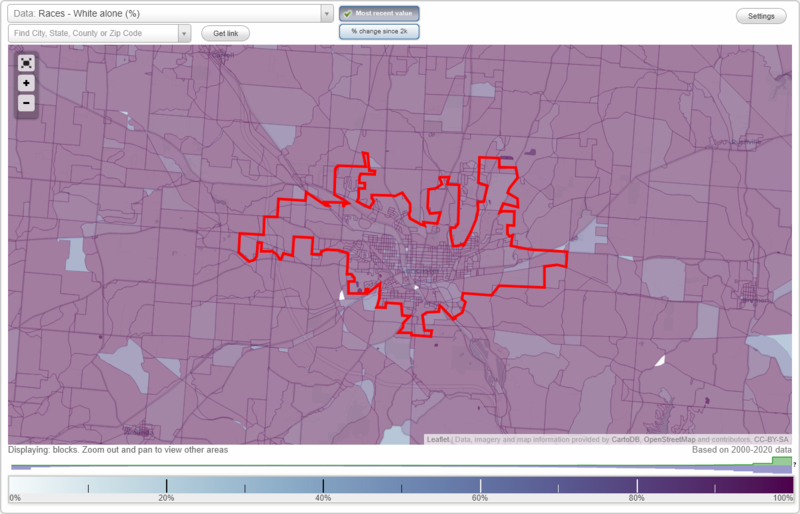
Races - White alone (%)
Races - White alone (% change since 2000)
Races - Black alone (%)
Races - Black alone (% change since 2000)
Races - American Indian alone (%)
Races - American Indian alone (% change since 2000)
Races - Asian alone (%)
Races - Asian alone (% change since 2000)
Races - Hispanic (%)
Races - Hispanic (% change since 2000)
Races - Native Hawaiian and Other Pacific Islander alone (%)
Races - Native Hawaiian and Other Pacific Islander alone (% change since 2000)
Races - Two or more races(%)
Races - Two or more races(% change since 2000)
Races - Other race alone (%)
Races - Other race alone (% change since 2000)
Racial diversity
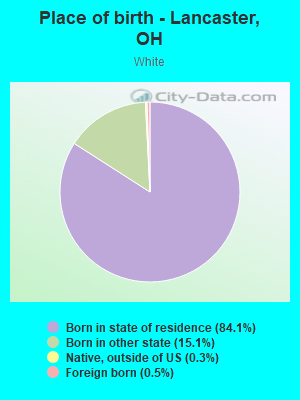
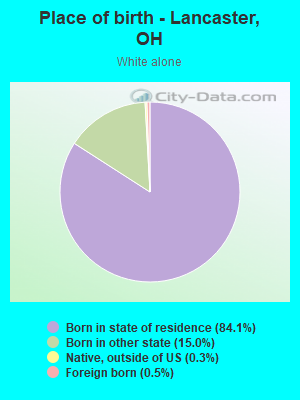
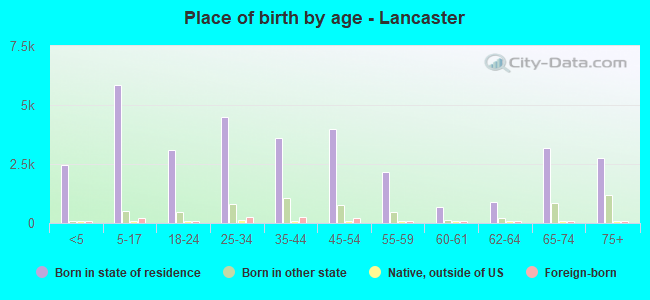
Place of birth - Born in state of residence (%)
Place of birth - Born in state of residence (%) - White
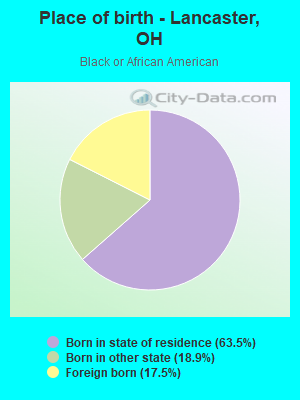
Place of birth - Born in state of residence (%) - Black or African American
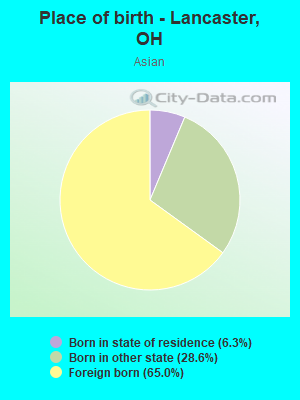
Place of birth - Born in state of residence (%) - Asian
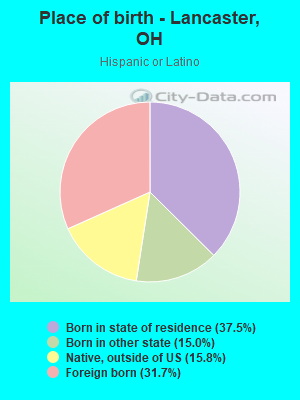
Place of birth - Born in state of residence (%) - Hispanic or Latino
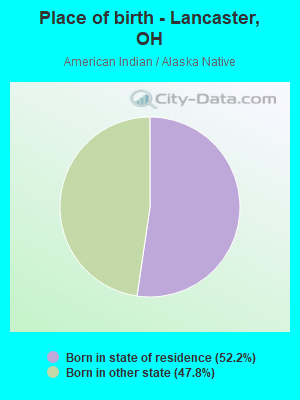
Place of birth - Born in state of residence (%) - American Indian and Alaska Native
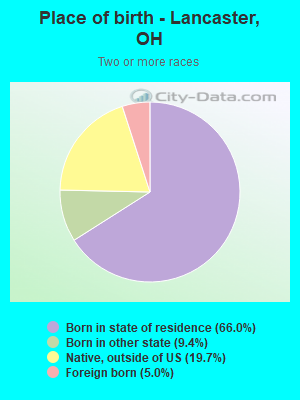
Place of birth - Born in state of residence (%) - Multirace
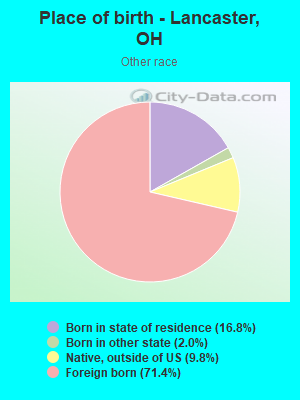
Place of birth - Born in state of residence (%) - Other Race
Place of birth - Born in other state (%)
Place of birth - Born in other state (%) - White
Place of birth - Born in other state (%) - Black or African American
Place of birth - Born in other state (%) - Asian
Place of birth - Born in other state (%) - Hispanic or Latino
Place of birth - Born in other state (%) - American Indian and Alaska Native
Place of birth - Born in other state (%) - Multirace
Place of birth - Born in other state (%) - Other Race
Place of birth - Native, outside of US (%)
Place of birth - Native, outside of US (%) - White
Place of birth - Native, outside of US (%) - Black or African American
Place of birth - Native, outside of US (%) - Asian
Place of birth - Native, outside of US (%) - Hispanic or Latino
Place of birth - Native, outside of US (%) - American Indian and Alaska Native
Place of birth - Native, outside of US (%) - Multirace
Place of birth - Native, outside of US (%) - Other Race
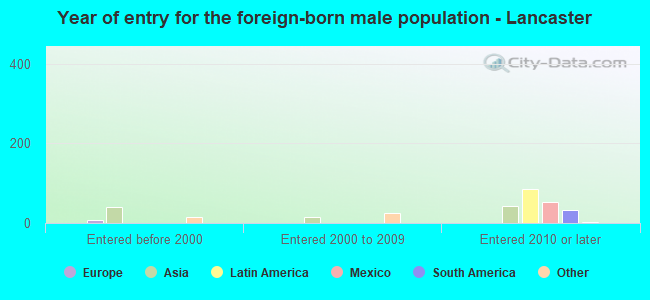
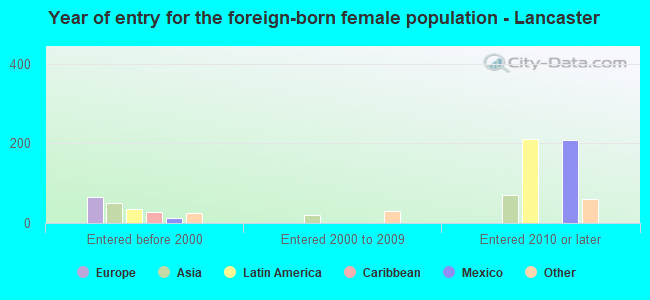
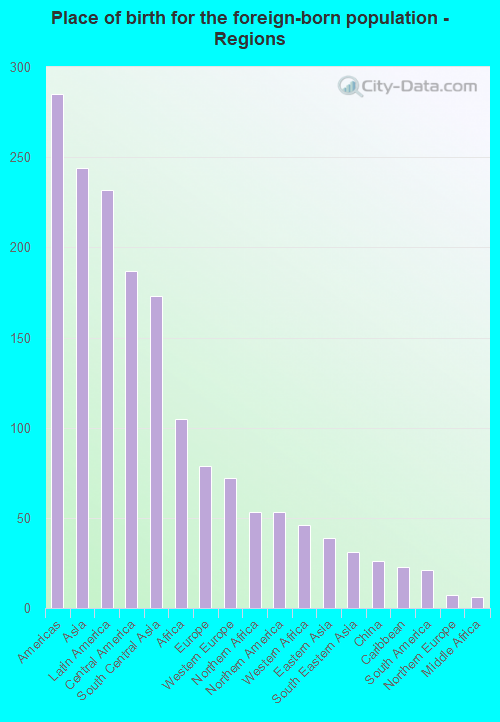
Place of birth - Foreign born (%)
Place of birth - Foreign born (%) - White
Place of birth - Foreign born (%) - Black or African American
Place of birth - Foreign born (%) - Asian
Place of birth - Foreign born (%) - Hispanic or Latino
Place of birth - Foreign born (%) - American Indian and Alaska Native
Place of birth - Foreign born (%) - Multirace
Place of birth - Foreign born (%) - Other Race
Residents speaking English at home (%)
Residents speaking English at home - Born in the United States (%)
Residents speaking English at home - Native, born elsewhere (%)
Residents speaking English at home - Foreign born (%)
Residents speaking Spanish at home (%)
Residents speaking Spanish at home - Born in the United States (%)
Residents speaking Spanish at home - Native, born elsewhere (%)
Residents speaking Spanish at home - Foreign born (%)
Residents speaking other language at home (%)
Residents speaking other language at home - Born in the United States (%)
Residents speaking other language at home - Native, born elsewhere (%)
Residents speaking other language at home - Foreign born (%)
Marital status - Never married (%)
Marital status - Now married (%)
Marital status - Separated (%)
Marital status - Widowed (%)
Marital status - Divorced (%)
Ancestries Reported - Arab (%)
Ancestries Reported - Czech (%)
Ancestries Reported - Danish (%)
Ancestries Reported - Dutch (%)
Ancestries Reported - English (%)
Ancestries Reported - French (%)
Ancestries Reported - French Canadian (%)
Ancestries Reported - German (%)
Ancestries Reported - Greek (%)
Ancestries Reported - Hungarian (%)
Ancestries Reported - Irish (%)
Ancestries Reported - Italian (%)
Ancestries Reported - Lithuanian (%)
Ancestries Reported - Norwegian (%)
Ancestries Reported - Polish (%)
Ancestries Reported - Portuguese (%)
Ancestries Reported - Russian (%)
Ancestries Reported - Scotch-Irish (%)
Ancestries Reported - Scottish (%)
Ancestries Reported - Slovak (%)
Ancestries Reported - Subsaharan African (%)
Ancestries Reported - Swedish (%)
Ancestries Reported - Swiss (%)
Ancestries Reported - Ukrainian (%)
Ancestries Reported - United States (%)
Ancestries Reported - Welsh (%)
Ancestries Reported - West Indian (%)
Ancestries Reported - Other (%)
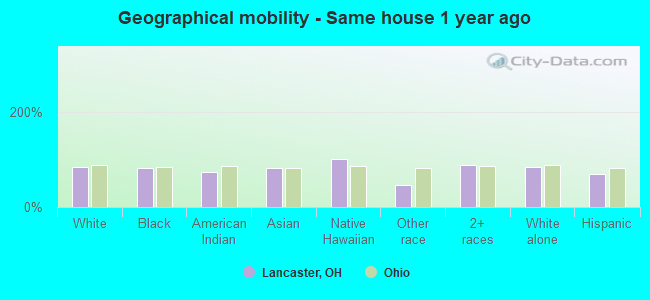
Geographical mobility - Same house 1 year ago (%)
Geographical mobility - Same house 1 year ago (%) - White
Geographical mobility - Same house 1 year ago (%) - Black or African American
Geographical mobility - Same house 1 year ago (%) - Asian
Geographical mobility - Same house 1 year ago (%) - Hispanic or Latino
Geographical mobility - Same house 1 year ago (%) - American Indian and Alaska Native
Geographical mobility - Same house 1 year ago (%) - Multirace
Geographical mobility - Same house 1 year ago (%) - Other Race
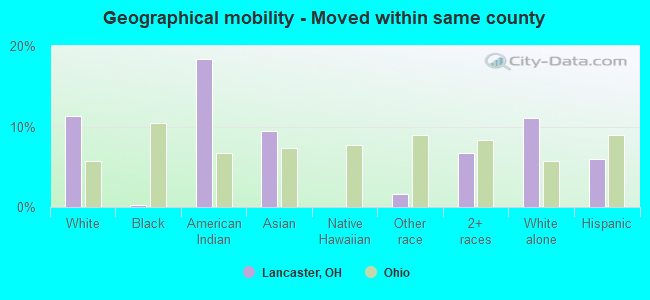
Geographical mobility - Moved within same county (%)
Geographical mobility - Moved within same county (%) - White
Geographical mobility - Moved within same county (%) - Black or African American
Geographical mobility - Moved within same county (%) - Asian
Geographical mobility - Moved within same county (%) - Hispanic or Latino
Geographical mobility - Moved within same county (%) - American Indian and Alaska Native
Geographical mobility - Moved within same county (%) - Multirace
Geographical mobility - Moved within same county (%) - Other Race
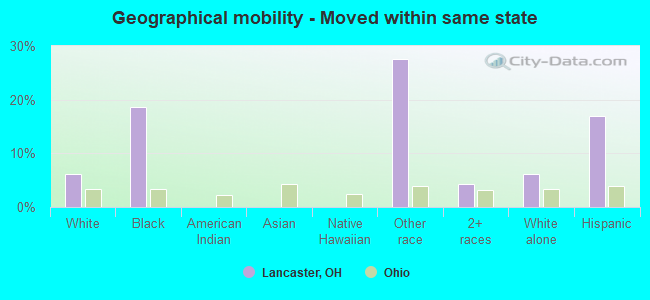
Geographical mobility - Moved from different county within same state (%)
Geographical mobility - Moved from different county within same state (%) - White
Geographical mobility - Moved from different county within same state (%) - Black or African American
Geographical mobility - Moved from different county within same state (%) - Asian
Geographical mobility - Moved from different county within same state (%) - Hispanic or Latino
Geographical mobility - Moved from different county within same state (%) - American Indian and Alaska Native
Geographical mobility - Moved from different county within same state (%) - Multirace
Geographical mobility - Moved from different county within same state (%) - Other Race
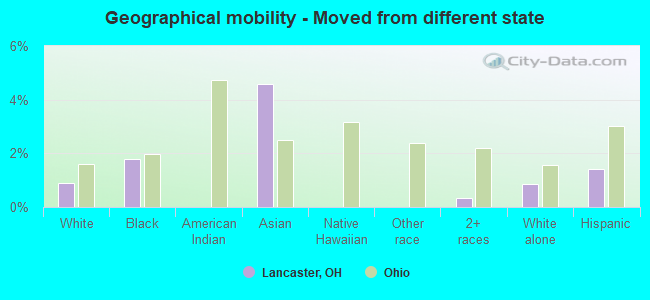
Geographical mobility - Moved from different state (%)
Geographical mobility - Moved from different state (%) - White
Geographical mobility - Moved from different state (%) - Black or African American
Geographical mobility - Moved from different state (%) - Asian
Geographical mobility - Moved from different state (%) - Hispanic or Latino
Geographical mobility - Moved from different state (%) - American Indian and Alaska Native
Geographical mobility - Moved from different state (%) - Multirace
Geographical mobility - Moved from different state (%) - Other Race
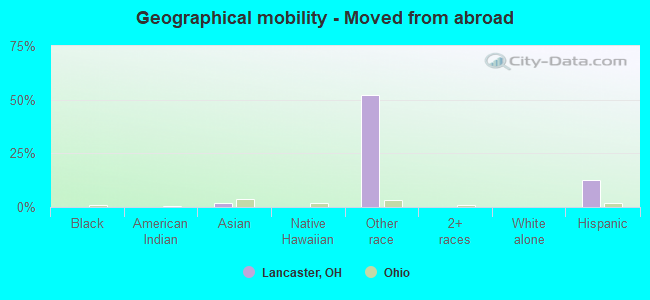
Geographical mobility - Moved from abroad (%)
Geographical mobility - Moved from abroad (%) - White
Geographical mobility - Moved from abroad (%) - Black or African American
Geographical mobility - Moved from abroad (%) - Asian
Geographical mobility - Moved from abroad (%) - Hispanic or Latino
Geographical mobility - Moved from abroad (%) - American Indian and Alaska Native
Geographical mobility - Moved from abroad (%) - Multirace
Geographical mobility - Moved from abroad (%) - Other Race
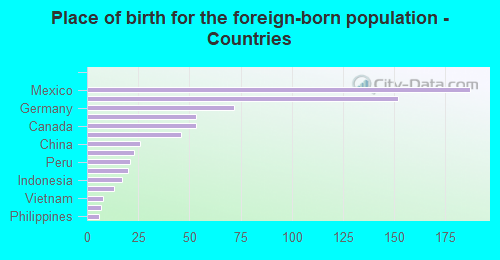
Place of birth for the foreign-born population - Ireland (%)
Place of birth for the foreign-born population - Denmark (%)
Place of birth for the foreign-born population - Norway (%)
Place of birth for the foreign-born population - Sweden (%)
Place of birth for the foreign-born population - United Kingdom (%)
Place of birth for the foreign-born population - England (%)
Place of birth for the foreign-born population - Scotland (%)
Place of birth for the foreign-born population - Other Northern Europe (%)
Place of birth for the foreign-born population - Austria (%)
Place of birth for the foreign-born population - Belgium (%)
Place of birth for the foreign-born population - France (%)
Place of birth for the foreign-born population - Germany (%)
Place of birth for the foreign-born population - Netherlands (%)
Place of birth for the foreign-born population - Switzerland (%)
Place of birth for the foreign-born population - Other Western Europe (%)
Place of birth for the foreign-born population - Greece (%)
Place of birth for the foreign-born population - Italy (%)
Place of birth for the foreign-born population - Portugal (%)
Place of birth for the foreign-born population - Spain (%)
Place of birth for the foreign-born population - Other Southern Europe (%)
Place of birth for the foreign-born population - Albania (%)
Place of birth for the foreign-born population - Belarus (%)
Place of birth for the foreign-born population - Bosnia and Herzegovina (%)
Place of birth for the foreign-born population - Bulgaria (%)
Place of birth for the foreign-born population - Croatia (%)
Place of birth for the foreign-born population - Czechoslovakia (%)
Place of birth for the foreign-born population - Hungary (%)
Place of birth for the foreign-born population - Latvia (%)
Place of birth for the foreign-born population - Lithuania (%)
Place of birth for the foreign-born population - North Macedonia (Macedonia) (%)
Place of birth for the foreign-born population - Moldova (%)
Place of birth for the foreign-born population - Poland (%)
Place of birth for the foreign-born population - Romania (%)
Place of birth for the foreign-born population - Russia (%)
Place of birth for the foreign-born population - Serbia (%)
Place of birth for the foreign-born population - Ukraine (%)
Place of birth for the foreign-born population - Other Eastern Europe (%)
Place of birth for the foreign-born population - China (%)
Place of birth for the foreign-born population - Hong Kong (%)
Place of birth for the foreign-born population - Taiwan (%)
Place of birth for the foreign-born population - Japan (%)
Place of birth for the foreign-born population - Korea (%)
Place of birth for the foreign-born population - Other Eastern Asia (%)
Place of birth for the foreign-born population - Afghanistan (%)
Place of birth for the foreign-born population - Bangladesh (%)
Place of birth for the foreign-born population - India (%)
Place of birth for the foreign-born population - Iran (%)
Place of birth for the foreign-born population - Kazakhstan (%)
Place of birth for the foreign-born population - Nepal (%)
Place of birth for the foreign-born population - Pakistan (%)
Place of birth for the foreign-born population - Sri Lanka (%)
Place of birth for the foreign-born population - Uzbekistan (%)
Place of birth for the foreign-born population - Other South Central Asia (%)
Place of birth for the foreign-born population - Burma (%)
Place of birth for the foreign-born population - Cambodia (%)
Place of birth for the foreign-born population - Indonesia (%)
Place of birth for the foreign-born population - Laos (%)
Place of birth for the foreign-born population - Malaysia (%)
Place of birth for the foreign-born population - Philippines (%)
Place of birth for the foreign-born population - Singapore (%)
Place of birth for the foreign-born population - Thailand (%)
Place of birth for the foreign-born population - Vietnam (%)
Place of birth for the foreign-born population - Other South Eastern Asia (%)
Place of birth for the foreign-born population - Armenia (%)
Place of birth for the foreign-born population - Iraq (%)
Place of birth for the foreign-born population - Israel (%)
Place of birth for the foreign-born population - Jordan (%)
Place of birth for the foreign-born population - Kuwait (%)
Place of birth for the foreign-born population - Lebanon (%)
Place of birth for the foreign-born population - Saudi Arabia (%)
Place of birth for the foreign-born population - Syria (%)
Place of birth for the foreign-born population - Turkey (%)
Place of birth for the foreign-born population - Yemen (%)
Place of birth for the foreign-born population - Other Western Asia (%)
Place of birth for the foreign-born population - Eritrea (%)
Place of birth for the foreign-born population - Ethiopia (%)
Place of birth for the foreign-born population - Kenya (%)
Place of birth for the foreign-born population - Somalia (%)
Place of birth for the foreign-born population - Uganda (%)
Place of birth for the foreign-born population - Zimbabwe (%)
Place of birth for the foreign-born population - Other Eastern Africa (%)
Place of birth for the foreign-born population - Cameroon (%)
Place of birth for the foreign-born population - Congo (%)
Place of birth for the foreign-born population - Democratic Republic of Congo (Zaire) (%)
Place of birth for the foreign-born population - Other Middle Africa (%)
Place of birth for the foreign-born population - Egypt (%)
Place of birth for the foreign-born population - Morocco (%)
Place of birth for the foreign-born population - Sudan (%)
Place of birth for the foreign-born population - Other Northern Africa (%)
Place of birth for the foreign-born population - South Africa (%)
Place of birth for the foreign-born population - Other Southern Africa (%)
Place of birth for the foreign-born population - Cabo Verde (%)
Place of birth for the foreign-born population - Ghana (%)
Place of birth for the foreign-born population - Liberia (%)
Place of birth for the foreign-born population - Nigeria (%)
Place of birth for the foreign-born population - Senegal (%)
Place of birth for the foreign-born population - Sierra Leone (%)
Place of birth for the foreign-born population - Other Western Africa (%)
Place of birth for the foreign-born population - Australia (%)
Place of birth for the foreign-born population - New Zealand (%)
Place of birth for the foreign-born population - Fiji (%)
Place of birth for the foreign-born population - Micronesia (%)
Place of birth for the foreign-born population - Bahamas (%)
Place of birth for the foreign-born population - Barbados (%)
Place of birth for the foreign-born population - Cuba (%)
Place of birth for the foreign-born population - Dominica (%)
Place of birth for the foreign-born population - Dominican Republic (%)
Place of birth for the foreign-born population - Grenada (%)
Place of birth for the foreign-born population - Haiti (%)
Place of birth for the foreign-born population - Jamaica (%)
Place of birth for the foreign-born population - St. Vincent and the Grenadines (%)
Place of birth for the foreign-born population - Trinidad and Tobago (%)
Place of birth for the foreign-born population - West Indies (%)
Place of birth for the foreign-born population - Other Caribbean (%)
Place of birth for the foreign-born population - Belize (%)
Place of birth for the foreign-born population - Costa Rica (%)
Place of birth for the foreign-born population - El Salvador (%)
Place of birth for the foreign-born population - Guatemala (%)
Place of birth for the foreign-born population - Honduras (%)
Place of birth for the foreign-born population - Mexico (%)
Place of birth for the foreign-born population - Nicaragua (%)
Place of birth for the foreign-born population - Panama (%)
Place of birth for the foreign-born population - Other Central America (%)
Place of birth for the foreign-born population - Argentina (%)
Place of birth for the foreign-born population - Bolivia (%)
Place of birth for the foreign-born population - Brazil (%)
Place of birth for the foreign-born population - Chile (%)
Place of birth for the foreign-born population - Colombia (%)
Place of birth for the foreign-born population - Ecuador (%)
Place of birth for the foreign-born population - Guyana (%)
Place of birth for the foreign-born population - Peru (%)
Place of birth for the foreign-born population - Uruguay (%)
Place of birth for the foreign-born population - Venezuela (%)
Place of birth for the foreign-born population - Other South America (%)
Place of birth for the foreign-born population - Canada (%)
Place of birth for the foreign-born population - Other Northern America (%)
Place of birth for the foreign-born population - Other (%)
Latest news about races in Lancaster, OH collected exclusively by city-data.com from local newspapers, TV, and radio stations
According to 2022 data, the most numerous races in Lancaster, OH are White alone (37,110 residents), Black alone (648 residents), and Two or more races (1,390 residents). 95.4% of Lancaster residents speak English at home. 1.7% of Lancaster, OH residents are foreign-born , which is 132.3% less than the foreign-born rate of 4.0% across the entire state of Ohio.
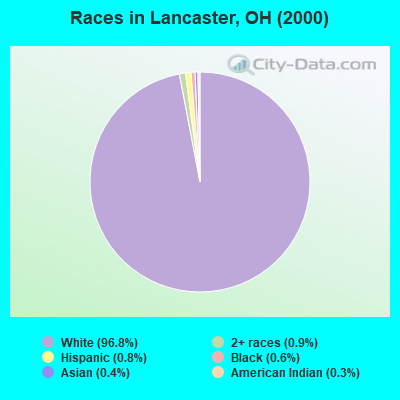
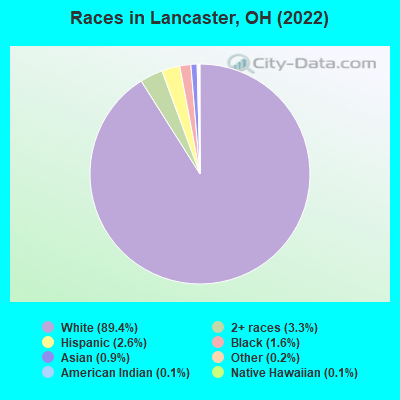
Race distribution in Lancaster
2000 2022
9,538,111 84.0% White alone 1,290,662 11.4% Black alone 217,123 1.9% Hispanic 137,770 1.2% Two or more races 131,670 1.2% Asian alone 21,985 0.2% American Indian alone 13,483 0.1% Other race alone 2,336 0.02% Native Hawaiian and Other
8,948,793 76.1% White alone 1,401,403 11.9% Black alone 529,291 4.5% Two or more races 517,232 4.4% Hispanic 293,387 2.5% Asian alone 52,805 0.4% Other race alone 9,785 0.08% American Indian alone 3,362 0.03% Native Hawaiian and Other
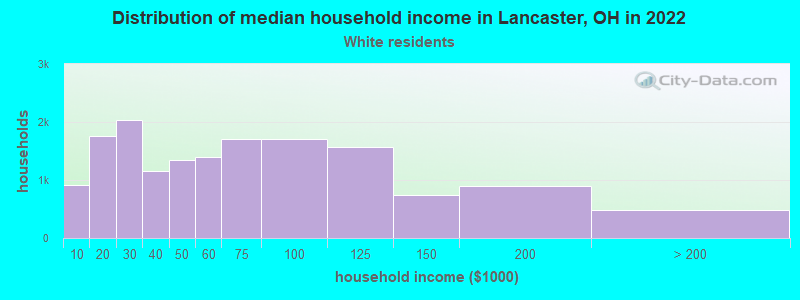
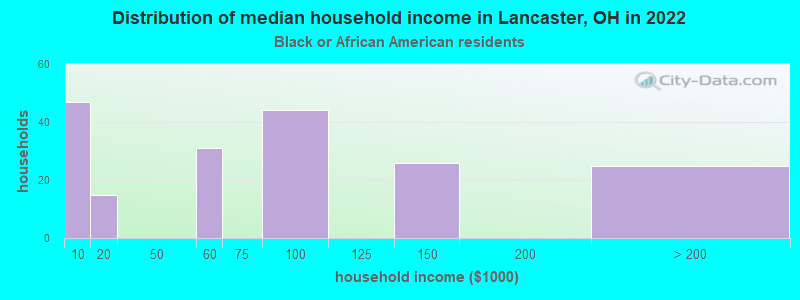
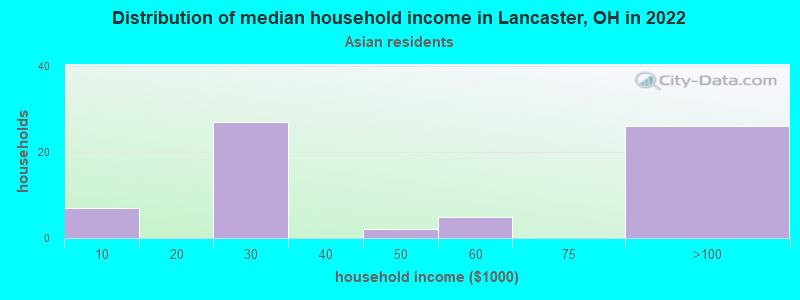
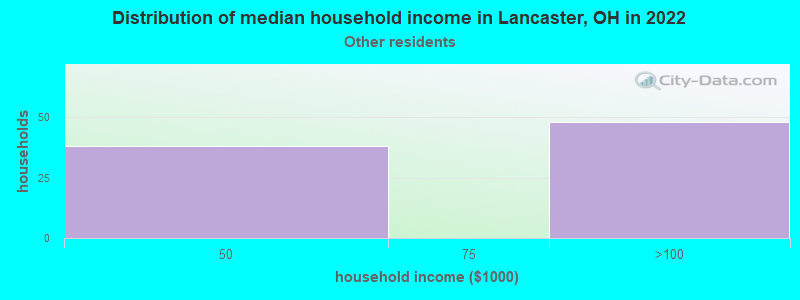
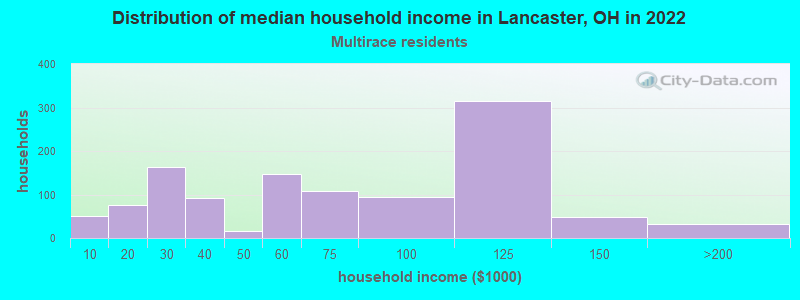
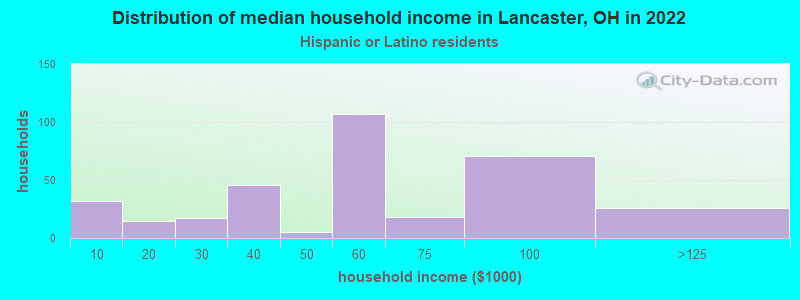
Income and house value in Lancaster Median household income in 2022 $51,825 White non-Hispanic householders$83,499 Some other race householders$65,303 Two or more races householders$48,670 Hispanic or Latino race householdersMedian 2022 house value $185,402 White Non-Hispanic householders$126,073 Black or African American householders$161,550 American Indian or Alaska Native householders $90,195 Asian householders$258,961 Two or more races householders$254,752 Hispanic or Latino householders
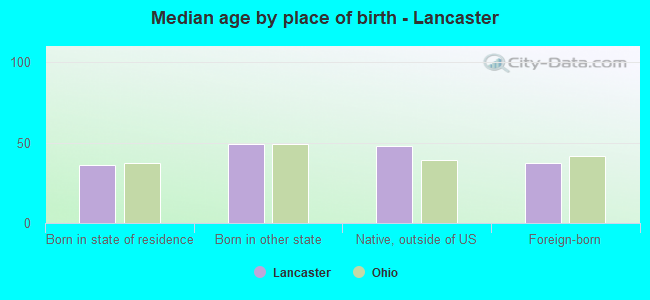
Median age by race in Lancaster
39.6 Median age for White residents38.9 40.4 34.4 Median age for Black or African American residents31.2 35.3 29.7 Median age for American Indian / Alaska Native residents30.1 -658,163,264.6 34.1 Median age for Asian residents30.1 35.0 -800,387,596.1 Median age for Native Hawaiian / Pacific Islander residents-666,666,666.0 -666,666,666.0 31.7 Median age for Other race residents28.1 10.5 29.2 Median age for Two or more races residents26.4 30.1 39.6 Median age for White alone residents38.7 40.7 26.6 Median age for Hispanic or Latino residents30.7 31.9
Owner/renter occupied households by race in Lancaster
House owners and renters - White residents 9,125 56.5% Owner occupied7,039 43.5% Renter occupiedHouse owners and renters - Black or African American residents 49 25.7% Owner occupied141 74.3% Renter occupiedHouse owners and renters - Asian residents 50 39.9% Owner occupied75 60.1% Renter occupiedHouse owners and renters - Other race residents 47 53.3% Owner occupied41 46.7% Renter occupiedHouse owners and renters - Two or more races residents 221 27.6% Owner occupied580 72.4% Renter occupiedHouse owners and renters - White alone residents 9,130 56.4% Owner occupied7,068 43.6% Renter occupiedHouse owners and renters - Hispanic or Latino residents 66 30.8% Owner occupied148 69.2% Renter occupied
Language usage in Lancaster
English speakers - Total 95.4% of residents of Lancaster speak English at home.
1.5% of residents speak Spanish at home 497 87.3% Speak English very well72 12.7% Speak English less than very well2.1% of residents speak other language at home 560 67.1% Speak English very well274 32.9% Speak English less than very well
English speakers - Born in the United States 96.2% of residents of Lancaster speak English at home.
0.2% of residents speak Spanish at home 16 100.0% Speak English very well1.3% of residents speak other language at home 65 77.4% Speak English very well19 22.6% Speak English less than very well
English speakers - Native, born elsewhere 71.1% of residents of Lancaster speak English at home.
44.4% of residents speak Spanish at home 109 65.7% Speak English very well57 34.3% Speak English less than very well4.5% of residents speak other language at home 17 100.0% Speak English very well
English speakers - Foreign-born 16.4% of residents of Lancaster speak English at home.
44.0% of residents speak Spanish at home 419 92.9% Speak English very well32 7.1% Speak English less than very well40.8% of residents speak other language at home 206 49.3% Speak English very well212 50.7% Speak English less than very well
White (Caucasian) - Speak only English Native:
99.1% (34,664)Foreign-born:
42.9% (83)
White (Caucasian) - Speak another language Native:
0.9% (308)Foreign-born:
52.6% (102)
Black or African American - Speak only English Native:
96.5% (494)Foreign-born:
11.3% (12)
Black or African American - Speak another language Native:
4.1% (21)Foreign-born:
83.9% (91)
Asian - Speak only English Native:
17.4% (19)Foreign-born:
1.8% (5)
Asian - Speak another language Native:
86.0% (95)Foreign-born:
100.0% (257)
Other race - Speak another language Native:
44.1% (86)Foreign-born:
100.0% (345)
Two or more races - Speak only English Native:
90.9% (1,708)Foreign-born:
38.9% (53)
Two or more races - Speak another language Native:
9.0% (168)Foreign-born:
56.0% (76)
White alone - Speak only English Native:
99.1% (34,418)Foreign-born:
45.7% (91)
White alone - Speak another language Native:
0.9% (313)Foreign-born:
51.3% (102)
Hispanic or Latino - Speak another language Native:
31.3% (172)Foreign-born:
100.0% (352)
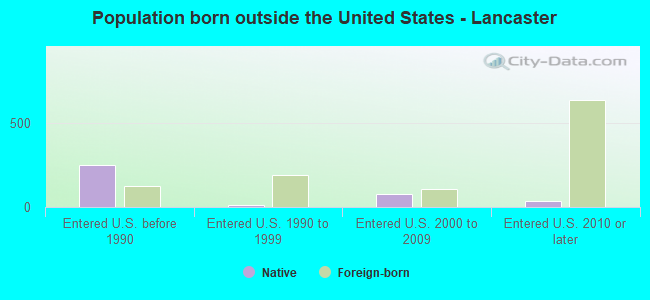
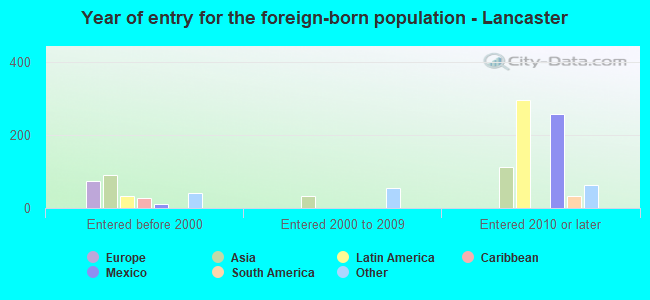
Foreign-born residents in Lancaster 715 residents are foreign born
Marital status for residents in Lancaster Marital status - White (Caucasian) population 15 years and over
Males 35.8% Never married44.5% Now married1.3% Separated5.2% Widowed13.2% DivorcedFemales 27.4% Never married41.3% Now married3.1% Separated11.6% Widowed16.6% DivorcedWomen who gave birth in the past 12 months Now married:
59.3% (373)Unmarried:
40.7% (256)
Women who did not give birth in the past 12 months Now married:
43.5% (3,351)Unmarried:
56.5% (4,345)
Marital status - Black or African American population 15 years and over
Males 46.3% Never married37.0% Now married2.1% Separated3.6% Widowed11.0% DivorcedFemales 51.3% Never married20.0% Now married0.0% Separated0.0% Widowed28.7% DivorcedWomen who gave birth in the past 12 months Now married:
0.0% (0)Unmarried:
100.0% (29)
Women who did not give birth in the past 12 months Now married:
32.3% (29)Unmarried:
67.7% (61)
Marital status - Asian population 15 years and over
Males 52.0% Never married24.0% Now married0.0% Separated0.0% Widowed24.0% DivorcedFemales 33.3% Never married46.1% Now married20.6% Separated0.0% Widowed0.0% DivorcedWomen who did not give birth in the past 12 months Now married:
64.7% (77)Unmarried:
35.3% (42)
Marital status - Other race population 15 years and over
Males 19.8% Never married33.1% Now married0.0% Separated0.0% Widowed47.1% DivorcedFemales 32.2% Never married67.8% Now married0.0% Separated0.0% Widowed0.0% DivorcedWomen who did not give birth in the past 12 months Now married:
100.0% (45)Unmarried:
0.0% (0)
Marital status - Two or more races population 15 years and over
Males 55.3% Never married36.8% Now married2.9% Separated1.7% Widowed3.3% DivorcedFemales 34.4% Never married55.4% Now married1.9% Separated4.2% Widowed4.1% DivorcedWomen who gave birth in the past 12 months Now married:
100.0% (107)Unmarried:
0.0% (0)
Women who did not give birth in the past 12 months Now married:
56.0% (418)Unmarried:
44.0% (329)
Marital status - White alone, not Hispanic / Latino population 15 years and over
Males 35.9% Never married44.3% Now married1.3% Separated5.3% Widowed13.3% DivorcedFemales 27.1% Never married41.3% Now married3.1% Separated11.7% Widowed16.7% DivorcedWomen who gave birth in the past 12 months Now married:
59.3% (376)Unmarried:
40.7% (258)
Women who did not give birth in the past 12 months Now married:
43.9% (3,358)Unmarried:
56.1% (4,285)
Marital status - Hispanic or Latino population 15 years and over
Males 25.5% Never married56.0% Now married0.0% Separated0.0% Widowed18.5% DivorcedFemales 36.5% Never married58.8% Now married0.0% Separated0.0% Widowed4.7% DivorcedWomen who gave birth in the past 12 months Now married:
100.0% (85)Unmarried:
0.0% (0)
Women who did not give birth in the past 12 months Now married:
35.5% (53)Unmarried:
64.5% (97)
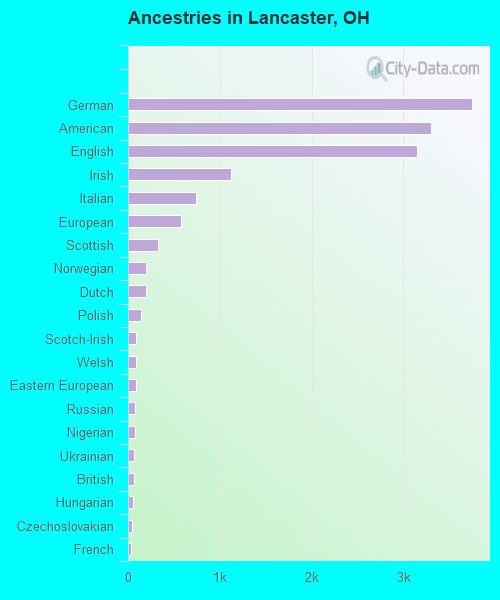
Ancestries in Lancaster
3,746 22.1% German3,296 19.5% American3,154 18.6% English1,123 6.6% Irish741 4.4% Italian573 3.4% European323 1.9% Scottish198 1.2% Norwegian196 1.2% Dutch147 0.9% Polish92 0.5% Scotch-Irish88 0.5% Welsh88 0.5% Eastern European80 0.5% Russian71 0.4% Nigerian68 0.4% Ukrainian67 0.4% British57 0.3% Hungarian39 0.2% Czechoslovakian37 0.2% French33 0.2% Swiss29 0.2% French Canadian29 0.2% Danish27 0.2% Lebanese27 0.2% Romanian27 0.2% Scandinavian25 0.1% Croatian21 0.1% Moroccan17 0.1% Czech14 0.08% Canadian12 0.07% Pennsylvania German12 0.07% Slavic9 0.05% Slovene7 0.04% Slovak3 0.02% Greek3 0.02% Alsatian
Geographical mobility in Lancaster Same house 1 year ago 30,520 82.5% White (Caucasian)465 82.4% Black or African American20 72.5% American Indian / Alaska Native221 82.0% Asian51 100.0% Native Hawaiian / Pacific Islander159 47.0% Other race1,956 88.6% Two or more races30,366 82.7% White alone, not Hispanic / Latino689 69.2% Hispanic or LatinoMoved within same county 4,182 11.3% White / Caucasian2 0.3% Black or African American5 18.3% American Indian / Alaska Native26 9.5% Asian5 1.6% Other race147 6.7% Two or more races4,066 11.1% White alone, not Hispanic / Latino60 6.0% Hispanic or LatinoMoved within same state 2,307 6.2% White / Caucasian106 18.7% Black or African American93 27.5% Other race94 4.3% Two or more races2,278 6.2% White alone, not Hispanic / Latino169 17.0% Hispanic or LatinoMoved from different state 328 0.9% White / Caucasian10 1.8% Black or African American12 4.6% Asian8 0.3% Two or more races318 0.9% White alone, not Hispanic / Latino14 1.4% Hispanic or LatinoMoved from abroad 14 0.0% White5 2.0% Asian177 52.3% Other race14 0.0% White alone, not Hispanic / Latino124 12.4% Hispanic or Latino
Children Nativity (place of birth) in Lancaster
Children under 6 years - Living with two parents Both parents native 1,613 100.0% NativeOne native, one foreign-born parent 127 100.0% NativeChildren under 6 years - Living with one parent Native parent 1,234 100.0% NativeForeign-born parent 10 100.0% NativeChildren 6 to 17 years - Living with two parents Both parents native 2,832 100.0% NativeBoth parents foreign-born 98 100.0% Foreign-bornOne native, one foreign-born parent 146 100.0% NativeChildren 6 to 17 years - Living with one parent Native parent 1,903 100.0% NativeForeign-born parent 70 68.7% Native32 31.3% Foreign-born
Grandparents responsible for own grandchildren in Lancaster
Grandparents (30 to 59 years) White / Caucasian 127 48.0% Responsible for grandchildren137 52.0% Not responsible for grandchildrenWhite alone, not Hispanic / Latino 127 47.2% Responsible for grandchildren142 52.8% Not responsible for grandchildrenGrandparents (60 years and over) White / Caucasian 83 49.1% Responsible for grandchildren86 50.9% Not responsible for grandchildrenWhite alone, not Hispanic / Latino 83 48.2% Responsible for grandchildren89 51.8% Not responsible for grandchildren