Races in Lawrenceville, Georgia (GA) Detailed Stats
Data:
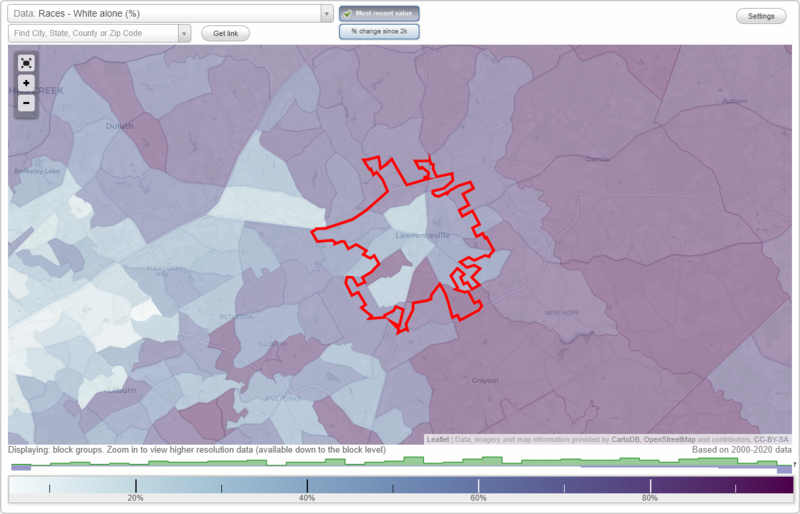
Races - White alone (%)
Races - White alone (% change since 2000)
Races - Black alone (%)
Races - Black alone (% change since 2000)
Races - American Indian alone (%)
Races - American Indian alone (% change since 2000)
Races - Asian alone (%)
Races - Asian alone (% change since 2000)
Races - Hispanic (%)
Races - Hispanic (% change since 2000)
Races - Native Hawaiian and Other Pacific Islander alone (%)
Races - Native Hawaiian and Other Pacific Islander alone (% change since 2000)
Races - Two or more races(%)
Races - Two or more races(% change since 2000)
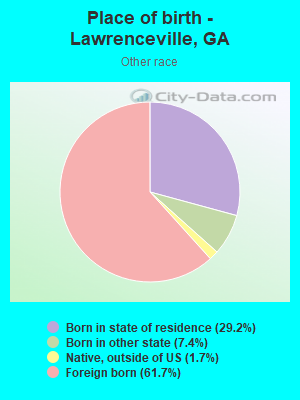
Races - Other race alone (%)
Races - Other race alone (% change since 2000)
Racial diversity
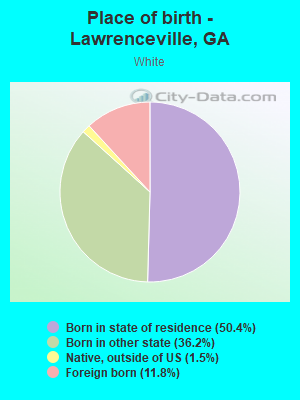
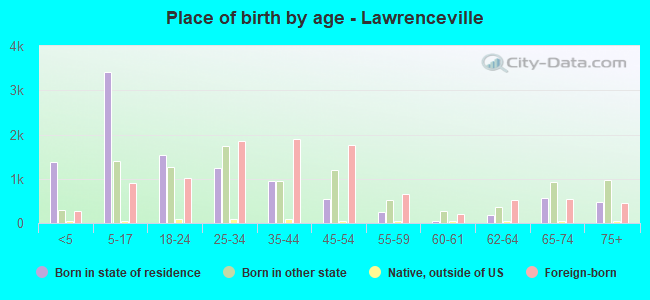
Place of birth - Born in state of residence (%)
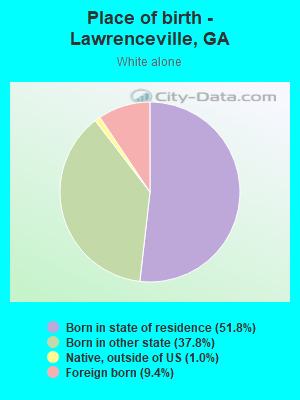
Place of birth - Born in state of residence (%) - White
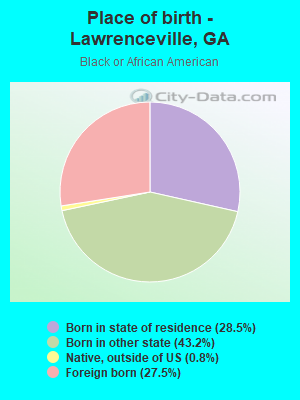
Place of birth - Born in state of residence (%) - Black or African American
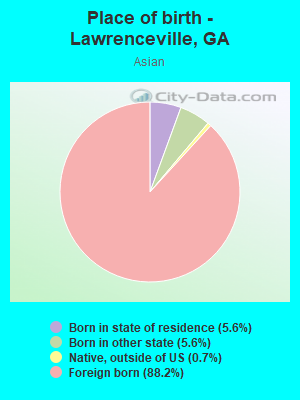
Place of birth - Born in state of residence (%) - Asian
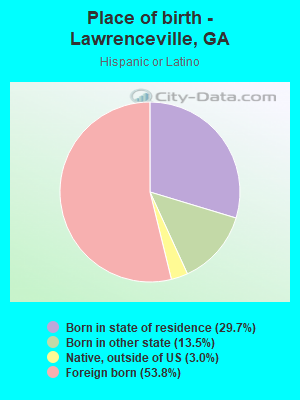
Place of birth - Born in state of residence (%) - Hispanic or Latino
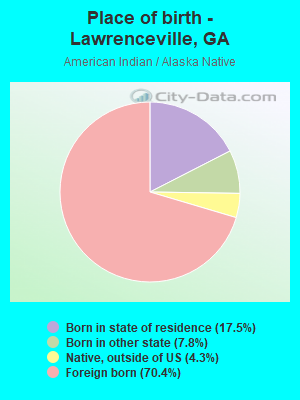
Place of birth - Born in state of residence (%) - American Indian and Alaska Native
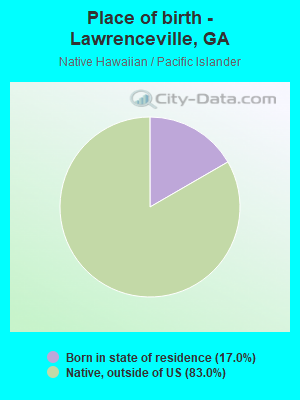
Place of birth - Born in state of residence (%) - Multirace
Place of birth - Born in state of residence (%) - Other Race
Place of birth - Born in other state (%)
Place of birth - Born in other state (%) - White
Place of birth - Born in other state (%) - Black or African American
Place of birth - Born in other state (%) - Asian
Place of birth - Born in other state (%) - Hispanic or Latino
Place of birth - Born in other state (%) - American Indian and Alaska Native
Place of birth - Born in other state (%) - Multirace
Place of birth - Born in other state (%) - Other Race
Place of birth - Native, outside of US (%)
Place of birth - Native, outside of US (%) - White
Place of birth - Native, outside of US (%) - Black or African American
Place of birth - Native, outside of US (%) - Asian
Place of birth - Native, outside of US (%) - Hispanic or Latino
Place of birth - Native, outside of US (%) - American Indian and Alaska Native
Place of birth - Native, outside of US (%) - Multirace
Place of birth - Native, outside of US (%) - Other Race
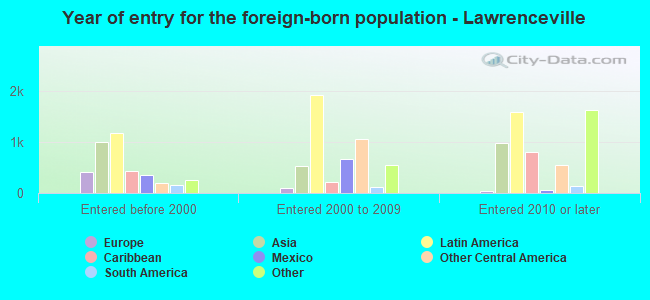
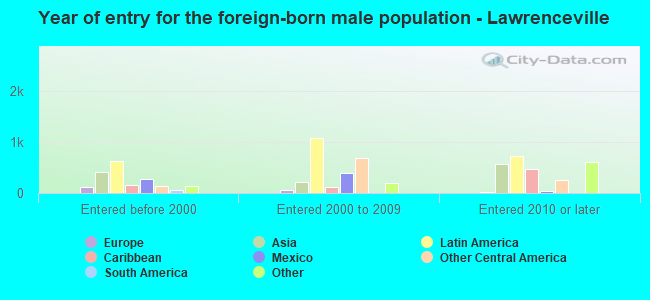
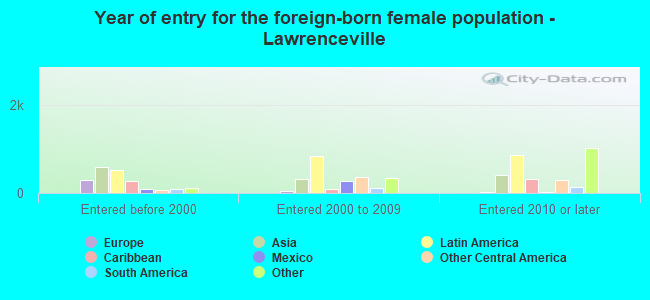
Place of birth - Foreign born (%)
Place of birth - Foreign born (%) - White
Place of birth - Foreign born (%) - Black or African American
Place of birth - Foreign born (%) - Asian
Place of birth - Foreign born (%) - Hispanic or Latino
Place of birth - Foreign born (%) - American Indian and Alaska Native
Place of birth - Foreign born (%) - Multirace
Place of birth - Foreign born (%) - Other Race
Residents speaking English at home (%)
Residents speaking English at home - Born in the United States (%)
Residents speaking English at home - Native, born elsewhere (%)
Residents speaking English at home - Foreign born (%)
Residents speaking Spanish at home (%)
Residents speaking Spanish at home - Born in the United States (%)
Residents speaking Spanish at home - Native, born elsewhere (%)
Residents speaking Spanish at home - Foreign born (%)
Residents speaking other language at home (%)
Residents speaking other language at home - Born in the United States (%)
Residents speaking other language at home - Native, born elsewhere (%)
Residents speaking other language at home - Foreign born (%)
Marital status - Never married (%)
Marital status - Now married (%)
Marital status - Separated (%)
Marital status - Widowed (%)
Marital status - Divorced (%)
Ancestries Reported - Arab (%)
Ancestries Reported - Czech (%)
Ancestries Reported - Danish (%)
Ancestries Reported - Dutch (%)
Ancestries Reported - English (%)
Ancestries Reported - French (%)
Ancestries Reported - French Canadian (%)
Ancestries Reported - German (%)
Ancestries Reported - Greek (%)
Ancestries Reported - Hungarian (%)
Ancestries Reported - Irish (%)
Ancestries Reported - Italian (%)
Ancestries Reported - Lithuanian (%)
Ancestries Reported - Norwegian (%)
Ancestries Reported - Polish (%)
Ancestries Reported - Portuguese (%)
Ancestries Reported - Russian (%)
Ancestries Reported - Scotch-Irish (%)
Ancestries Reported - Scottish (%)
Ancestries Reported - Slovak (%)
Ancestries Reported - Subsaharan African (%)
Ancestries Reported - Swedish (%)
Ancestries Reported - Swiss (%)
Ancestries Reported - Ukrainian (%)
Ancestries Reported - United States (%)
Ancestries Reported - Welsh (%)
Ancestries Reported - West Indian (%)
Ancestries Reported - Other (%)
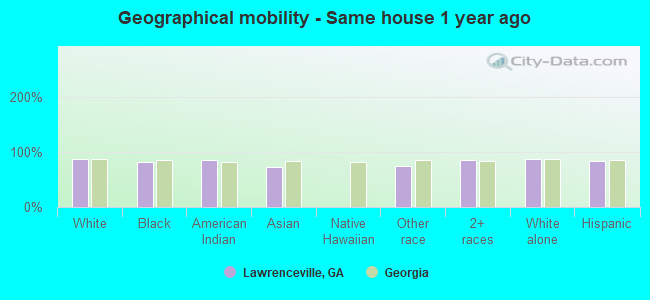
Geographical mobility - Same house 1 year ago (%)
Geographical mobility - Same house 1 year ago (%) - White
Geographical mobility - Same house 1 year ago (%) - Black or African American
Geographical mobility - Same house 1 year ago (%) - Asian
Geographical mobility - Same house 1 year ago (%) - Hispanic or Latino
Geographical mobility - Same house 1 year ago (%) - American Indian and Alaska Native
Geographical mobility - Same house 1 year ago (%) - Multirace
Geographical mobility - Same house 1 year ago (%) - Other Race
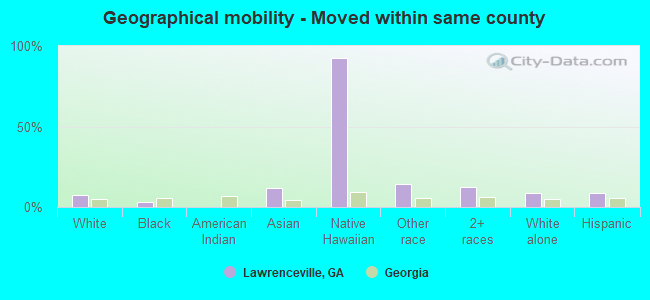
Geographical mobility - Moved within same county (%)
Geographical mobility - Moved within same county (%) - White
Geographical mobility - Moved within same county (%) - Black or African American
Geographical mobility - Moved within same county (%) - Asian
Geographical mobility - Moved within same county (%) - Hispanic or Latino
Geographical mobility - Moved within same county (%) - American Indian and Alaska Native
Geographical mobility - Moved within same county (%) - Multirace
Geographical mobility - Moved within same county (%) - Other Race
Geographical mobility - Moved from different county within same state (%)
Geographical mobility - Moved from different county within same state (%) - White
Geographical mobility - Moved from different county within same state (%) - Black or African American
Geographical mobility - Moved from different county within same state (%) - Asian
Geographical mobility - Moved from different county within same state (%) - Hispanic or Latino
Geographical mobility - Moved from different county within same state (%) - American Indian and Alaska Native
Geographical mobility - Moved from different county within same state (%) - Multirace
Geographical mobility - Moved from different county within same state (%) - Other Race
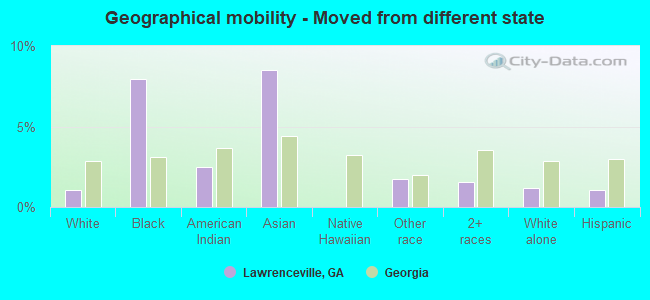
Geographical mobility - Moved from different state (%)
Geographical mobility - Moved from different state (%) - White
Geographical mobility - Moved from different state (%) - Black or African American
Geographical mobility - Moved from different state (%) - Asian
Geographical mobility - Moved from different state (%) - Hispanic or Latino
Geographical mobility - Moved from different state (%) - American Indian and Alaska Native
Geographical mobility - Moved from different state (%) - Multirace
Geographical mobility - Moved from different state (%) - Other Race
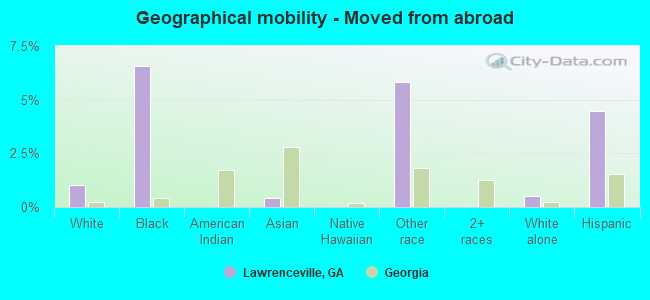
Geographical mobility - Moved from abroad (%)
Geographical mobility - Moved from abroad (%) - White
Geographical mobility - Moved from abroad (%) - Black or African American
Geographical mobility - Moved from abroad (%) - Asian
Geographical mobility - Moved from abroad (%) - Hispanic or Latino
Geographical mobility - Moved from abroad (%) - American Indian and Alaska Native
Geographical mobility - Moved from abroad (%) - Multirace
Geographical mobility - Moved from abroad (%) - Other Race
Place of birth for the foreign-born population - Ireland (%)
Place of birth for the foreign-born population - Denmark (%)
Place of birth for the foreign-born population - Norway (%)
Place of birth for the foreign-born population - Sweden (%)
Place of birth for the foreign-born population - United Kingdom (%)
Place of birth for the foreign-born population - England (%)
Place of birth for the foreign-born population - Scotland (%)
Place of birth for the foreign-born population - Other Northern Europe (%)
Place of birth for the foreign-born population - Austria (%)
Place of birth for the foreign-born population - Belgium (%)
Place of birth for the foreign-born population - France (%)
Place of birth for the foreign-born population - Germany (%)
Place of birth for the foreign-born population - Netherlands (%)
Place of birth for the foreign-born population - Switzerland (%)
Place of birth for the foreign-born population - Other Western Europe (%)
Place of birth for the foreign-born population - Greece (%)
Place of birth for the foreign-born population - Italy (%)
Place of birth for the foreign-born population - Portugal (%)
Place of birth for the foreign-born population - Spain (%)
Place of birth for the foreign-born population - Other Southern Europe (%)
Place of birth for the foreign-born population - Albania (%)
Place of birth for the foreign-born population - Belarus (%)
Place of birth for the foreign-born population - Bosnia and Herzegovina (%)
Place of birth for the foreign-born population - Bulgaria (%)
Place of birth for the foreign-born population - Croatia (%)
Place of birth for the foreign-born population - Czechoslovakia (%)
Place of birth for the foreign-born population - Hungary (%)
Place of birth for the foreign-born population - Latvia (%)
Place of birth for the foreign-born population - Lithuania (%)
Place of birth for the foreign-born population - North Macedonia (Macedonia) (%)
Place of birth for the foreign-born population - Moldova (%)
Place of birth for the foreign-born population - Poland (%)
Place of birth for the foreign-born population - Romania (%)
Place of birth for the foreign-born population - Russia (%)
Place of birth for the foreign-born population - Serbia (%)
Place of birth for the foreign-born population - Ukraine (%)
Place of birth for the foreign-born population - Other Eastern Europe (%)
Place of birth for the foreign-born population - China (%)
Place of birth for the foreign-born population - Hong Kong (%)
Place of birth for the foreign-born population - Taiwan (%)
Place of birth for the foreign-born population - Japan (%)
Place of birth for the foreign-born population - Korea (%)
Place of birth for the foreign-born population - Other Eastern Asia (%)
Place of birth for the foreign-born population - Afghanistan (%)
Place of birth for the foreign-born population - Bangladesh (%)
Place of birth for the foreign-born population - India (%)
Place of birth for the foreign-born population - Iran (%)
Place of birth for the foreign-born population - Kazakhstan (%)
Place of birth for the foreign-born population - Nepal (%)
Place of birth for the foreign-born population - Pakistan (%)
Place of birth for the foreign-born population - Sri Lanka (%)
Place of birth for the foreign-born population - Uzbekistan (%)
Place of birth for the foreign-born population - Other South Central Asia (%)
Place of birth for the foreign-born population - Burma (%)
Place of birth for the foreign-born population - Cambodia (%)
Place of birth for the foreign-born population - Indonesia (%)
Place of birth for the foreign-born population - Laos (%)
Place of birth for the foreign-born population - Malaysia (%)
Place of birth for the foreign-born population - Philippines (%)
Place of birth for the foreign-born population - Singapore (%)
Place of birth for the foreign-born population - Thailand (%)
Place of birth for the foreign-born population - Vietnam (%)
Place of birth for the foreign-born population - Other South Eastern Asia (%)
Place of birth for the foreign-born population - Armenia (%)
Place of birth for the foreign-born population - Iraq (%)
Place of birth for the foreign-born population - Israel (%)
Place of birth for the foreign-born population - Jordan (%)
Place of birth for the foreign-born population - Kuwait (%)
Place of birth for the foreign-born population - Lebanon (%)
Place of birth for the foreign-born population - Saudi Arabia (%)
Place of birth for the foreign-born population - Syria (%)
Place of birth for the foreign-born population - Turkey (%)
Place of birth for the foreign-born population - Yemen (%)
Place of birth for the foreign-born population - Other Western Asia (%)
Place of birth for the foreign-born population - Eritrea (%)
Place of birth for the foreign-born population - Ethiopia (%)
Place of birth for the foreign-born population - Kenya (%)
Place of birth for the foreign-born population - Somalia (%)
Place of birth for the foreign-born population - Uganda (%)
Place of birth for the foreign-born population - Zimbabwe (%)
Place of birth for the foreign-born population - Other Eastern Africa (%)
Place of birth for the foreign-born population - Cameroon (%)
Place of birth for the foreign-born population - Congo (%)
Place of birth for the foreign-born population - Democratic Republic of Congo (Zaire) (%)
Place of birth for the foreign-born population - Other Middle Africa (%)
Place of birth for the foreign-born population - Egypt (%)
Place of birth for the foreign-born population - Morocco (%)
Place of birth for the foreign-born population - Sudan (%)
Place of birth for the foreign-born population - Other Northern Africa (%)
Place of birth for the foreign-born population - South Africa (%)
Place of birth for the foreign-born population - Other Southern Africa (%)
Place of birth for the foreign-born population - Cabo Verde (%)
Place of birth for the foreign-born population - Ghana (%)
Place of birth for the foreign-born population - Liberia (%)
Place of birth for the foreign-born population - Nigeria (%)
Place of birth for the foreign-born population - Senegal (%)
Place of birth for the foreign-born population - Sierra Leone (%)
Place of birth for the foreign-born population - Other Western Africa (%)
Place of birth for the foreign-born population - Australia (%)
Place of birth for the foreign-born population - New Zealand (%)
Place of birth for the foreign-born population - Fiji (%)
Place of birth for the foreign-born population - Micronesia (%)
Place of birth for the foreign-born population - Bahamas (%)
Place of birth for the foreign-born population - Barbados (%)
Place of birth for the foreign-born population - Cuba (%)
Place of birth for the foreign-born population - Dominica (%)
Place of birth for the foreign-born population - Dominican Republic (%)
Place of birth for the foreign-born population - Grenada (%)
Place of birth for the foreign-born population - Haiti (%)
Place of birth for the foreign-born population - Jamaica (%)
Place of birth for the foreign-born population - St. Vincent and the Grenadines (%)
Place of birth for the foreign-born population - Trinidad and Tobago (%)
Place of birth for the foreign-born population - West Indies (%)
Place of birth for the foreign-born population - Other Caribbean (%)
Place of birth for the foreign-born population - Belize (%)
Place of birth for the foreign-born population - Costa Rica (%)
Place of birth for the foreign-born population - El Salvador (%)
Place of birth for the foreign-born population - Guatemala (%)
Place of birth for the foreign-born population - Honduras (%)
Place of birth for the foreign-born population - Mexico (%)
Place of birth for the foreign-born population - Nicaragua (%)
Place of birth for the foreign-born population - Panama (%)
Place of birth for the foreign-born population - Other Central America (%)
Place of birth for the foreign-born population - Argentina (%)
Place of birth for the foreign-born population - Bolivia (%)
Place of birth for the foreign-born population - Brazil (%)
Place of birth for the foreign-born population - Chile (%)
Place of birth for the foreign-born population - Colombia (%)
Place of birth for the foreign-born population - Ecuador (%)
Place of birth for the foreign-born population - Guyana (%)
Place of birth for the foreign-born population - Peru (%)
Place of birth for the foreign-born population - Uruguay (%)
Place of birth for the foreign-born population - Venezuela (%)
Place of birth for the foreign-born population - Other South America (%)
Place of birth for the foreign-born population - Canada (%)
Place of birth for the foreign-born population - Other Northern America (%)
Place of birth for the foreign-born population - Other (%)
Latest news about races in Lawrenceville, GA collected exclusively by city-data.com from local newspapers, TV, and radio stations
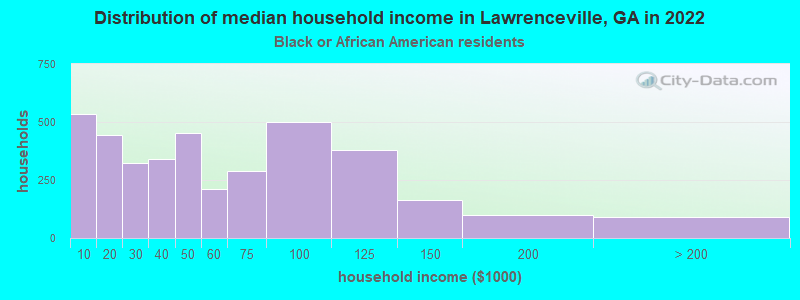
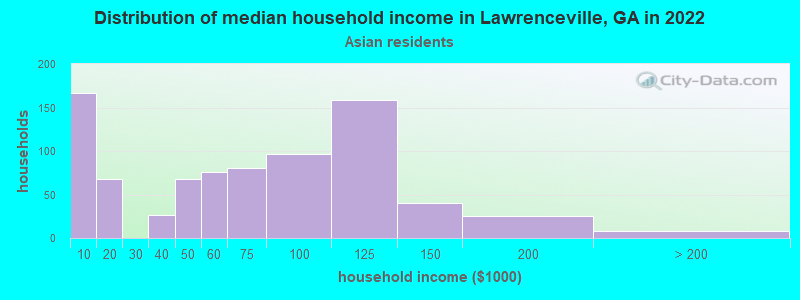
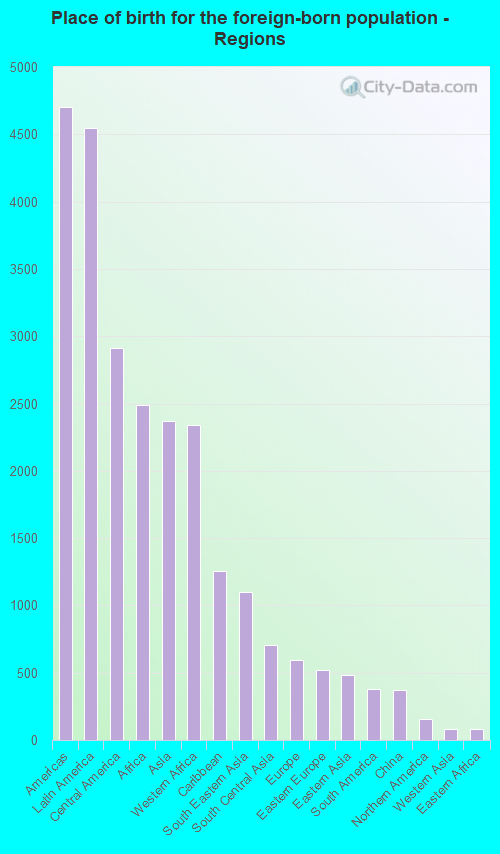
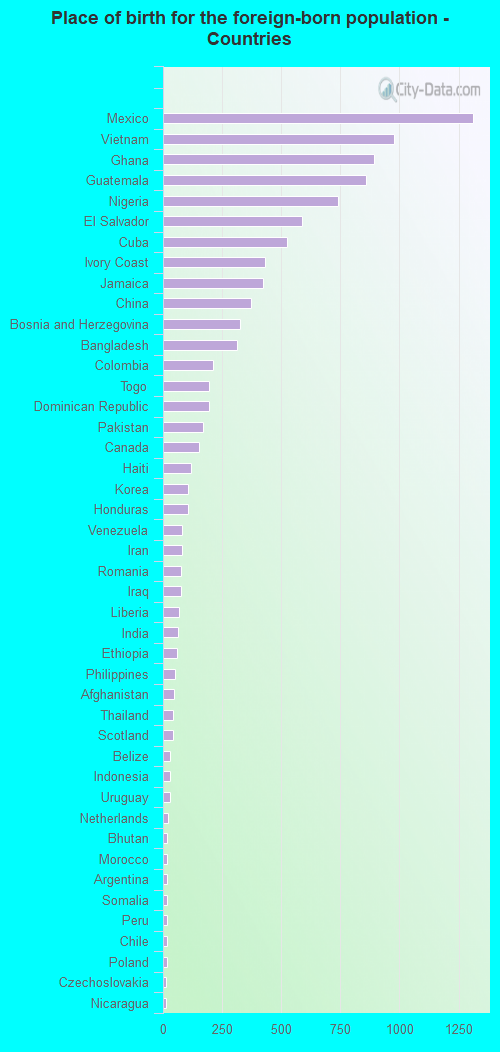
According to 2022 data, the most numerous races in Lawrenceville, GA are White alone (8,482 residents), Black alone (10,775 residents), and Hispanic (7,422 residents). 59.9% of Lawrenceville residents speak English at home. 32.8% of Lawrenceville, GA residents are foreign-born (14.3% born in Latin America, 7.8% born in Africa, 7.5% born in Asia), which is 69.5% greater than the foreign-born rate of 10.0% across the entire state of Georgia.
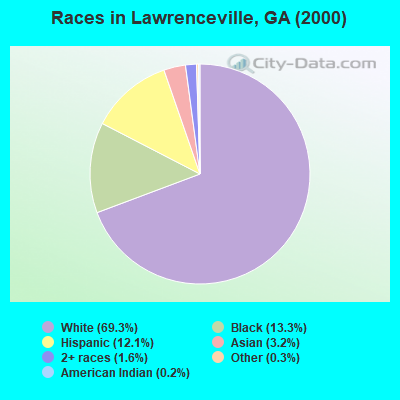
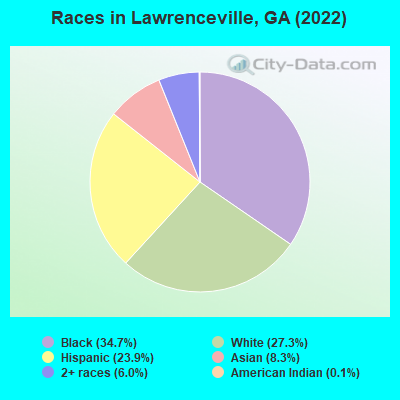
Race distribution in Lawrenceville
2000 2022
5,128,661 62.6% White alone 2,331,465 28.5% Black alone 435,227 5.3% Hispanic 171,513 2.1% Asian alone 87,364 1.1% Two or more races 17,670 0.2% American Indian alone 11,275 0.1% Other race alone 3,278 0.04% Native Hawaiian and Other
5,415,657 49.6% White alone 3,349,240 30.7% Black alone 1,132,604 10.4% Hispanic 479,156 4.4% Asian alone 462,923 4.2% Two or more races 54,416 0.5% Other race alone 11,923 0.1% American Indian alone 6,957 0.06% Native Hawaiian and Other
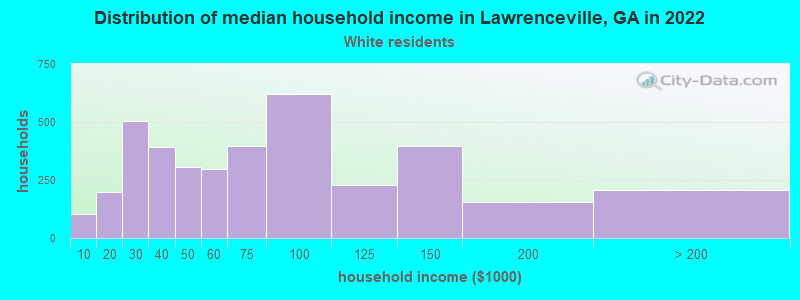
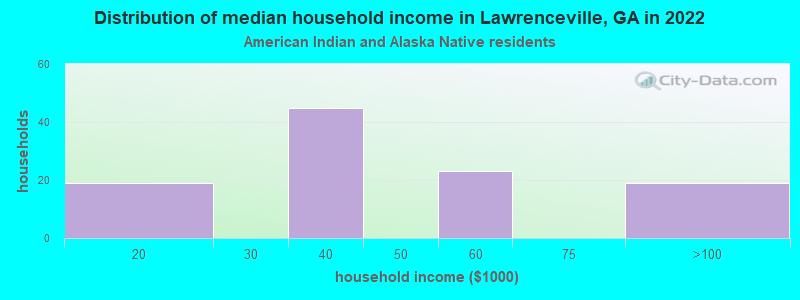
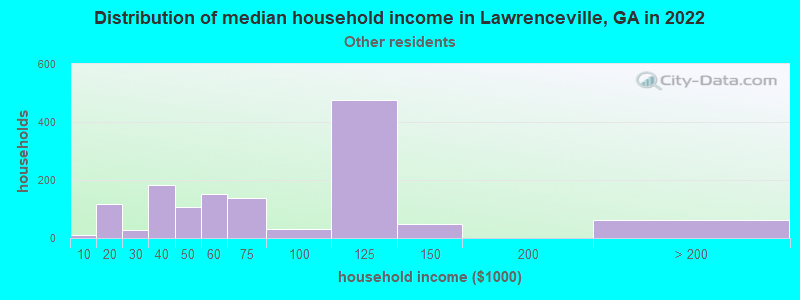
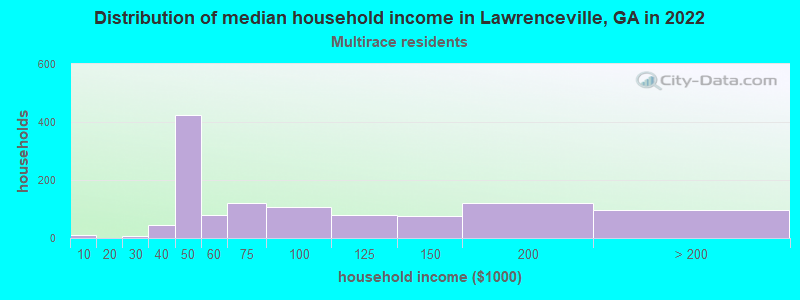
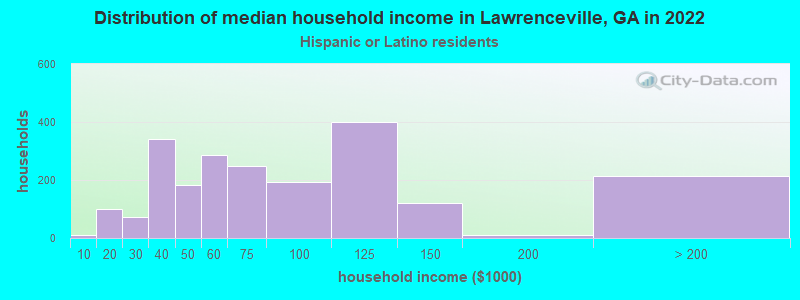
Income and house value in Lawrenceville Median household income in 2022 $61,985 White non-Hispanic householders$50,077 Black householders$55,737 American Indian and Alaska Native householders$63,464 Asian householders$73,132 Some other race householders$53,599 Two or more races householders$71,638 Hispanic or Latino race householdersMedian 2022 house value $359,448 White Non-Hispanic householders$357,594 Black or African American householders$502,239 American Indian or Alaska Native householders $449,697 Asian householders$428,371 Some other race householders$307,524 Two or more races householders$397,155 Hispanic or Latino householders
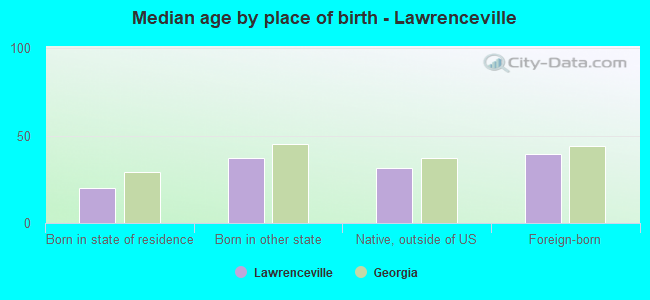
Median age by race in Lawrenceville
40.2 Median age for White residents39.2 42.5 28.5 Median age for Black or African American residents27.9 28.3 43.8 Median age for American Indian / Alaska Native residents26.5 54.2 42.5 Median age for Asian residents46.4 40.6 -1,080,291,969.7 Median age for Native Hawaiian / Pacific Islander residents-1,248,062,014.3 -776,776,776.0 24.6 Median age for Other race residents23.8 25.7 27.9 Median age for Two or more races residents22.7 41.6 41.4 Median age for White alone residents40.5 43.8 25.5 Median age for Hispanic or Latino residents25.1 25.9
Owner/renter occupied households by race in Lawrenceville
House owners and renters - White residents 2,253 60.2% Owner occupied1,487 39.8% Renter occupiedHouse owners and renters - Black or African American residents 1,315 33.7% Owner occupied2,590 66.3% Renter occupiedHouse owners and renters - American Indian / Alaska Native residents 39 49.7% Owner occupied39 50.3% Renter occupiedHouse owners and renters - Asian residents 547 68.8% Owner occupied248 31.2% Renter occupiedHouse owners and renters - Native Hawaiian / Pacific Islander residents 12 100.0% Renter occupiedHouse owners and renters - Other race residents 294 24.6% Owner occupied901 75.4% Renter occupiedHouse owners and renters - Two or more races residents 909 68.5% Owner occupied419 31.5% Renter occupiedHouse owners and renters - White alone residents 2,242 62.8% Owner occupied1,327 37.2% Renter occupiedHouse owners and renters - Hispanic or Latino residents 666 32.0% Owner occupied1,412 68.0% Renter occupied
Language usage in Lawrenceville
English speakers - Total 59.9% of residents of Lawrenceville speak English at home.
20.2% of residents speak Spanish at home 3,143 53.6% Speak English very well2,719 46.4% Speak English less than very well20.0% of residents speak other language at home 3,598 61.9% Speak English very well2,214 38.1% Speak English less than very well
English speakers - Born in the United States 90.3% of residents of Lawrenceville speak English at home.
5.8% of residents speak Spanish at home 437 79.5% Speak English very well113 20.5% Speak English less than very well3.9% of residents speak other language at home 359 96.5% Speak English very well13 3.5% Speak English less than very well
English speakers - Native, born elsewhere 36.6% of residents of Lawrenceville speak English at home.
41.6% of residents speak Spanish at home 136 81.0% Speak English very well32 19.0% Speak English less than very well11.9% of residents speak other language at home 28 58.3% Speak English very well20 41.7% Speak English less than very well
English speakers - Foreign-born 13.0% of residents of Lawrenceville speak English at home.
36.6% of residents speak Spanish at home 1,265 34.7% Speak English very well2,384 65.3% Speak English less than very well50.3% of residents speak other language at home 2,936 58.6% Speak English very well2,077 41.4% Speak English less than very well
White (Caucasian) - Speak only English Native:
90.3% (7,200)Foreign-born:
12.6% (128)
White (Caucasian) - Speak another language Native:
9.2% (734)Foreign-born:
86.7% (883)
Black or African American - Speak only English Native:
97.4% (6,816)Foreign-born:
32.4% (920)
Black or African American - Speak another language Native:
2.8% (193)Foreign-born:
65.0% (1,845)
American Indian / Alaska Native - Speak another language Native:
43.4% (54)Foreign-born:
100.0% (268)
Asian - Speak only English Native:
12.7% (37)Foreign-born:
3.7% (85)
Asian - Speak another language Native:
90.5% (264)Foreign-born:
97.0% (2,207)
Other race - Speak only English Native:
8.4% (130)Foreign-born:
0.6% (16)
Other race - Speak another language Native:
91.9% (1,421)Foreign-born:
99.1% (2,660)
Two or more races - Speak only English Native:
90.4% (2,184)Foreign-born:
16.7% (164)
Two or more races - Speak another language Native:
13.7% (331)Foreign-born:
80.8% (793)
White alone - Speak only English Native:
95.0% (7,097)Foreign-born:
8.6% (66)
White alone - Speak another language Native:
5.0% (374)Foreign-born:
94.5% (729)
Hispanic or Latino - Speak only English Native:
30.6% (950)Foreign-born:
7.8% (306)
Hispanic or Latino - Speak another language Native:
69.6% (2,159)Foreign-born:
93.0% (3,660)
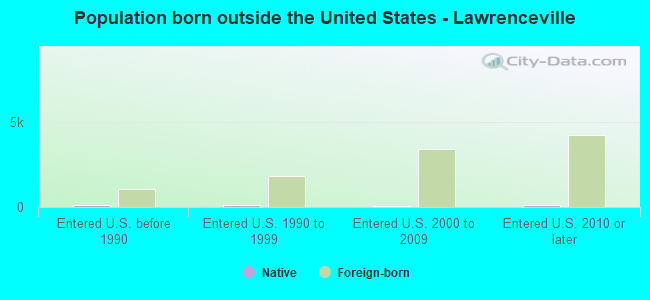
Foreign-born residents in Lawrenceville 10,163 residents are foreign born (14.3% Latin America , 7.8% Africa , 7.5% Asia ).
This city:
32.8%Georgia:
10.4%
Marital status for residents in Lawrenceville Marital status - White (Caucasian) population 15 years and over
Males 28.8% Never married58.8% Now married1.2% Separated1.3% Widowed9.9% DivorcedFemales 26.1% Never married48.6% Now married3.0% Separated11.5% Widowed10.8% DivorcedWomen who gave birth in the past 12 months Now married:
100.0% (57)Unmarried:
0.0% (0)
Women who did not give birth in the past 12 months Now married:
49.1% (1,069)Unmarried:
50.9% (1,107)
Marital status - Black or African American population 15 years and over
Males 46.3% Never married46.5% Now married1.0% Separated0.4% Widowed5.7% DivorcedFemales 56.3% Never married24.7% Now married5.4% Separated2.2% Widowed11.4% DivorcedWomen who gave birth in the past 12 months Now married:
100.0% (114)Unmarried:
0.0% (0)
Women who did not give birth in the past 12 months Now married:
26.5% (999)Unmarried:
73.5% (2,770)
Marital status - American Indian / Alaska Native population 15 years and over
Males 61.1% Never married38.9% Now married0.0% Separated0.0% Widowed0.0% DivorcedFemales 17.3% Never married68.5% Now married0.0% Separated14.2% Widowed0.0% DivorcedWomen who did not give birth in the past 12 months Now married:
79.9% (176)Unmarried:
20.1% (44)
Marital status - Asian population 15 years and over
Males 23.3% Never married67.0% Now married0.6% Separated0.0% Widowed9.1% DivorcedFemales 32.0% Never married53.5% Now married2.2% Separated6.5% Widowed5.9% DivorcedWomen who did not give birth in the past 12 months Now married:
50.4% (346)Unmarried:
49.6% (341)
Marital status - Native Hawaiian / Pacific Islander population 15 years and over
Males 0.0% Never married0.0% Now married0.0% Separated0.0% Widowed100.0% DivorcedFemales 100.0% Never married0.0% Now married0.0% Separated0.0% Widowed0.0% DivorcedWomen who did not give birth in the past 12 months Now married:
0.0% (0)Unmarried:
100.0% (13)
Marital status - Other race population 15 years and over
Males 33.8% Never married49.3% Now married4.1% Separated0.0% Widowed12.9% DivorcedFemales 51.3% Never married41.6% Now married0.8% Separated0.0% Widowed6.3% DivorcedWomen who gave birth in the past 12 months Now married:
100.0% (13)Unmarried:
0.0% (0)
Women who did not give birth in the past 12 months Now married:
40.8% (540)Unmarried:
59.2% (784)
Marital status - Two or more races population 15 years and over
Males 49.0% Never married47.0% Now married1.9% Separated0.0% Widowed2.1% DivorcedFemales 35.5% Never married18.8% Now married1.8% Separated33.7% Widowed10.3% DivorcedWomen who gave birth in the past 12 months Now married:
10.0% (6)Unmarried:
90.0% (58)
Women who did not give birth in the past 12 months Now married:
37.4% (270)Unmarried:
62.6% (452)
Marital status - White alone, not Hispanic / Latino population 15 years and over
Males 27.4% Never married59.5% Now married0.2% Separated1.5% Widowed11.4% DivorcedFemales 22.8% Never married49.3% Now married3.5% Separated13.2% Widowed11.2% DivorcedWomen who gave birth in the past 12 months Now married:
100.0% (63)Unmarried:
0.0% (0)
Women who did not give birth in the past 12 months Now married:
51.4% (944)Unmarried:
48.6% (892)
Marital status - Hispanic or Latino population 15 years and over
Males 36.6% Never married50.7% Now married5.0% Separated0.0% Widowed7.8% DivorcedFemales 48.0% Never married43.1% Now married1.5% Separated0.3% Widowed7.0% DivorcedWomen who gave birth in the past 12 months Now married:
30.6% (16)Unmarried:
69.4% (35)
Women who did not give birth in the past 12 months Now married:
45.6% (1,046)Unmarried:
54.4% (1,248)
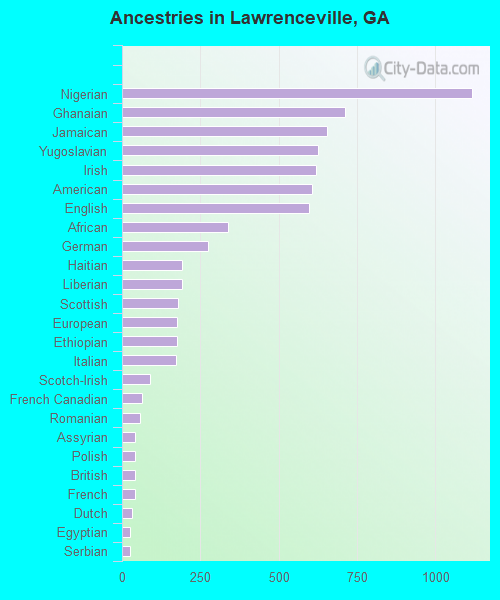
Ancestries in Lawrenceville
1,116 6.0% Nigerian711 3.8% Ghanaian654 3.5% Jamaican625 3.3% Yugoslavian618 3.3% Irish608 3.3% American597 3.2% English340 1.8% African275 1.5% German192 1.0% Haitian191 1.0% Liberian180 1.0% Scottish176 0.9% European175 0.9% Ethiopian174 0.9% Italian89 0.5% Scotch-Irish64 0.3% French Canadian57 0.3% Romanian42 0.2% Assyrian42 0.2% Polish40 0.2% British40 0.2% French31 0.2% Dutch27 0.1% Egyptian25 0.1% Serbian19 0.1% Iranian18 0.10% Moroccan17 0.09% Somali12 0.06% Czech11 0.06% Austrian10 0.05% Celtic9 0.05% Norwegian7 0.04% Canadian6 0.03% Greek5 0.03% Sierra Leonean5 0.03% U.S. Virgin Islander
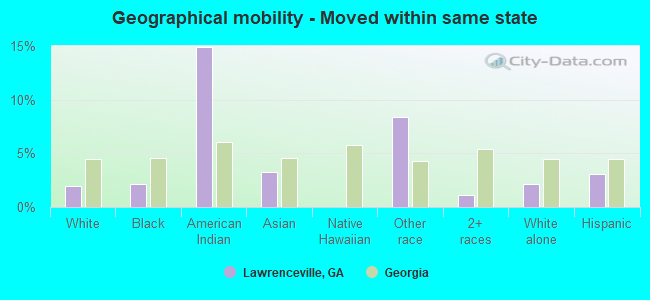
Geographical mobility in Lawrenceville Same house 1 year ago 8,170 87.9% White (Caucasian)9,060 82.1% Black or African American312 85.3% American Indian / Alaska Native1,883 73.4% Asian3,228 75.2% Other race3,137 85.9% Two or more races7,332 87.0% White alone, not Hispanic / Latino6,199 83.7% Hispanic or LatinoMoved within same county 687 7.4% White / Caucasian370 3.4% Black or African American303 11.8% Asian13 92.7% Native Hawaiian / Pacific Islander614 14.3% Other race453 12.4% Two or more races735 8.7% White alone, not Hispanic / Latino657 8.9% Hispanic or LatinoMoved within same state 181 1.9% White / Caucasian237 2.1% Black or African American54 14.9% American Indian / Alaska Native83 3.2% Asian360 8.4% Other race41 1.1% Two or more races183 2.2% White alone, not Hispanic / Latino225 3.0% Hispanic or LatinoMoved from different state 96 1.0% White / Caucasian877 7.9% Black or African American9 2.5% American Indian / Alaska Native218 8.5% Asian74 1.7% Other race57 1.5% Two or more races100 1.2% White alone, not Hispanic / Latino78 1.1% Hispanic or LatinoMoved from abroad 94 1.0% White724 6.6% Black or African American10 0.4% Asian249 5.8% Other race43 0.5% White alone, not Hispanic / Latino331 4.5% Hispanic or Latino
Children Nativity (place of birth) in Lawrenceville
Children under 6 years - Living with two parents Both parents native 324 98.6% Native5 1.4% Foreign-bornBoth parents foreign-born 334 55.0% Native273 45.0% Foreign-bornOne native, one foreign-born parent 454 100.0% NativeChildren under 6 years - Living with one parent Native parent 569 100.0% NativeForeign-born parent 469 100.0% NativeChildren 6 to 17 years - Living with two parents Both parents native 921 100.0% NativeBoth parents foreign-born 1,235 71.6% Native490 28.4% Foreign-bornOne native, one foreign-born parent 299 100.0% NativeChildren 6 to 17 years - Living with one parent Native parent 827 100.0% NativeForeign-born parent 911 55.0% Native745 45.0% Foreign-born
Grandparents responsible for own grandchildren in Lawrenceville
Grandparents (30 to 59 years) White / Caucasian 17 64.6% Responsible for grandchildren9 35.4% Not responsible for grandchildrenBlack or African American 52 23.7% Responsible for grandchildren166 76.3% Not responsible for grandchildrenTwo or more races 70 100.0% Responsible for grandchildrenHispanic or Latino 67 83.4% Responsible for grandchildren13 16.6% Not responsible for grandchildren
Grandparents (60 years and over) White / Caucasian 29 100.0% Not responsible for grandchildrenBlack or African American 290 100.0% Not responsible for grandchildrenTwo or more races 59 100.0% Not responsible for grandchildrenHispanic or Latino 147 100.0% Not responsible for grandchildren