Races in Lee's Summit, Missouri (MO) Detailed Stats
Data:
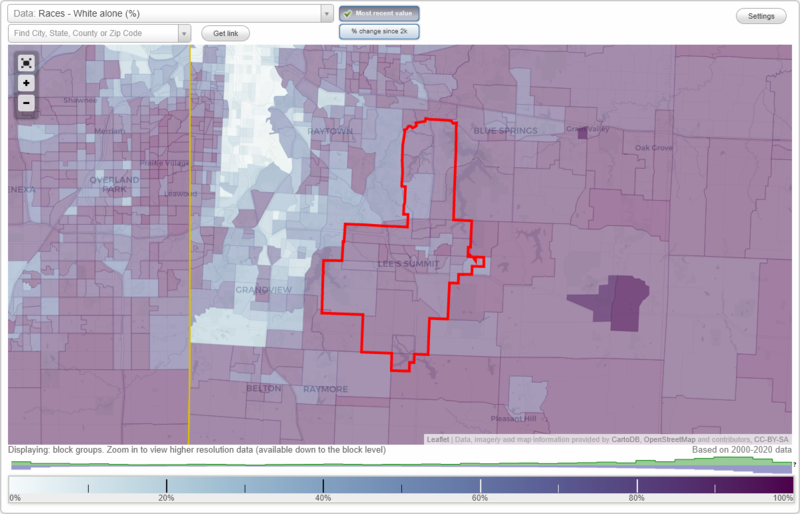
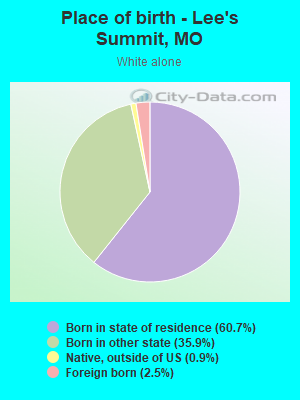
Races - White alone (%)
Races - White alone (% change since 2000)
Races - Black alone (%)
Races - Black alone (% change since 2000)
Races - American Indian alone (%)
Races - American Indian alone (% change since 2000)
Races - Asian alone (%)
Races - Asian alone (% change since 2000)
Races - Hispanic (%)
Races - Hispanic (% change since 2000)
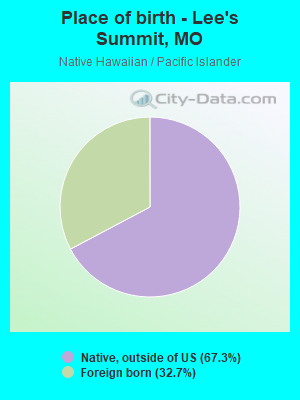
Races - Native Hawaiian and Other Pacific Islander alone (%)
Races - Native Hawaiian and Other Pacific Islander alone (% change since 2000)
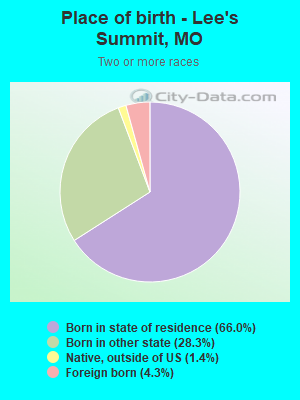
Races - Two or more races(%)
Races - Two or more races(% change since 2000)
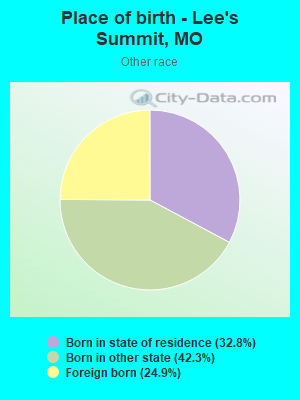
Races - Other race alone (%)
Races - Other race alone (% change since 2000)
Racial diversity
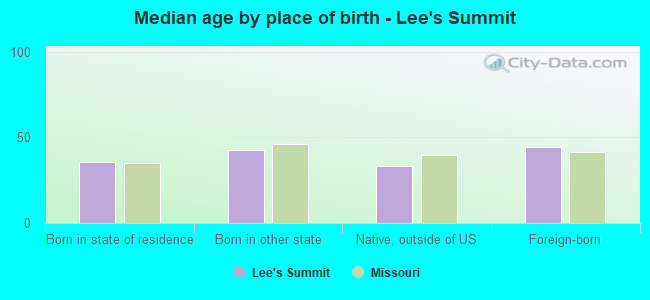
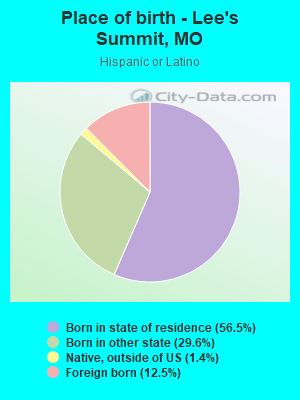
Place of birth - Born in state of residence (%)
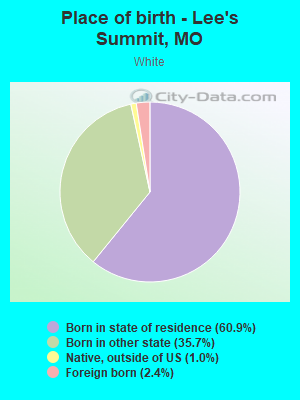
Place of birth - Born in state of residence (%) - White
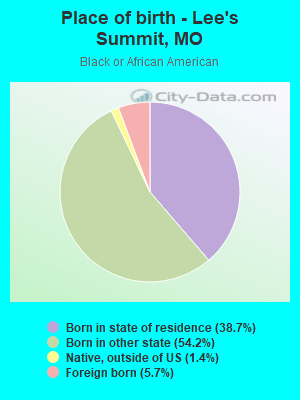
Place of birth - Born in state of residence (%) - Black or African American
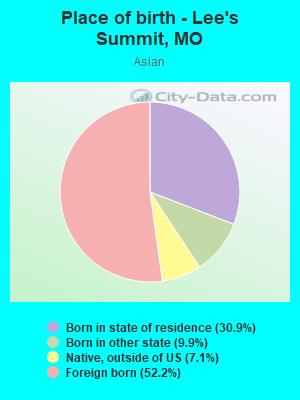
Place of birth - Born in state of residence (%) - Asian
Place of birth - Born in state of residence (%) - Hispanic or Latino
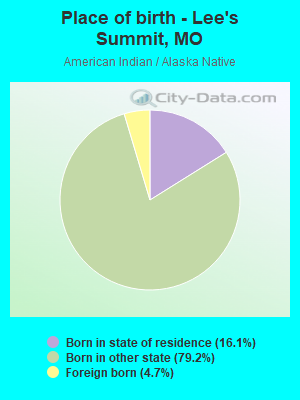
Place of birth - Born in state of residence (%) - American Indian and Alaska Native
Place of birth - Born in state of residence (%) - Multirace
Place of birth - Born in state of residence (%) - Other Race
Place of birth - Born in other state (%)
Place of birth - Born in other state (%) - White
Place of birth - Born in other state (%) - Black or African American
Place of birth - Born in other state (%) - Asian
Place of birth - Born in other state (%) - Hispanic or Latino
Place of birth - Born in other state (%) - American Indian and Alaska Native
Place of birth - Born in other state (%) - Multirace
Place of birth - Born in other state (%) - Other Race
Place of birth - Native, outside of US (%)
Place of birth - Native, outside of US (%) - White
Place of birth - Native, outside of US (%) - Black or African American
Place of birth - Native, outside of US (%) - Asian
Place of birth - Native, outside of US (%) - Hispanic or Latino
Place of birth - Native, outside of US (%) - American Indian and Alaska Native
Place of birth - Native, outside of US (%) - Multirace
Place of birth - Native, outside of US (%) - Other Race
Place of birth - Foreign born (%)
Place of birth - Foreign born (%) - White
Place of birth - Foreign born (%) - Black or African American
Place of birth - Foreign born (%) - Asian
Place of birth - Foreign born (%) - Hispanic or Latino
Place of birth - Foreign born (%) - American Indian and Alaska Native
Place of birth - Foreign born (%) - Multirace
Place of birth - Foreign born (%) - Other Race
Residents speaking English at home (%)
Residents speaking English at home - Born in the United States (%)
Residents speaking English at home - Native, born elsewhere (%)
Residents speaking English at home - Foreign born (%)
Residents speaking Spanish at home (%)
Residents speaking Spanish at home - Born in the United States (%)
Residents speaking Spanish at home - Native, born elsewhere (%)
Residents speaking Spanish at home - Foreign born (%)
Residents speaking other language at home (%)
Residents speaking other language at home - Born in the United States (%)
Residents speaking other language at home - Native, born elsewhere (%)
Residents speaking other language at home - Foreign born (%)
Marital status - Never married (%)
Marital status - Now married (%)
Marital status - Separated (%)
Marital status - Widowed (%)
Marital status - Divorced (%)
Ancestries Reported - Arab (%)
Ancestries Reported - Czech (%)
Ancestries Reported - Danish (%)
Ancestries Reported - Dutch (%)
Ancestries Reported - English (%)
Ancestries Reported - French (%)
Ancestries Reported - French Canadian (%)
Ancestries Reported - German (%)
Ancestries Reported - Greek (%)
Ancestries Reported - Hungarian (%)
Ancestries Reported - Irish (%)
Ancestries Reported - Italian (%)
Ancestries Reported - Lithuanian (%)
Ancestries Reported - Norwegian (%)
Ancestries Reported - Polish (%)
Ancestries Reported - Portuguese (%)
Ancestries Reported - Russian (%)
Ancestries Reported - Scotch-Irish (%)
Ancestries Reported - Scottish (%)
Ancestries Reported - Slovak (%)
Ancestries Reported - Subsaharan African (%)
Ancestries Reported - Swedish (%)
Ancestries Reported - Swiss (%)
Ancestries Reported - Ukrainian (%)
Ancestries Reported - United States (%)
Ancestries Reported - Welsh (%)
Ancestries Reported - West Indian (%)
Ancestries Reported - Other (%)
Geographical mobility - Same house 1 year ago (%)
Geographical mobility - Same house 1 year ago (%) - White
Geographical mobility - Same house 1 year ago (%) - Black or African American
Geographical mobility - Same house 1 year ago (%) - Asian
Geographical mobility - Same house 1 year ago (%) - Hispanic or Latino
Geographical mobility - Same house 1 year ago (%) - American Indian and Alaska Native
Geographical mobility - Same house 1 year ago (%) - Multirace
Geographical mobility - Same house 1 year ago (%) - Other Race
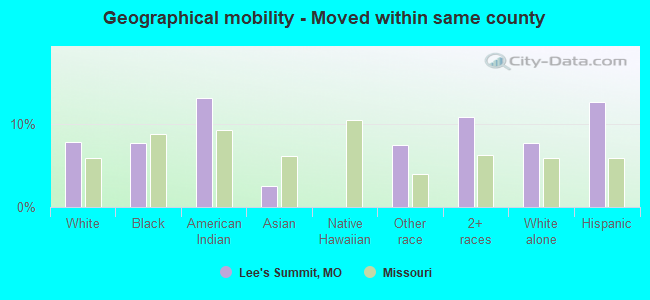
Geographical mobility - Moved within same county (%)
Geographical mobility - Moved within same county (%) - White
Geographical mobility - Moved within same county (%) - Black or African American
Geographical mobility - Moved within same county (%) - Asian
Geographical mobility - Moved within same county (%) - Hispanic or Latino
Geographical mobility - Moved within same county (%) - American Indian and Alaska Native
Geographical mobility - Moved within same county (%) - Multirace
Geographical mobility - Moved within same county (%) - Other Race
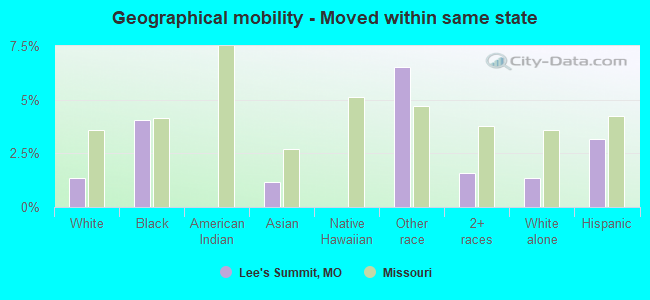
Geographical mobility - Moved from different county within same state (%)
Geographical mobility - Moved from different county within same state (%) - White
Geographical mobility - Moved from different county within same state (%) - Black or African American
Geographical mobility - Moved from different county within same state (%) - Asian
Geographical mobility - Moved from different county within same state (%) - Hispanic or Latino
Geographical mobility - Moved from different county within same state (%) - American Indian and Alaska Native
Geographical mobility - Moved from different county within same state (%) - Multirace
Geographical mobility - Moved from different county within same state (%) - Other Race
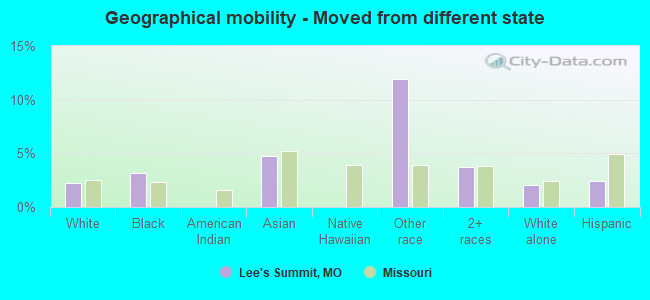
Geographical mobility - Moved from different state (%)
Geographical mobility - Moved from different state (%) - White
Geographical mobility - Moved from different state (%) - Black or African American
Geographical mobility - Moved from different state (%) - Asian
Geographical mobility - Moved from different state (%) - Hispanic or Latino
Geographical mobility - Moved from different state (%) - American Indian and Alaska Native
Geographical mobility - Moved from different state (%) - Multirace
Geographical mobility - Moved from different state (%) - Other Race
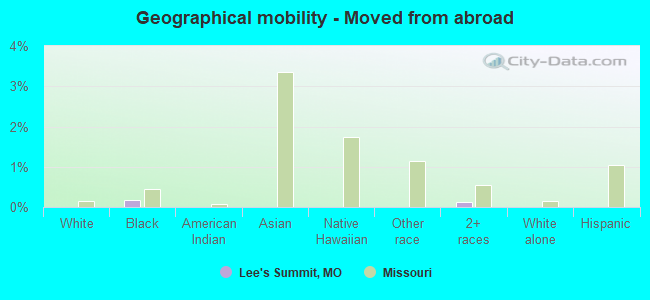
Geographical mobility - Moved from abroad (%)
Geographical mobility - Moved from abroad (%) - White
Geographical mobility - Moved from abroad (%) - Black or African American
Geographical mobility - Moved from abroad (%) - Asian
Geographical mobility - Moved from abroad (%) - Hispanic or Latino
Geographical mobility - Moved from abroad (%) - American Indian and Alaska Native
Geographical mobility - Moved from abroad (%) - Multirace
Geographical mobility - Moved from abroad (%) - Other Race
Place of birth for the foreign-born population - Ireland (%)
Place of birth for the foreign-born population - Denmark (%)
Place of birth for the foreign-born population - Norway (%)
Place of birth for the foreign-born population - Sweden (%)
Place of birth for the foreign-born population - United Kingdom (%)
Place of birth for the foreign-born population - England (%)
Place of birth for the foreign-born population - Scotland (%)
Place of birth for the foreign-born population - Other Northern Europe (%)
Place of birth for the foreign-born population - Austria (%)
Place of birth for the foreign-born population - Belgium (%)
Place of birth for the foreign-born population - France (%)
Place of birth for the foreign-born population - Germany (%)
Place of birth for the foreign-born population - Netherlands (%)
Place of birth for the foreign-born population - Switzerland (%)
Place of birth for the foreign-born population - Other Western Europe (%)
Place of birth for the foreign-born population - Greece (%)
Place of birth for the foreign-born population - Italy (%)
Place of birth for the foreign-born population - Portugal (%)
Place of birth for the foreign-born population - Spain (%)
Place of birth for the foreign-born population - Other Southern Europe (%)
Place of birth for the foreign-born population - Albania (%)
Place of birth for the foreign-born population - Belarus (%)
Place of birth for the foreign-born population - Bosnia and Herzegovina (%)
Place of birth for the foreign-born population - Bulgaria (%)
Place of birth for the foreign-born population - Croatia (%)
Place of birth for the foreign-born population - Czechoslovakia (%)
Place of birth for the foreign-born population - Hungary (%)
Place of birth for the foreign-born population - Latvia (%)
Place of birth for the foreign-born population - Lithuania (%)
Place of birth for the foreign-born population - North Macedonia (Macedonia) (%)
Place of birth for the foreign-born population - Moldova (%)
Place of birth for the foreign-born population - Poland (%)
Place of birth for the foreign-born population - Romania (%)
Place of birth for the foreign-born population - Russia (%)
Place of birth for the foreign-born population - Serbia (%)
Place of birth for the foreign-born population - Ukraine (%)
Place of birth for the foreign-born population - Other Eastern Europe (%)
Place of birth for the foreign-born population - China (%)
Place of birth for the foreign-born population - Hong Kong (%)
Place of birth for the foreign-born population - Taiwan (%)
Place of birth for the foreign-born population - Japan (%)
Place of birth for the foreign-born population - Korea (%)
Place of birth for the foreign-born population - Other Eastern Asia (%)
Place of birth for the foreign-born population - Afghanistan (%)
Place of birth for the foreign-born population - Bangladesh (%)
Place of birth for the foreign-born population - India (%)
Place of birth for the foreign-born population - Iran (%)
Place of birth for the foreign-born population - Kazakhstan (%)
Place of birth for the foreign-born population - Nepal (%)
Place of birth for the foreign-born population - Pakistan (%)
Place of birth for the foreign-born population - Sri Lanka (%)
Place of birth for the foreign-born population - Uzbekistan (%)
Place of birth for the foreign-born population - Other South Central Asia (%)
Place of birth for the foreign-born population - Burma (%)
Place of birth for the foreign-born population - Cambodia (%)
Place of birth for the foreign-born population - Indonesia (%)
Place of birth for the foreign-born population - Laos (%)
Place of birth for the foreign-born population - Malaysia (%)
Place of birth for the foreign-born population - Philippines (%)
Place of birth for the foreign-born population - Singapore (%)
Place of birth for the foreign-born population - Thailand (%)
Place of birth for the foreign-born population - Vietnam (%)
Place of birth for the foreign-born population - Other South Eastern Asia (%)
Place of birth for the foreign-born population - Armenia (%)
Place of birth for the foreign-born population - Iraq (%)
Place of birth for the foreign-born population - Israel (%)
Place of birth for the foreign-born population - Jordan (%)
Place of birth for the foreign-born population - Kuwait (%)
Place of birth for the foreign-born population - Lebanon (%)
Place of birth for the foreign-born population - Saudi Arabia (%)
Place of birth for the foreign-born population - Syria (%)
Place of birth for the foreign-born population - Turkey (%)
Place of birth for the foreign-born population - Yemen (%)
Place of birth for the foreign-born population - Other Western Asia (%)
Place of birth for the foreign-born population - Eritrea (%)
Place of birth for the foreign-born population - Ethiopia (%)
Place of birth for the foreign-born population - Kenya (%)
Place of birth for the foreign-born population - Somalia (%)
Place of birth for the foreign-born population - Uganda (%)
Place of birth for the foreign-born population - Zimbabwe (%)
Place of birth for the foreign-born population - Other Eastern Africa (%)
Place of birth for the foreign-born population - Cameroon (%)
Place of birth for the foreign-born population - Congo (%)
Place of birth for the foreign-born population - Democratic Republic of Congo (Zaire) (%)
Place of birth for the foreign-born population - Other Middle Africa (%)
Place of birth for the foreign-born population - Egypt (%)
Place of birth for the foreign-born population - Morocco (%)
Place of birth for the foreign-born population - Sudan (%)
Place of birth for the foreign-born population - Other Northern Africa (%)
Place of birth for the foreign-born population - South Africa (%)
Place of birth for the foreign-born population - Other Southern Africa (%)
Place of birth for the foreign-born population - Cabo Verde (%)
Place of birth for the foreign-born population - Ghana (%)
Place of birth for the foreign-born population - Liberia (%)
Place of birth for the foreign-born population - Nigeria (%)
Place of birth for the foreign-born population - Senegal (%)
Place of birth for the foreign-born population - Sierra Leone (%)
Place of birth for the foreign-born population - Other Western Africa (%)
Place of birth for the foreign-born population - Australia (%)
Place of birth for the foreign-born population - New Zealand (%)
Place of birth for the foreign-born population - Fiji (%)
Place of birth for the foreign-born population - Micronesia (%)
Place of birth for the foreign-born population - Bahamas (%)
Place of birth for the foreign-born population - Barbados (%)
Place of birth for the foreign-born population - Cuba (%)
Place of birth for the foreign-born population - Dominica (%)
Place of birth for the foreign-born population - Dominican Republic (%)
Place of birth for the foreign-born population - Grenada (%)
Place of birth for the foreign-born population - Haiti (%)
Place of birth for the foreign-born population - Jamaica (%)
Place of birth for the foreign-born population - St. Vincent and the Grenadines (%)
Place of birth for the foreign-born population - Trinidad and Tobago (%)
Place of birth for the foreign-born population - West Indies (%)
Place of birth for the foreign-born population - Other Caribbean (%)
Place of birth for the foreign-born population - Belize (%)
Place of birth for the foreign-born population - Costa Rica (%)
Place of birth for the foreign-born population - El Salvador (%)
Place of birth for the foreign-born population - Guatemala (%)
Place of birth for the foreign-born population - Honduras (%)
Place of birth for the foreign-born population - Mexico (%)
Place of birth for the foreign-born population - Nicaragua (%)
Place of birth for the foreign-born population - Panama (%)
Place of birth for the foreign-born population - Other Central America (%)
Place of birth for the foreign-born population - Argentina (%)
Place of birth for the foreign-born population - Bolivia (%)
Place of birth for the foreign-born population - Brazil (%)
Place of birth for the foreign-born population - Chile (%)
Place of birth for the foreign-born population - Colombia (%)
Place of birth for the foreign-born population - Ecuador (%)
Place of birth for the foreign-born population - Guyana (%)
Place of birth for the foreign-born population - Peru (%)
Place of birth for the foreign-born population - Uruguay (%)
Place of birth for the foreign-born population - Venezuela (%)
Place of birth for the foreign-born population - Other South America (%)
Place of birth for the foreign-born population - Canada (%)
Place of birth for the foreign-born population - Other Northern America (%)
Place of birth for the foreign-born population - Other (%)
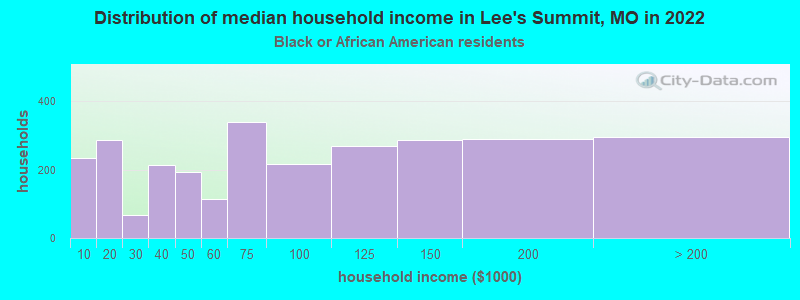
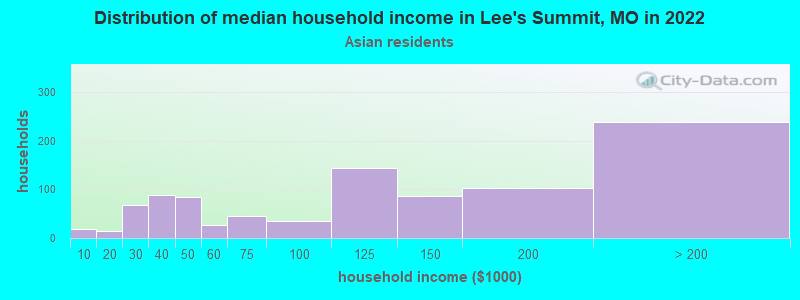
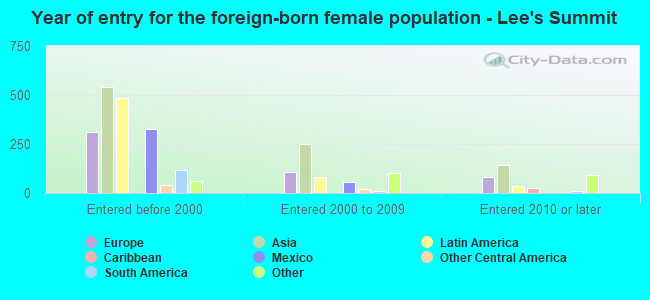
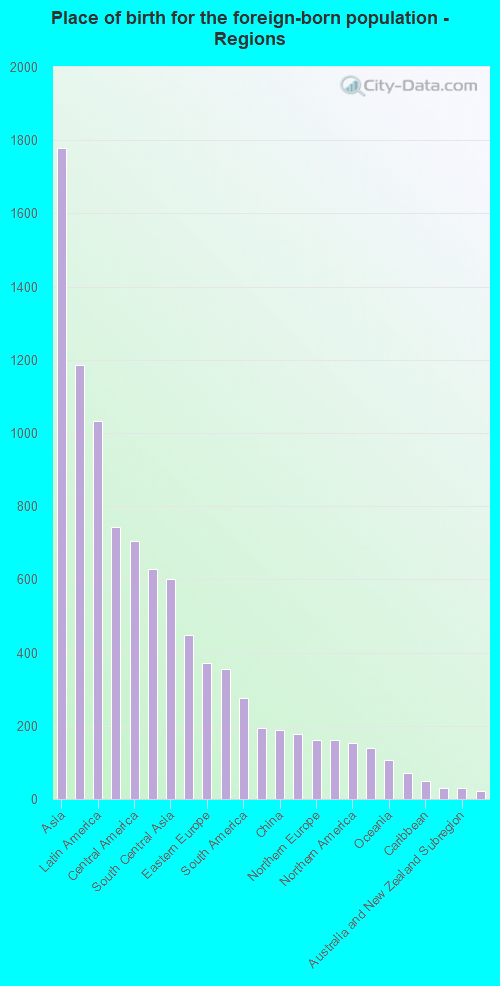
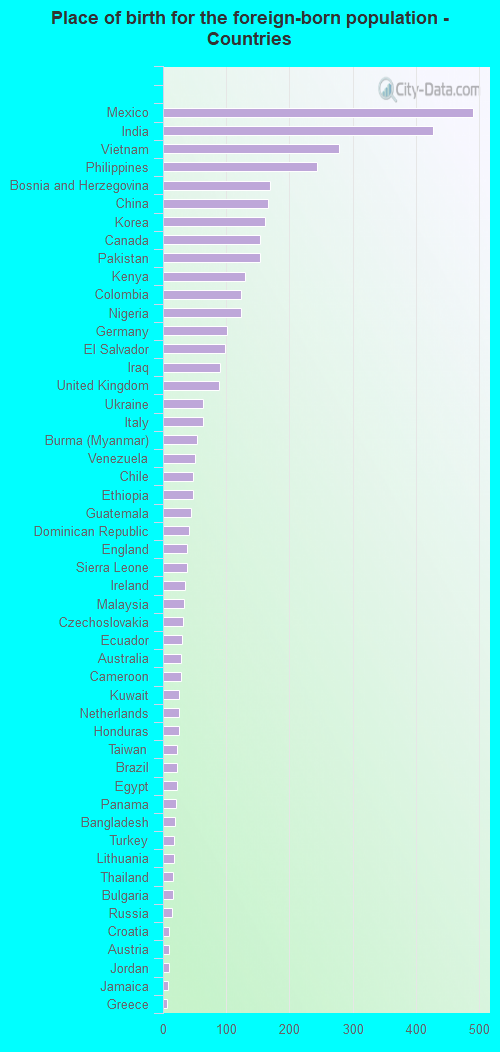
According to 2022 data, the most numerous races in Lee's Summit, MO are White alone (79,849 residents), Black alone (9,897 residents), and Two or more races (5,546 residents). 94.0% of Lee's Summit residents speak English at home. 4.2% of Lee's Summit, MO residents are foreign-born (1.8% born in Asia, 1.0% born in Latin America, 0.7% born in Europe, 0.5% born in Africa), which is 4.5% greater than the foreign-born rate of 4.0% across the entire state of Missouri.
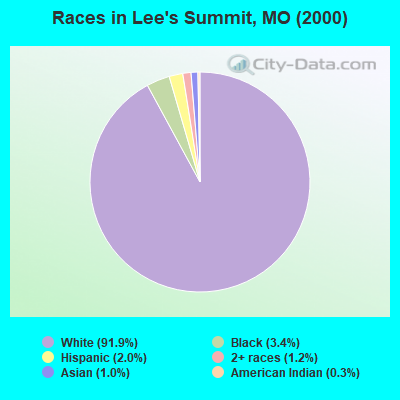
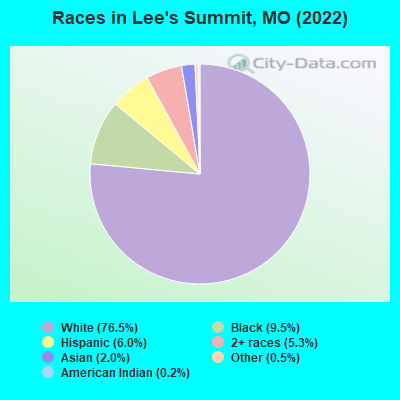
Race distribution in Lee's Summit
2000 2022
4,686,474 83.8% White alone 625,667 11.2% Black alone 118,592 2.1% Hispanic 71,905 1.3% Two or more races 61,041 1.1% Asian alone 23,302 0.4% American Indian alone 5,291 0.09% Other race alone 2,939 0.05% Native Hawaiian and Other
4,733,411 76.6% White alone 656,739 10.6% Black alone 316,300 5.1% Two or more races 291,763 4.7% Hispanic 132,436 2.1% Asian alone 27,467 0.4% Other race alone 12,313 0.2% American Indian alone 7,528 0.1% Native Hawaiian and Other
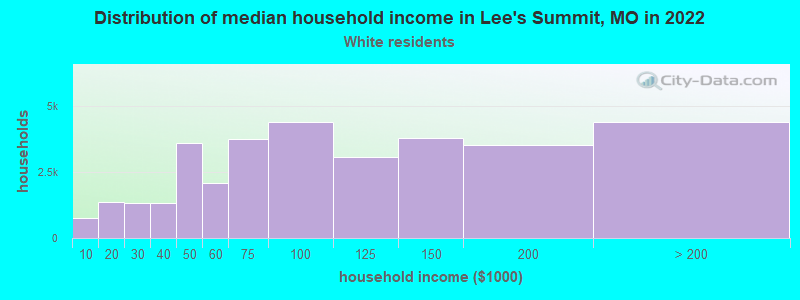
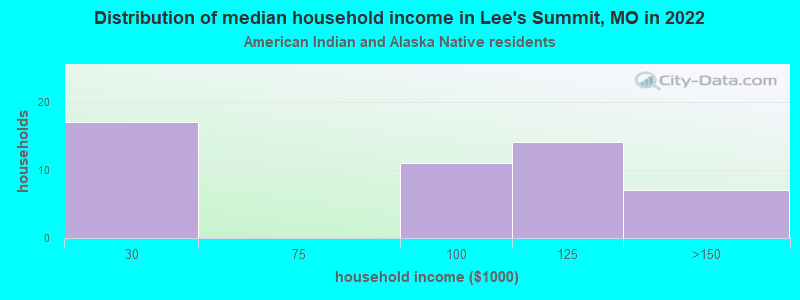
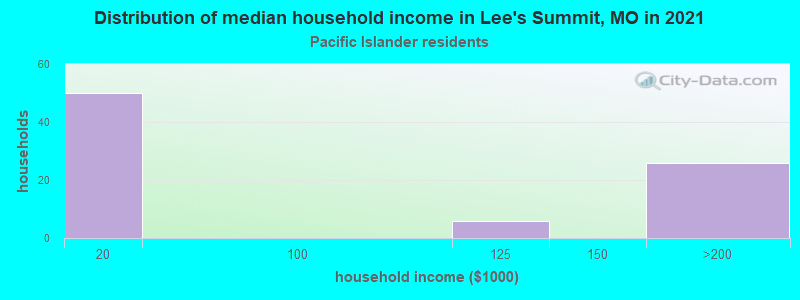
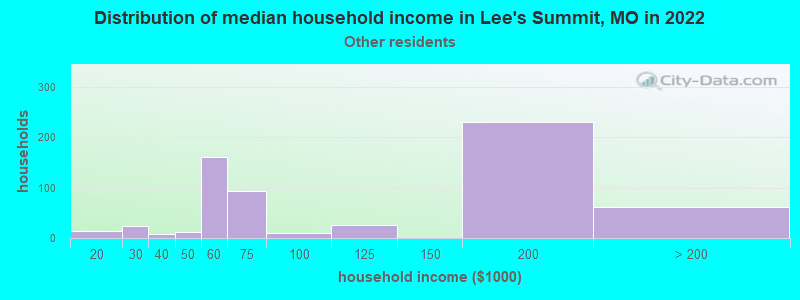
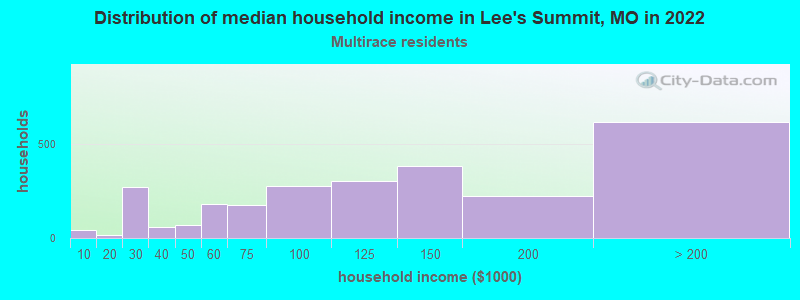
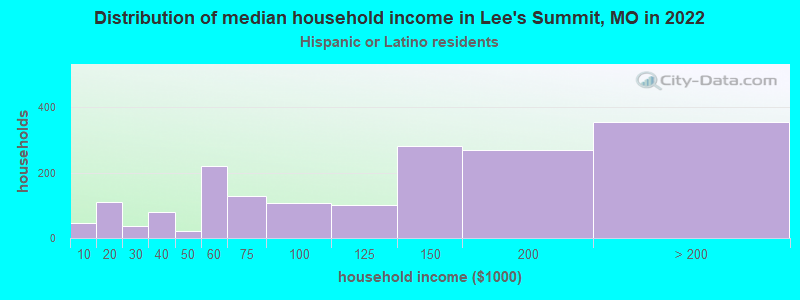
Income and house value in Lee's Summit Median household income in 2022 $87,869 White non-Hispanic householders$61,599 Black householders$83,658 Asian householders$59,931 Some other race householders$110,909 Two or more races householders$113,002 Hispanic or Latino race householdersMedian 2022 house value $338,351 White Non-Hispanic householders$391,259 Black or African American householders$239,504 American Indian or Alaska Native householders $353,062 Asian householders$245,182 Native Hawaiian and other Pacific Islander householders$287,508 Some other race householders$298,089 Two or more races householders$308,413 Hispanic or Latino householders
Median age by race in Lee's Summit
42.5 Median age for White residents42.2 43.1 30.8 Median age for Black or African American residents21.8 36.3 23.3 Median age for American Indian / Alaska Native residents17.7 45.7 39.7 Median age for Asian residents36.0 41.8 -666,666,666.0 Median age for Native Hawaiian / Pacific Islander residents-666,666,666.0 -666,666,666.0 22.8 Median age for Other race residents36.7 20.0 24.9 Median age for Two or more races residents24.7 28.1 43.0 Median age for White alone residents42.6 43.5 18.2 Median age for Hispanic or Latino residents18.8 16.4
Owner/renter occupied households by race in Lee's Summit
House owners and renters - White residents 24,362 73.0% Owner occupied8,992 27.0% Renter occupiedHouse owners and renters - Black or African American residents 1,742 55.7% Owner occupied1,384 44.3% Renter occupiedHouse owners and renters - American Indian / Alaska Native residents 29 65.9% Owner occupied15 34.1% Renter occupiedHouse owners and renters - Asian residents 920 93.2% Owner occupied67 6.8% Renter occupiedHouse owners and renters - Native Hawaiian / Pacific Islander residents 49 100.0% Owner occupiedHouse owners and renters - Other race residents 204 37.4% Owner occupied341 62.6% Renter occupiedHouse owners and renters - Two or more races residents 1,814 67.2% Owner occupied885 32.8% Renter occupiedHouse owners and renters - White alone residents 24,035 73.1% Owner occupied8,851 26.9% Renter occupiedHouse owners and renters - Hispanic or Latino residents 804 52.4% Owner occupied729 47.6% Renter occupied
Language usage in Lee's Summit
English speakers - Total 94.0% of residents of Lee's Summit speak English at home.
2.3% of residents speak Spanish at home 1,579 69.5% Speak English very well692 30.5% Speak English less than very well3.6% of residents speak other language at home 2,975 83.2% Speak English very well599 16.8% Speak English less than very well
English speakers - Born in the United States 97.3% of residents of Lee's Summit speak English at home.
1.5% of residents speak Spanish at home 358 63.3% Speak English very well208 36.7% Speak English less than very well1.1% of residents speak other language at home 364 88.6% Speak English very well47 11.4% Speak English less than very well
English speakers - Native, born elsewhere 94.8% of residents of Lee's Summit speak English at home.
5.2% of residents speak other language at home 62 100.0% Speak English very well
English speakers - Foreign-born 25.5% of residents of Lee's Summit speak English at home.
17.4% of residents speak Spanish at home 319 39.7% Speak English very well484 60.3% Speak English less than very well57.1% of residents speak other language at home 2,130 81.1% Speak English very well498 18.9% Speak English less than very well
White (Caucasian) - Speak only English Native:
98.4% (73,981)Foreign-born:
39.3% (782)
White (Caucasian) - Speak another language Native:
1.6% (1,167)Foreign-born:
60.7% (1,207)
Black or African American - Speak only English Native:
97.5% (7,579)Foreign-born:
5.1% (21)
Black or African American - Speak another language Native:
2.4% (187)Foreign-born:
90.8% (381)
American Indian / Alaska Native - Speak only English Native:
91.2% (113)Foreign-born:
100.0% (6)
Asian - Speak only English Native:
84.3% (715)Foreign-born:
25.8% (289)
Asian - Speak another language Native:
15.7% (133)Foreign-born:
74.2% (833)
Other race - Speak another language Native:
32.6% (386)Foreign-born:
100.0% (555)
Two or more races - Speak only English Native:
89.4% (6,997)Foreign-born:
11.1% (68)
Two or more races - Speak another language Native:
9.9% (775)Foreign-born:
78.9% (484)
White alone - Speak only English Native:
98.9% (73,013)Foreign-born:
39.3% (782)
White alone - Speak another language Native:
1.1% (817)Foreign-born:
60.7% (1,207)
Hispanic or Latino - Speak another language Native:
24.1% (1,114)Foreign-born:
100.0% (777)
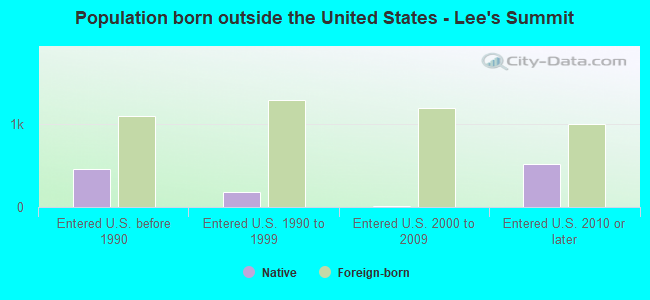
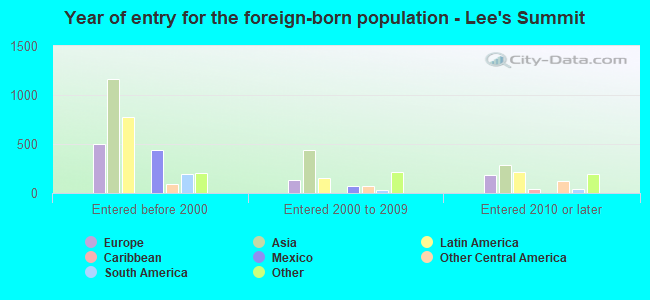
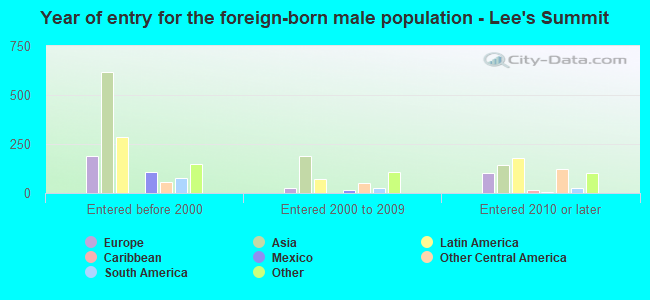
Foreign-born residents in Lee's Summit 4,266 residents are foreign born (1.8% Asia , 1.0% Latin America , 0.7% Europe , 0.5% Africa ).
This city:
4.2%Missouri:
4.2%
Marital status for residents in Lee's Summit Marital status - White (Caucasian) population 15 years and over
Males 27.9% Never married60.1% Now married0.5% Separated3.4% Widowed8.2% DivorcedFemales 21.3% Never married55.4% Now married1.2% Separated7.8% Widowed14.2% DivorcedWomen who gave birth in the past 12 months Now married:
81.4% (799)Unmarried:
18.6% (182)
Women who did not give birth in the past 12 months Now married:
52.2% (8,698)Unmarried:
47.8% (7,952)
Marital status - Black or African American population 15 years and over
Males 53.0% Never married35.8% Now married0.0% Separated0.4% Widowed10.8% DivorcedFemales 32.6% Never married47.7% Now married1.5% Separated16.5% Widowed1.6% DivorcedWomen who gave birth in the past 12 months Now married:
87.9% (159)Unmarried:
12.1% (22)
Women who did not give birth in the past 12 months Now married:
25.3% (496)Unmarried:
74.7% (1,465)
Marital status - American Indian / Alaska Native population 15 years and over
Males 83.3% Never married16.7% Now married0.0% Separated0.0% Widowed0.0% DivorcedFemales 32.6% Never married58.1% Now married0.0% Separated0.0% Widowed9.3% DivorcedWomen who gave birth in the past 12 months Now married:
0.0% (0)Unmarried:
100.0% (2)
Women who did not give birth in the past 12 months Now married:
33.3% (8)Unmarried:
66.7% (16)
Marital status - Asian population 15 years and over
Males 21.2% Never married68.6% Now married0.0% Separated0.0% Widowed10.2% DivorcedFemales 19.7% Never married75.3% Now married1.2% Separated1.0% Widowed2.7% DivorcedWomen who gave birth in the past 12 months Now married:
100.0% (51)Unmarried:
0.0% (0)
Women who did not give birth in the past 12 months Now married:
69.6% (526)Unmarried:
30.4% (229)
Marital status - Native Hawaiian / Pacific Islander population 15 years and over
Males 32.1% Never married67.9% Now married0.0% Separated0.0% Widowed0.0% DivorcedFemales 0.0% Never married100.0% Now married0.0% Separated0.0% Widowed0.0% DivorcedMarital status - Other race population 15 years and over
Males 53.0% Never married45.6% Now married0.0% Separated0.0% Widowed1.4% DivorcedFemales 24.9% Never married61.3% Now married1.3% Separated4.0% Widowed8.5% DivorcedWomen who gave birth in the past 12 months Now married:
0.0% (0)Unmarried:
100.0% (10)
Women who did not give birth in the past 12 months Now married:
57.1% (292)Unmarried:
42.9% (219)
Marital status - Two or more races population 15 years and over
Males 59.5% Never married33.4% Now married0.0% Separated0.0% Widowed7.1% DivorcedFemales 37.0% Never married38.4% Now married17.1% Separated1.1% Widowed6.3% DivorcedWomen who gave birth in the past 12 months Now married:
100.0% (108)Unmarried:
0.0% (0)
Women who did not give birth in the past 12 months Now married:
43.6% (834)Unmarried:
56.4% (1,079)
Marital status - White alone, not Hispanic / Latino population 15 years and over
Males 27.6% Never married60.2% Now married0.5% Separated3.4% Widowed8.3% DivorcedFemales 21.3% Never married55.9% Now married1.2% Separated7.9% Widowed13.7% DivorcedWomen who gave birth in the past 12 months Now married:
81.4% (799)Unmarried:
18.6% (182)
Women who did not give birth in the past 12 months Now married:
53.0% (8,698)Unmarried:
47.0% (7,704)
Marital status - Hispanic or Latino population 15 years and over
Males 66.2% Never married31.1% Now married0.0% Separated0.0% Widowed2.7% DivorcedFemales 41.8% Never married34.2% Now married3.2% Separated1.5% Widowed19.3% DivorcedWomen who gave birth in the past 12 months Now married:
0.0% (0)Unmarried:
100.0% (11)
Women who did not give birth in the past 12 months Now married:
49.2% (621)Unmarried:
50.8% (640)
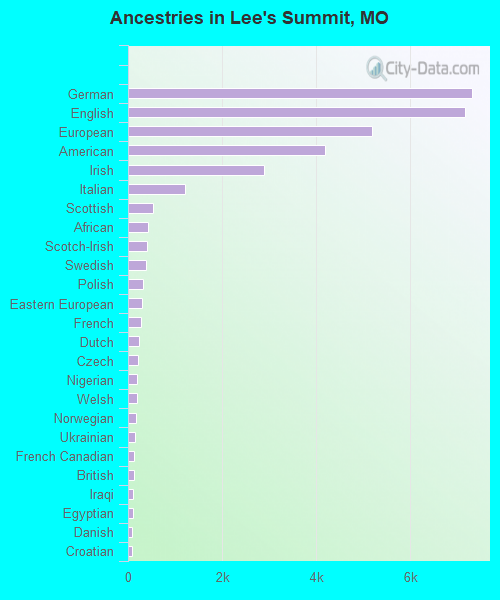
Ancestries in Lee's Summit
7,308 15.5% German7,162 15.2% English5,182 11.0% European4,180 8.9% American2,900 6.2% Irish1,209 2.6% Italian521 1.1% Scottish425 0.9% African401 0.9% Scotch-Irish391 0.8% Swedish326 0.7% Polish306 0.6% Eastern European266 0.6% French233 0.5% Dutch216 0.5% Czech195 0.4% Nigerian184 0.4% Welsh162 0.3% Norwegian154 0.3% Ukrainian131 0.3% French Canadian123 0.3% British116 0.2% Iraqi110 0.2% Egyptian90 0.2% Danish80 0.2% Croatian53 0.1% Northern European52 0.1% Jordanian52 0.1% Scandinavian51 0.1% Greek43 0.09% Lebanese35 0.07% Lithuanian34 0.07% Brazilian30 0.06% Russian24 0.05% Kenyan20 0.04% Bulgarian18 0.04% Hungarian16 0.03% Slavic15 0.03% Slovak14 0.03% Turkish13 0.03% Icelander13 0.03% Swiss13 0.03% Austrian12 0.03% Pennsylvania German11 0.02% Slovene10 0.02% Ethiopian10 0.02% Jamaican9 0.02% Canadian8 0.02% Latvian8 0.02% Finnish6 0.01% Serbian5 0.01% Yugoslavian
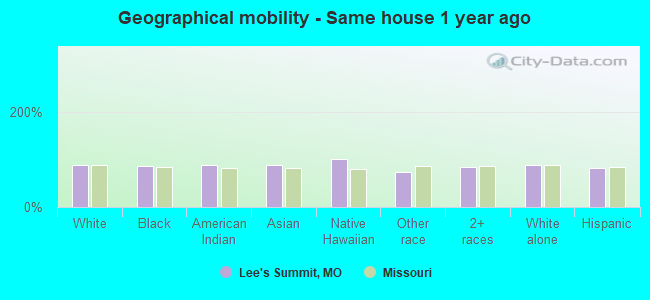
Geographical mobility in Lee's Summit Same house 1 year ago 71,318 88.5% White (Caucasian)7,166 85.1% Black or African American114 88.5% American Indian / Alaska Native2,090 89.5% Asian144 100.0% Native Hawaiian / Pacific Islander1,162 73.7% Other race7,483 82.7% Two or more races70,303 88.8% White alone, not Hispanic / Latino5,045 81.7% Hispanic or LatinoMoved within same county 6,359 7.9% White / Caucasian656 7.8% Black or African American17 13.2% American Indian / Alaska Native59 2.5% Asian118 7.5% Other race983 10.9% Two or more races6,108 7.7% White alone, not Hispanic / Latino785 12.7% Hispanic or LatinoMoved within same state 1,083 1.3% White / Caucasian340 4.0% Black or African American27 1.1% Asian103 6.5% Other race145 1.6% Two or more races1,083 1.4% White alone, not Hispanic / Latino196 3.2% Hispanic or LatinoMoved from different state 1,800 2.2% White / Caucasian264 3.1% Black or African American111 4.7% Asian188 11.9% Other race335 3.7% Two or more races1,650 2.1% White alone, not Hispanic / Latino150 2.4% Hispanic or LatinoMoved from abroad 15 0.2% Black or African American11 0.1% Two or more races
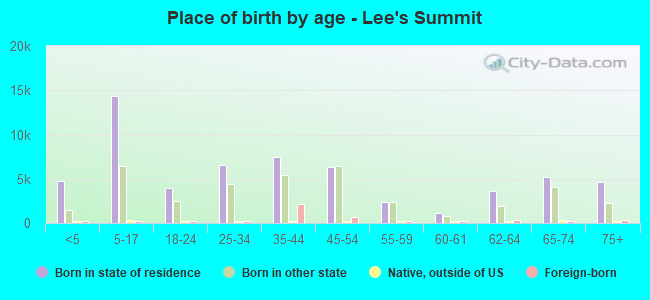
Children Nativity (place of birth) in Lee's Summit
Children under 6 years - Living with two parents Both parents native 4,886 100.0% NativeBoth parents foreign-born 481 100.0% NativeOne native, one foreign-born parent 269 100.0% NativeChildren under 6 years - Living with one parent Native parent 1,506 100.0% NativeForeign-born parent 291 100.0% NativeChildren 6 to 17 years - Living with two parents Both parents native 10,969 99.5% Native54 0.5% Foreign-bornBoth parents foreign-born 1,024 100.0% NativeOne native, one foreign-born parent 670 91.8% Native60 8.2% Foreign-bornChildren 6 to 17 years - Living with one parent Native parent 5,427 100.0% NativeForeign-born parent 492 50.0% Native492 50.0% Foreign-born
Grandparents responsible for own grandchildren in Lee's Summit
Grandparents (30 to 59 years) White / Caucasian 196 34.0% Responsible for grandchildren381 66.0% Not responsible for grandchildrenBlack or African American 20 100.0% Not responsible for grandchildrenTwo or more races 15 100.0% Not responsible for grandchildrenWhite alone, not Hispanic / Latino 196 34.0% Responsible for grandchildren381 66.0% Not responsible for grandchildrenHispanic or Latino 31 100.0% Responsible for grandchildrenGrandparents (60 years and over) White / Caucasian 280 25.8% Responsible for grandchildren806 74.2% Not responsible for grandchildrenBlack or African American 55 36.6% Responsible for grandchildren95 63.4% Not responsible for grandchildrenTwo or more races 2 3.8% Responsible for grandchildren61 96.2% Not responsible for grandchildrenWhite alone, not Hispanic / Latino 280 25.8% Responsible for grandchildren806 74.2% Not responsible for grandchildren